| Param | Original file | Final file |
|---|---|---|
| Filename | modeM0/AS1C02_045T03_9000001558_10783cztM0_level2.evt | modeM0/AS1C02_045T03_9000001558_10783cztM0_level2_quad_clean.evt |
| Size (bytes) | 527,166,720 | 126,544,320 |
| Size | 502.7 MB | 120.7 MB |
| Events in quadrant A | 3,261,584 | 867,464 |
| Events in quadrant B | 4,523,619 | 864,149 |
| Events in quadrant C | 2,902,413 | 872,570 |
| Events in quadrant D | 4,853,766 | 792,314 |
| Mode SS | |||
|---|---|---|---|
| Quadrant | BADHDUFLAG | Total packets | Discarded packets |
| A | 0 | 128 | 0 |
| B | 0 | 128 | 0 |
| C | 0 | 128 | 0 |
| D | 0 | 128 | 0 |
| Mode M0 | |||
|---|---|---|---|
| Quadrant | BADHDUFLAG | Total packets | Discarded packets |
| A | 0 | 13787 | 2 |
| B | 0 | 17612 | 1 |
| C | 0 | 12810 | 1 |
| D | 0 | 18686 | 1 |
| Mode M9 | |||
|---|---|---|---|
| Quadrant | BADHDUFLAG | Total packets | Discarded packets |
| A | 0 | 13 | 0 |
| B | 0 | 13 | 0 |
| C | 0 | 13 | 0 |
| D | 0 | 13 | 0 |
| Quadrant | Total seconds | Saturated seconds | Saturation percentage |
|---|---|---|---|
| A | 6240 | 151 | 2.419872% |
| B | 6240 | 490 | 7.852564% |
| C | 6240 | 64 | 1.025641% |
| D | 6240 | 575 | 9.214744% |
Noise dominated data is calculated using 1-second bins in cleaned event files. If a bin has >2000 counts, and if more than 50% of those come from <1% of pixels, then it is considered to be noise-dominated and hence unusable.
| Quadrant | # 1 sec bins | Bins with >0 counts | Bins with >2000 counts | High rate bins dominated by noise | Noise dominated (total time) | Noise dominated (detector-on time) | Marked lightcurve |
|---|---|---|---|---|---|---|---|
| A | 7530 | 6241 | 45 | 45 | 0.60% | 0.72% | 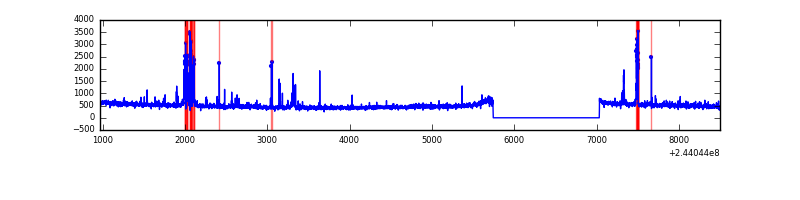 |
| B | 7530 | 6241 | 287 | 287 | 3.81% | 4.60% | 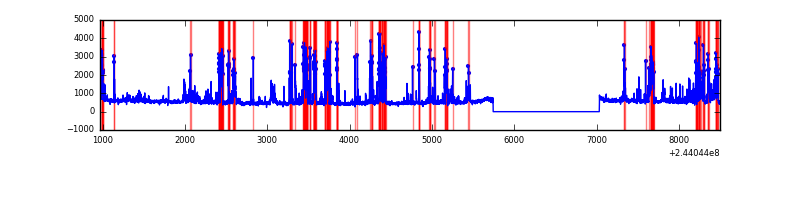 |
| C | 7530 | 6241 | 0 | 0 | 0.00% | 0.00% | 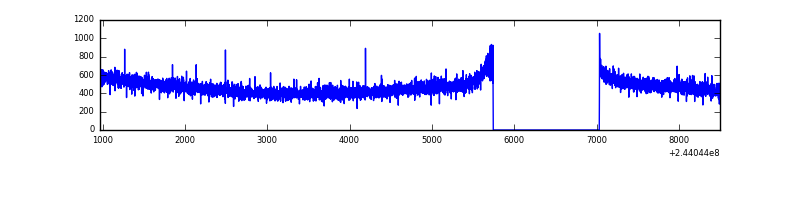 |
| D | 7530 | 6241 | 397 | 397 | 5.27% | 6.36% | 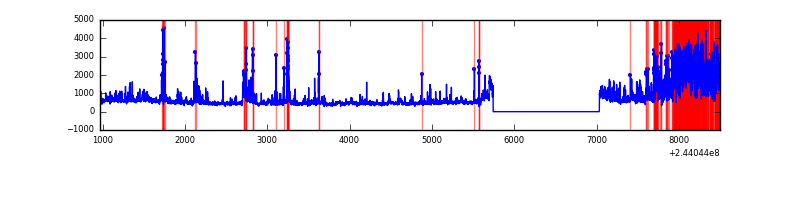 |
Top three noisy pixels from each quadrant. If the there are fewer than three noisy pixels in the level2.evt file, extra rows are filled as -1
| Pixel properties | Quadrant properties | ||||||
|---|---|---|---|---|---|---|---|
| Quadrant | DetID | PixID | Counts | Sigma | Mean | Median | Sigma |
| A | 15 | 174 | 234496 | 1531.41 | 770 | 757 | 152.6 |
| A | 1 | 162 | 28267 | 180.24 | 770 | 757 | 152.6 |
| A | 1 | 161 | 10621 | 64.63 | 770 | 757 | 152.6 |
| B | 4 | 239 | 1361583 | 9726.62 | 758 | 741 | 139.9 |
| B | 15 | 204 | 123636 | 878.39 | 758 | 741 | 139.9 |
| B | 0 | 219 | 42488 | 298.38 | 758 | 741 | 139.9 |
| C | 13 | 61 | 5612 | 29.02 | 742 | 747 | 167.6 |
| C | 8 | 222 | 3988 | 19.33 | 742 | 747 | 167.6 |
| C | 14 | 67 | 2038 | 7.7 | 742 | 747 | 167.6 |
| D | 13 | 104 | 617209 | 3680.03 | 712 | 694 | 167.5 |
| D | 10 | 199 | 494440 | 2947.21 | 712 | 694 | 167.5 |
| D | 1 | 52 | 273662 | 1629.37 | 712 | 694 | 167.5 |
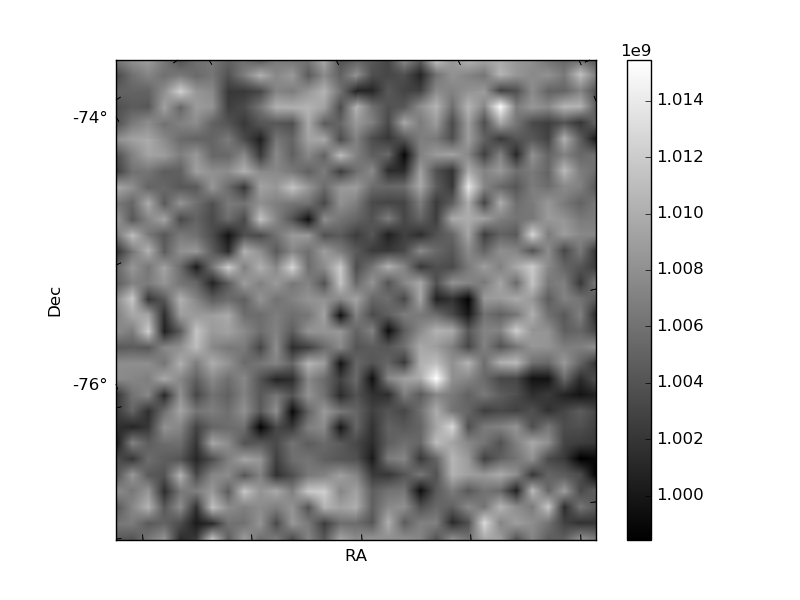
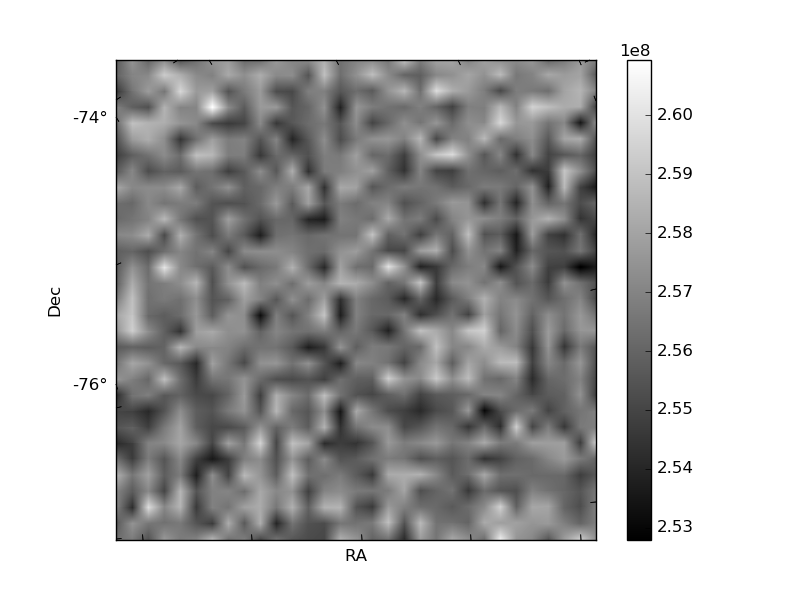
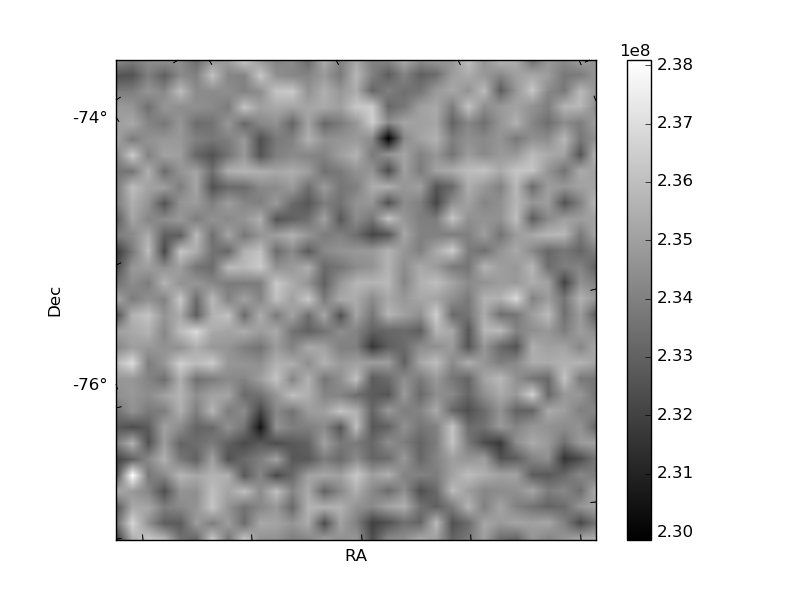
Histogram calculated using DETX and DETY for each event in the final _common_clean file
| Quadrant A | 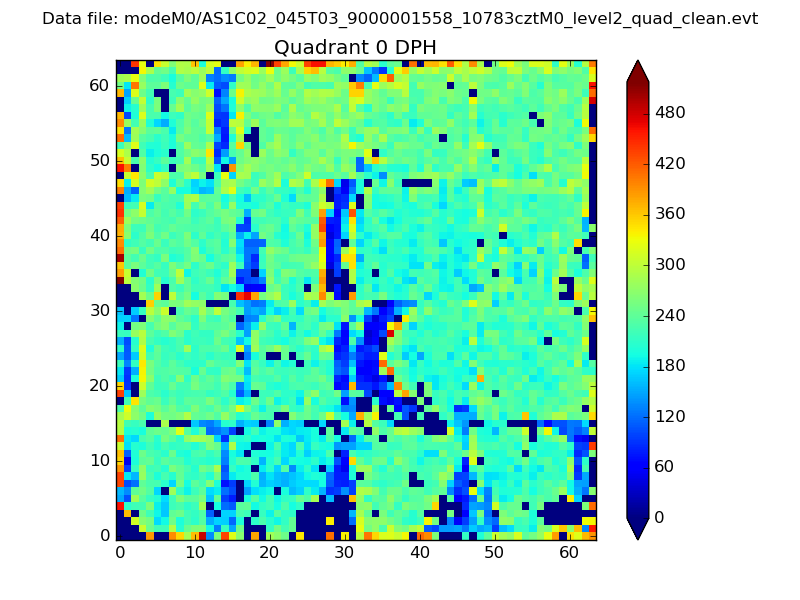 |
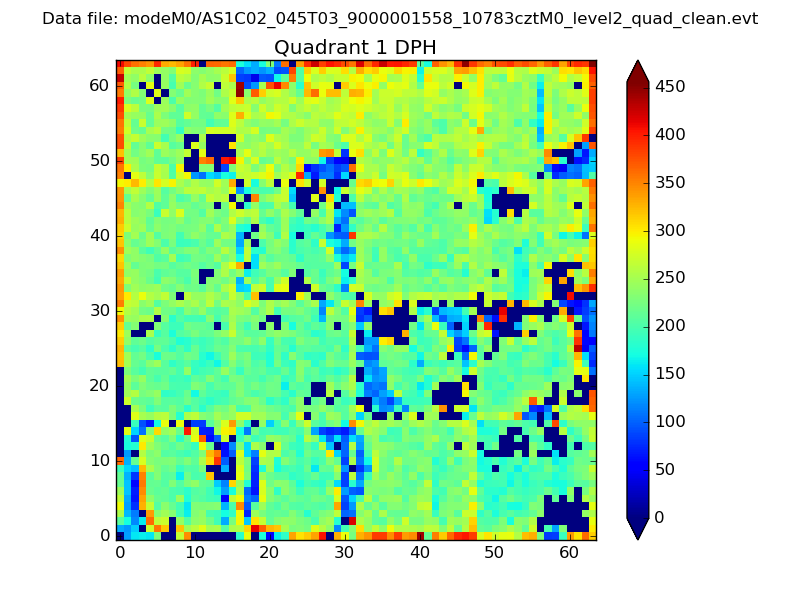 |
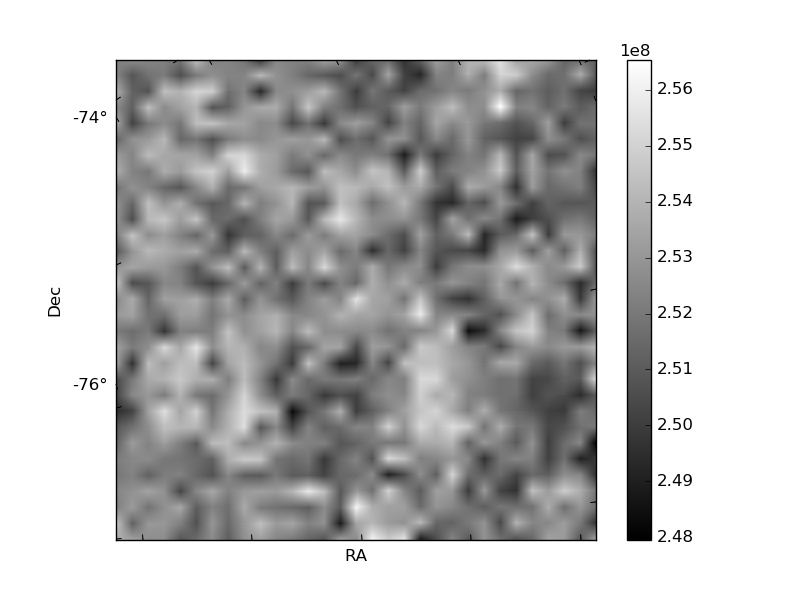
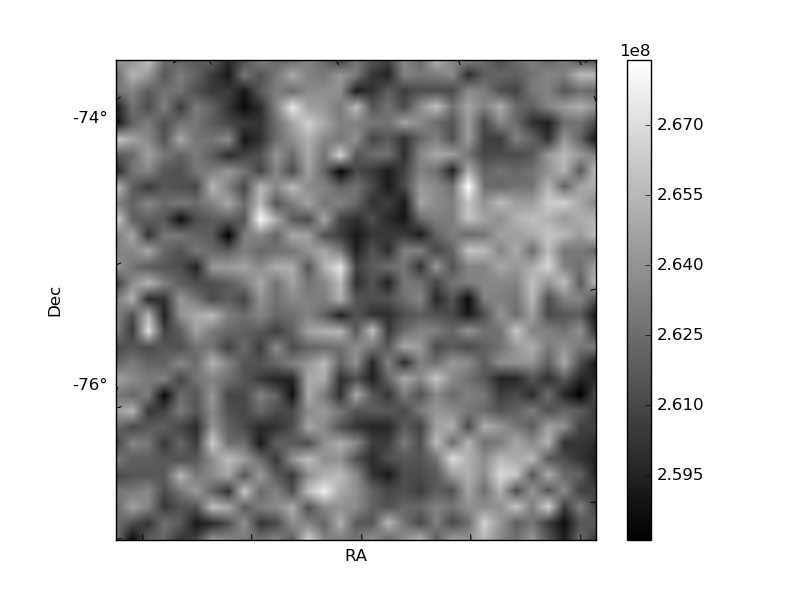
Quadrant B |
|---|---|---|---|
| Quadrant D | 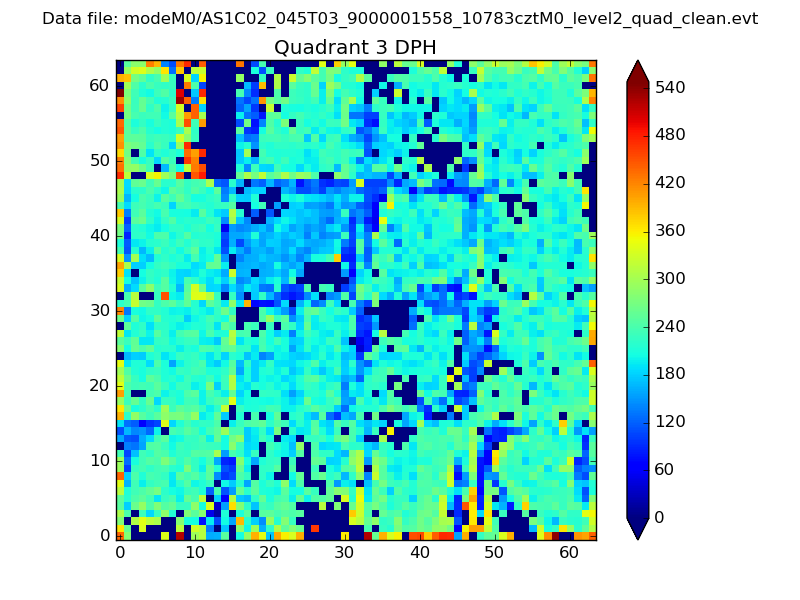 |
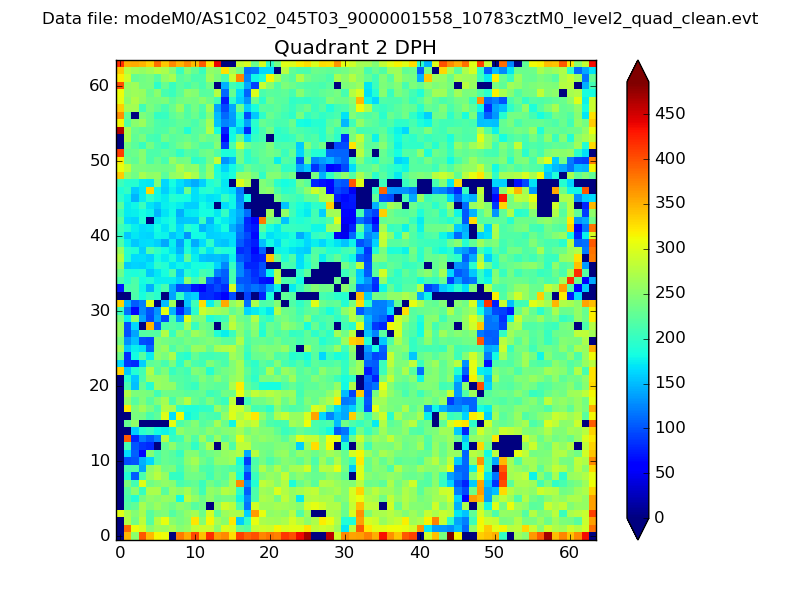 |
Quadrant C |
| Plot type | Count rate plots | Images |
|---|---|---|
| Comparison with Poisson distribution Blue bars denote a histogram of data divided into 1 sec bins. Red curve is a Poisson curve with rate = median count rate of data. |
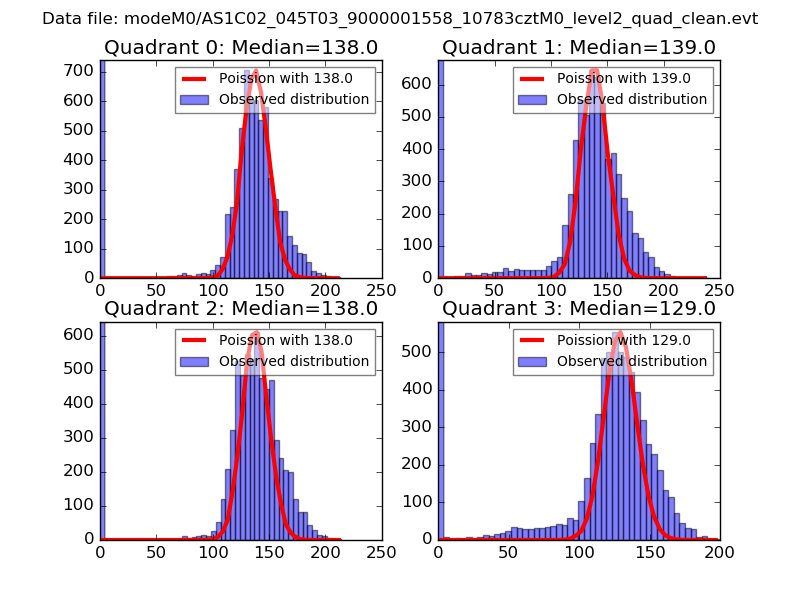 |
 |
| Quadrant-wise count rates Data is divided into 100 sec bins |
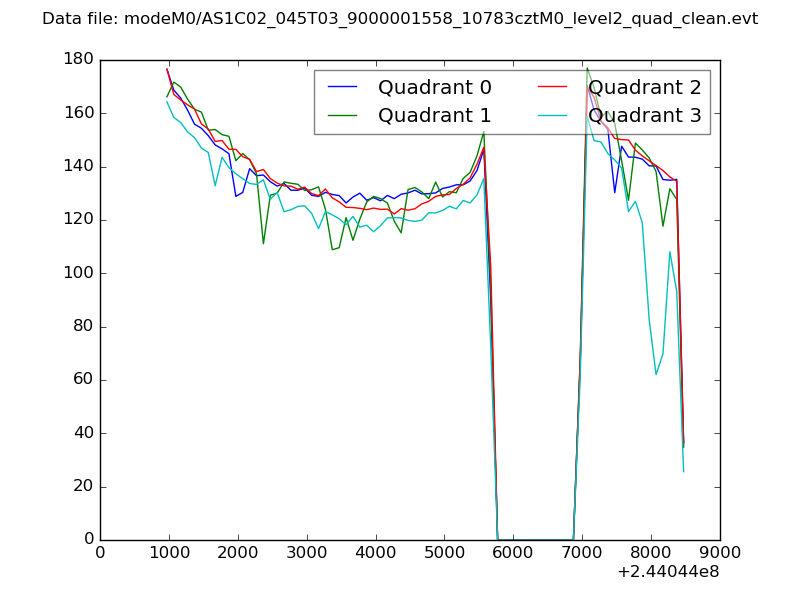 |
|
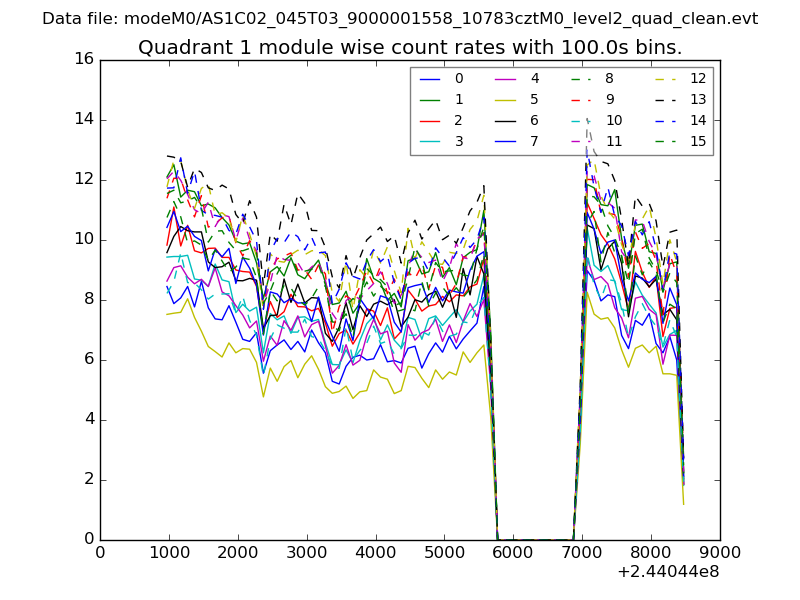
| Module-wise count rates for Quadrant A Data is divided into 100 sec bins |
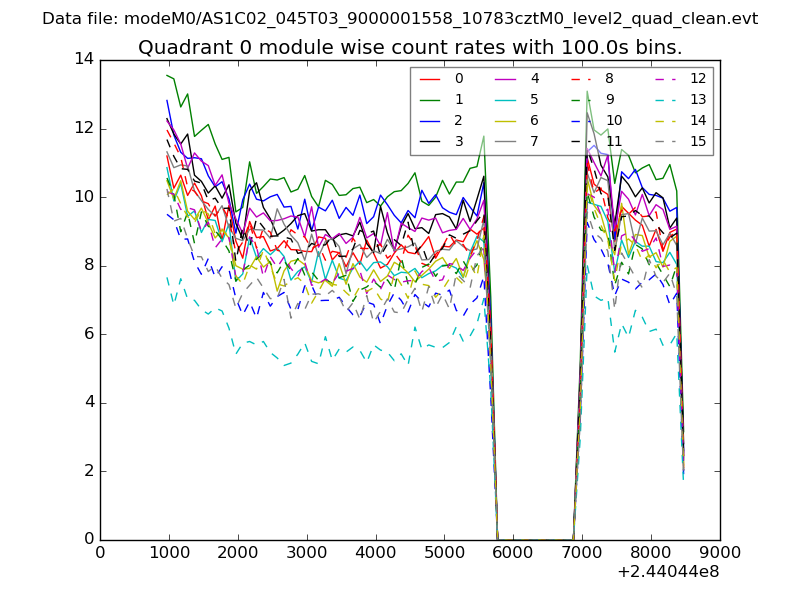 |
 |
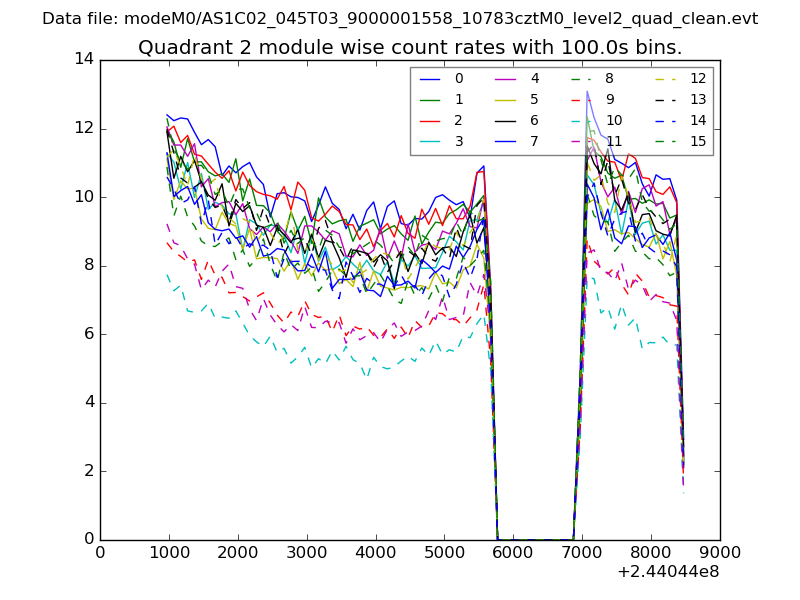
| Module-wise count rates for Quadrant B Data is divided into 100 sec bins |
 |
 |
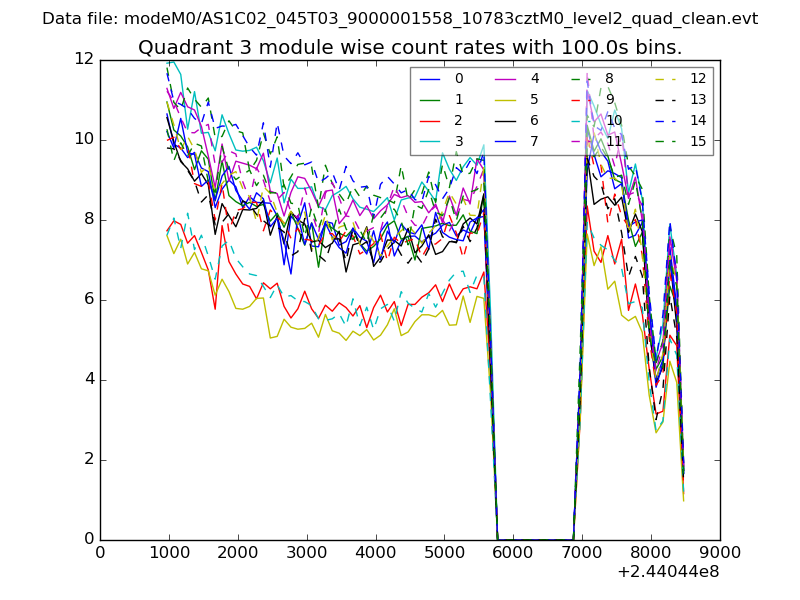
| Module-wise count rates for Quadrant C Data is divided into 100 sec bins |
 |
 |
| Module-wise count rates for Quadrant D Data is divided into 100 sec bins |
 |
 |
| Parameter | Plot |
|---|---|
| CZT HV Monitor | 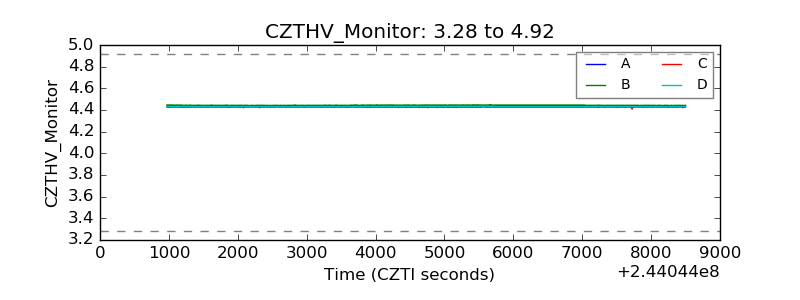 |
| D_VDD | 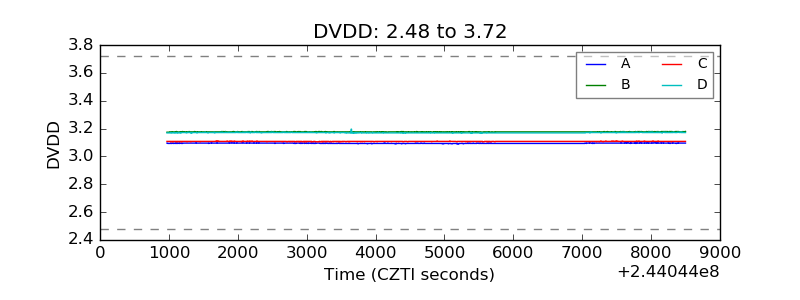 |
| Temperature 1 | 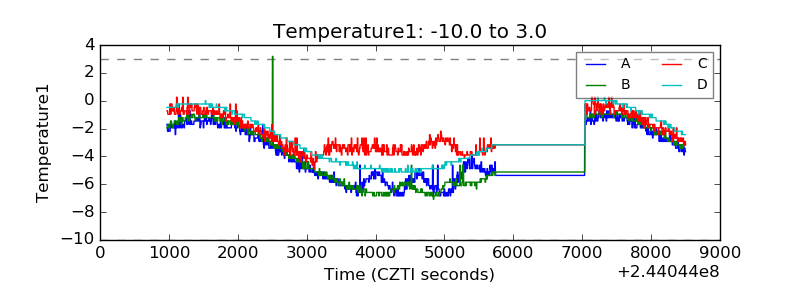 |
| Veto HV Monitor | 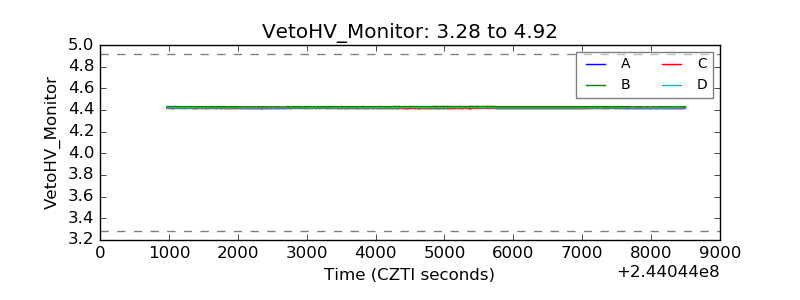 |
| Veto LLD | 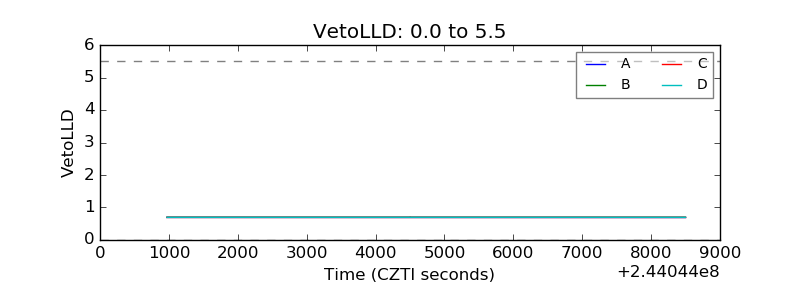 |
| Alpha Counter | 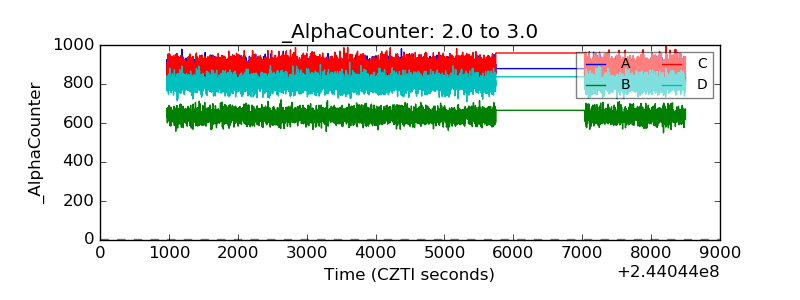 |
| _CPM_Rate | 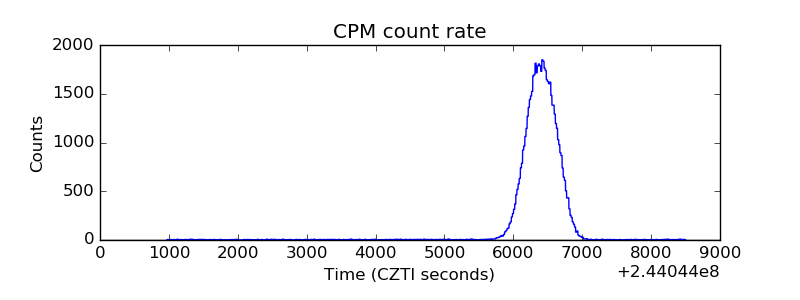 |
| CZT Counter | 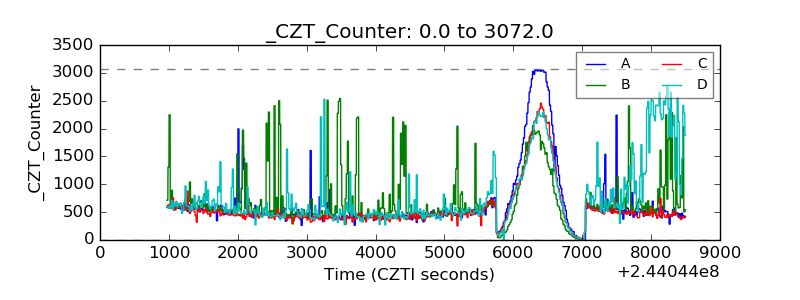 |
| +2.5 Volts monitor |  |
| +5 Volts monitor |  |
| _ROLL_ROT | 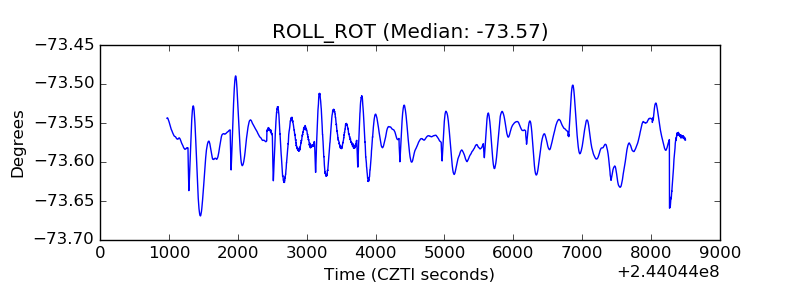 |
| _Roll_DEC | 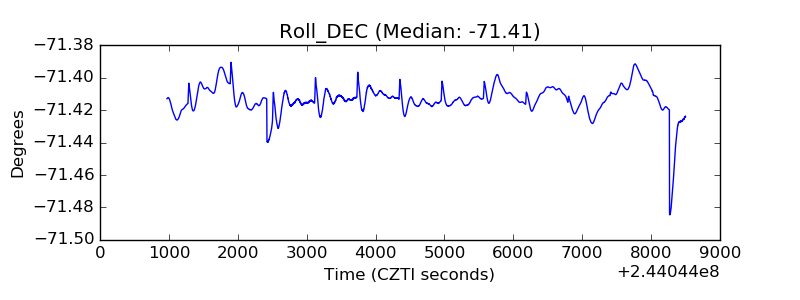 |
| _Roll_RA | 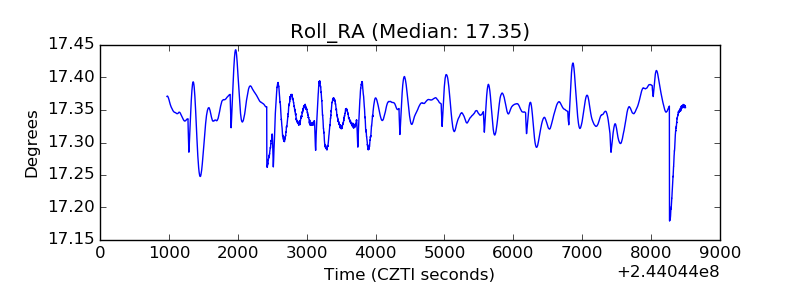 |
| Veto Counter | 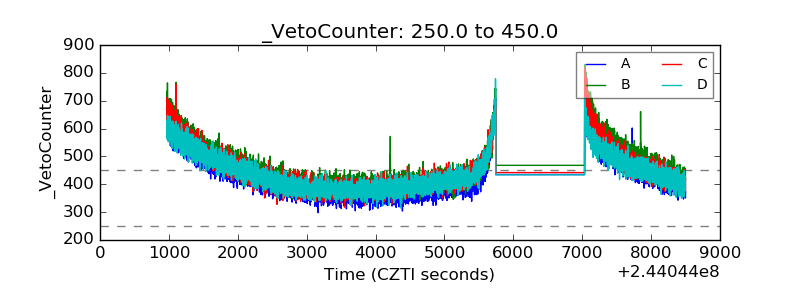 |