| Param | Original file | Final file |
|---|---|---|
| Filename | modeM0/AS1C02_045T03_9000001558_10784cztM0_level2.evt | modeM0/AS1C02_045T03_9000001558_10784cztM0_level2_quad_clean.evt |
| Size (bytes) | 167,218,560 | 32,149,440 |
| Size | 159.5 MB | 30.7 MB |
| Events in quadrant A | 866,361 | 226,748 |
| Events in quadrant B | 1,351,035 | 217,580 |
| Events in quadrant C | 741,239 | 230,743 |
| Events in quadrant D | 1,993,756 | 179,238 |
| Mode SS | |||
|---|---|---|---|
| Quadrant | BADHDUFLAG | Total packets | Discarded packets |
| A | 0 | 34 | 0 |
| B | 0 | 34 | 0 |
| C | 0 | 34 | 2 |
| D | 0 | 34 | 0 |
| Mode M0 | |||
|---|---|---|---|
| Quadrant | BADHDUFLAG | Total packets | Discarded packets |
| A | 0 | 3794 | 208 |
| B | 0 | 5543 | 483 |
| C | 0 | 3460 | 162 |
| D | 0 | 8127 | 1109 |
| Quadrant | Total seconds | Saturated seconds | Saturation percentage |
|---|---|---|---|
| A | 1640 | 25 | 1.524390% |
| B | 1592 | 157 | 9.861809% |
| C | 1641 | 0 | 0.000000% |
| D | 1549 | 405 | 26.145901% |
Noise dominated data is calculated using 1-second bins in cleaned event files. If a bin has >2000 counts, and if more than 50% of those come from <1% of pixels, then it is considered to be noise-dominated and hence unusable.
| Quadrant | # 1 sec bins | Bins with >0 counts | Bins with >2000 counts | High rate bins dominated by noise | Noise dominated (total time) | Noise dominated (detector-on time) | Marked lightcurve |
|---|---|---|---|---|---|---|---|
| A | 1722 | 1711 | 13 | 13 | 0.75% | 0.76% | 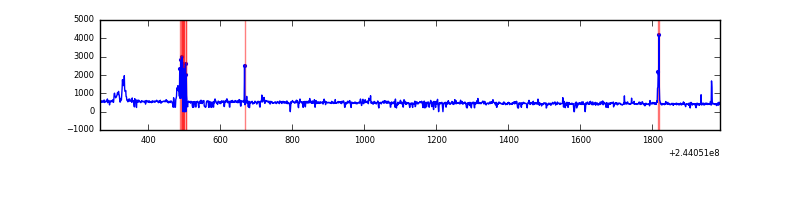 |
| B | 1722 | 1699 | 98 | 98 | 5.69% | 5.77% | 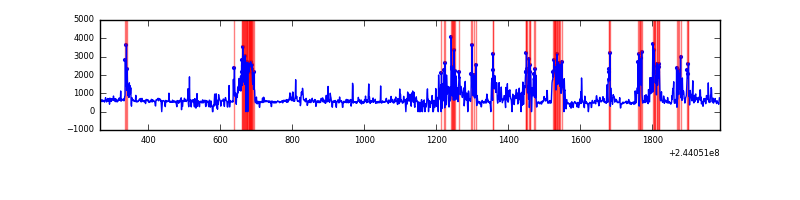 |
| C | 1722 | 1716 | 0 | 0 | 0.00% | 0.00% | 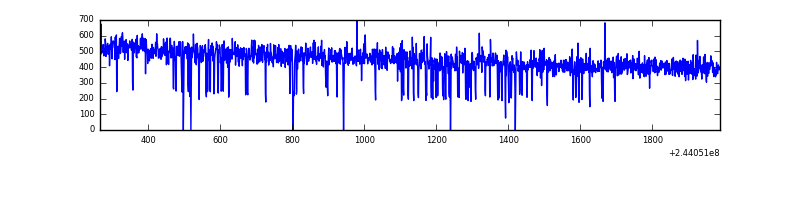 |
| D | 1722 | 1661 | 294 | 294 | 17.07% | 17.70% |  |
Top three noisy pixels from each quadrant. If the there are fewer than three noisy pixels in the level2.evt file, extra rows are filled as -1
| Pixel properties | Quadrant properties | ||||||
|---|---|---|---|---|---|---|---|
| Quadrant | DetID | PixID | Counts | Sigma | Mean | Median | Sigma |
| A | 15 | 174 | 70184 | 1665.4 | 201 | 197 | 42.0 |
| A | 1 | 162 | 7273 | 168.38 | 201 | 197 | 42.0 |
| A | 11 | 29 | 3345 | 74.91 | 201 | 197 | 42.0 |
| B | 4 | 239 | 520382 | 13904.19 | 190 | 186 | 37.4 |
| B | 15 | 204 | 70681 | 1884.24 | 190 | 186 | 37.4 |
| B | 0 | 219 | 12476 | 328.5 | 190 | 186 | 37.4 |
| C | 13 | 61 | 1497 | 29.04 | 189 | 191 | 45.0 |
| C | 8 | 222 | 959 | 17.08 | 189 | 191 | 45.0 |
| C | 12 | 4 | 509 | 7.07 | 189 | 191 | 45.0 |
| D | 13 | 104 | 627158 | 15495.27 | 160 | 156 | 40.5 |
| D | 10 | 199 | 415530 | 10265.25 | 160 | 156 | 40.5 |
| D | 12 | 233 | 104478 | 2578.14 | 160 | 156 | 40.5 |
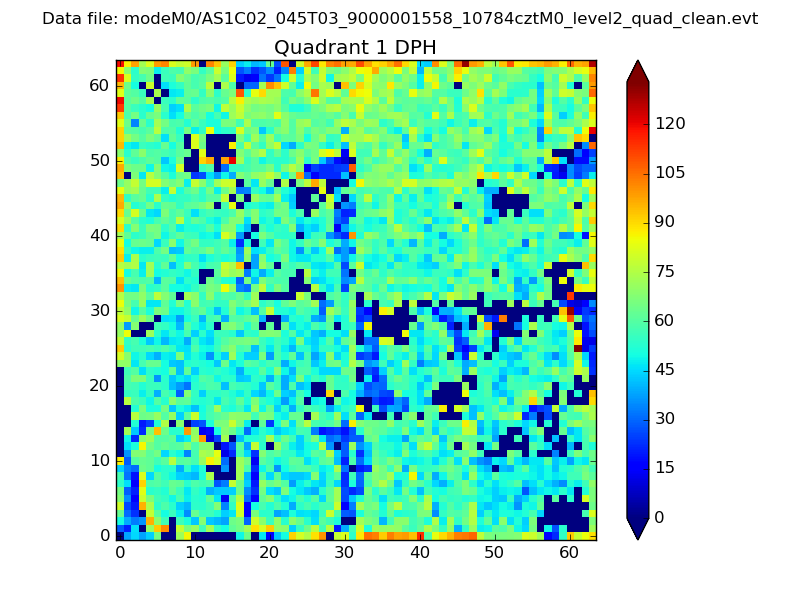
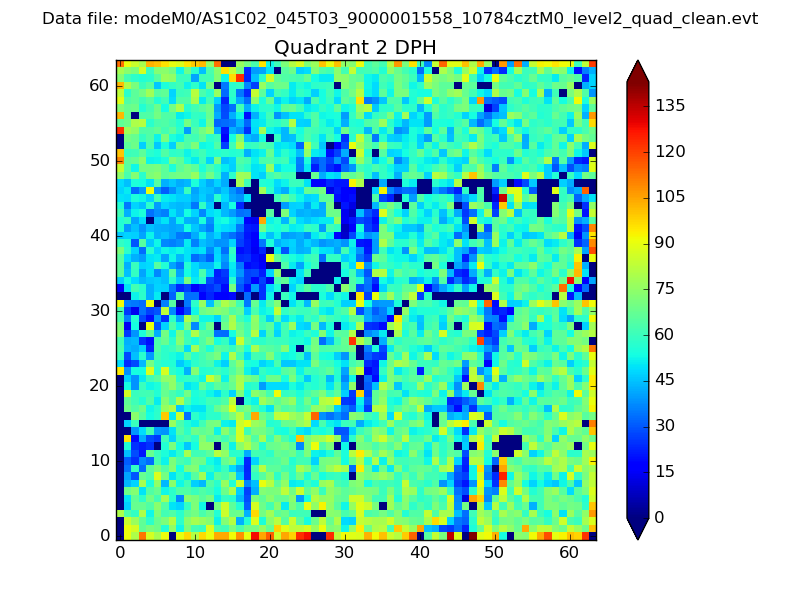
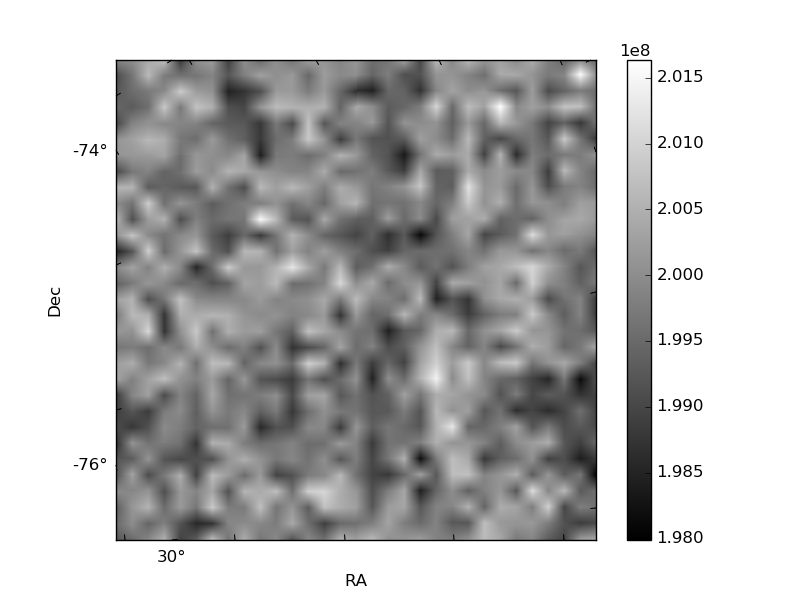
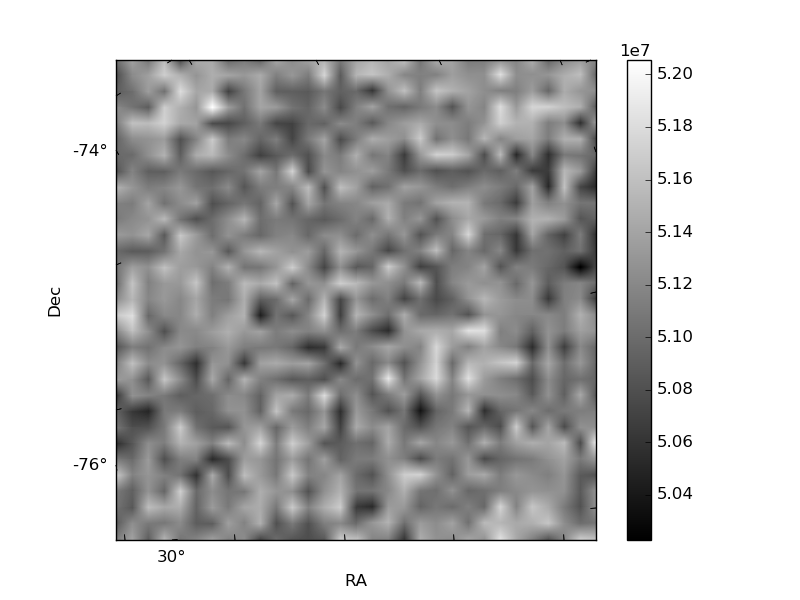
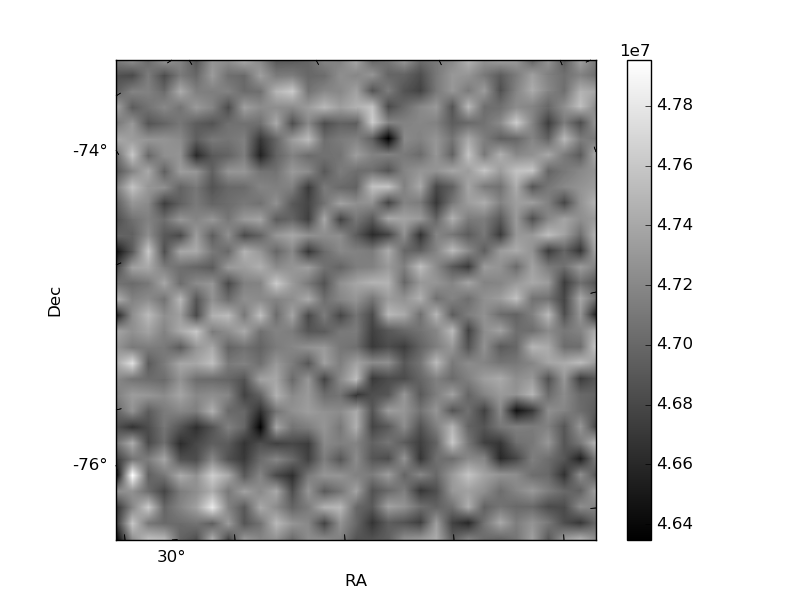
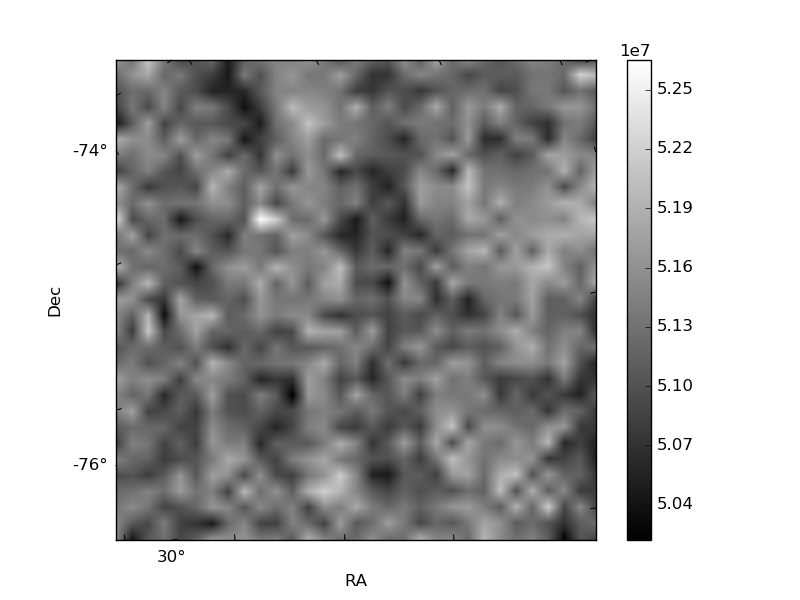
Histogram calculated using DETX and DETY for each event in the final _common_clean file
| Quadrant A | 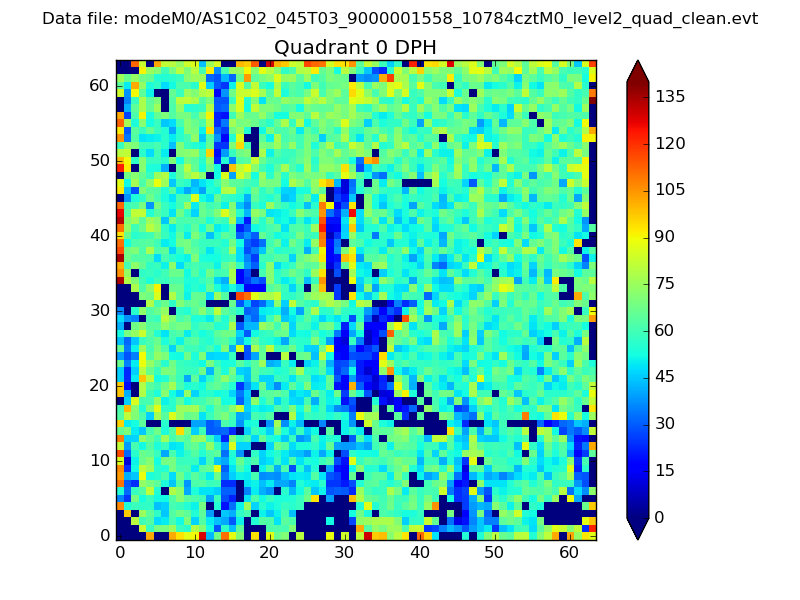 |
 |
Quadrant B |
|---|---|---|---|
| Quadrant D | 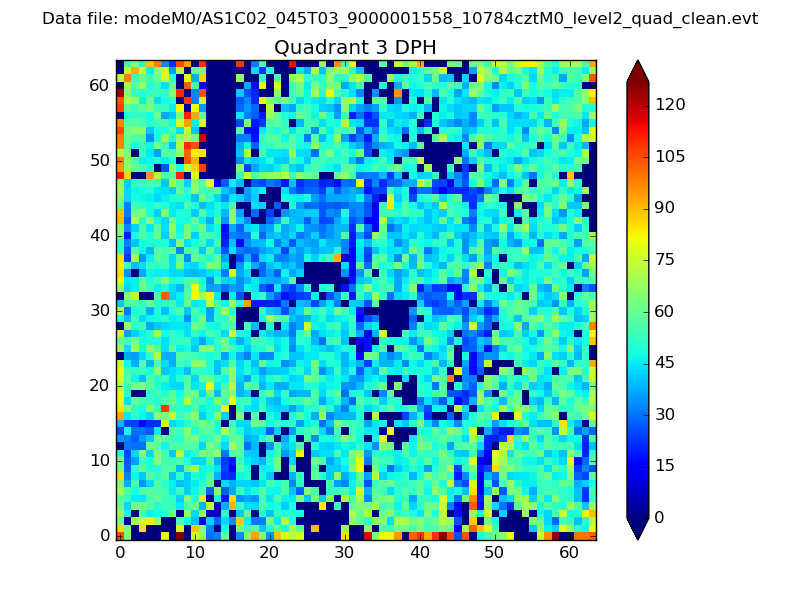 |
 |
Quadrant C |
| Plot type | Count rate plots | Images |
|---|---|---|
| Comparison with Poisson distribution Blue bars denote a histogram of data divided into 1 sec bins. Red curve is a Poisson curve with rate = median count rate of data. |
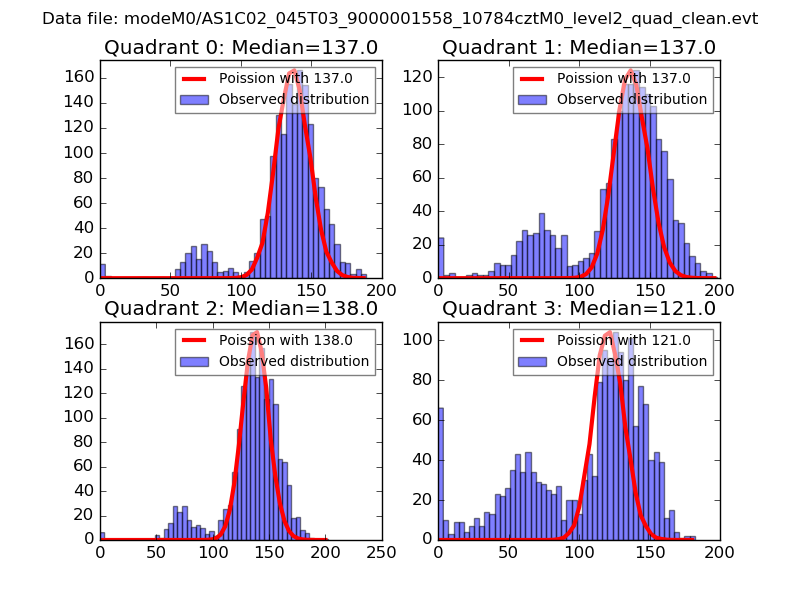 |
 |
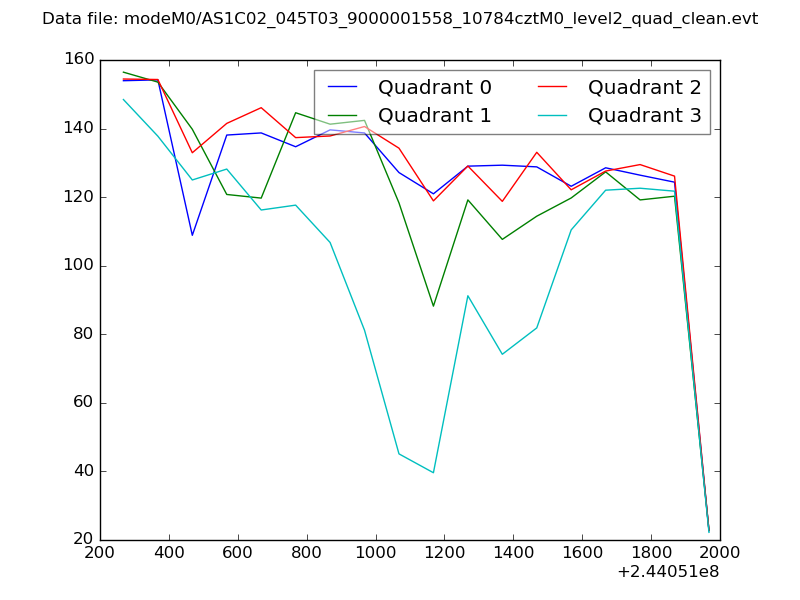
| Quadrant-wise count rates Data is divided into 100 sec bins |
 |
|
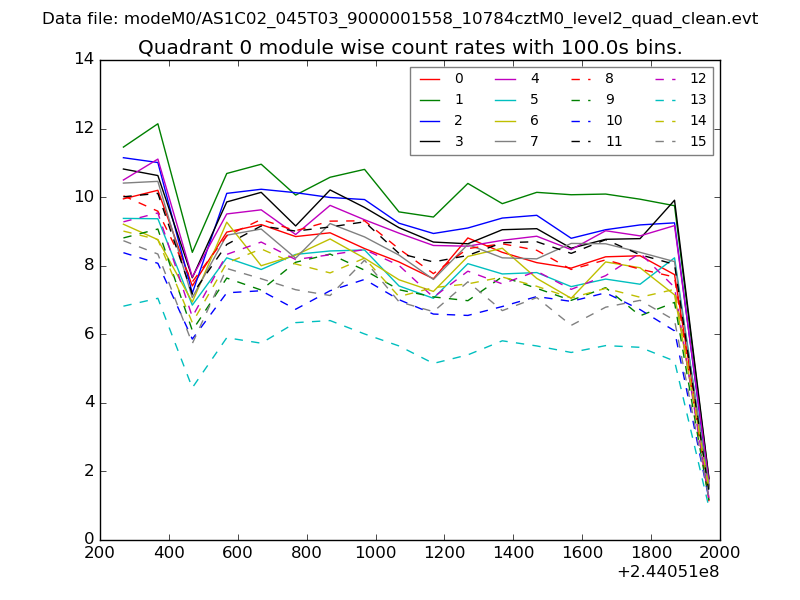
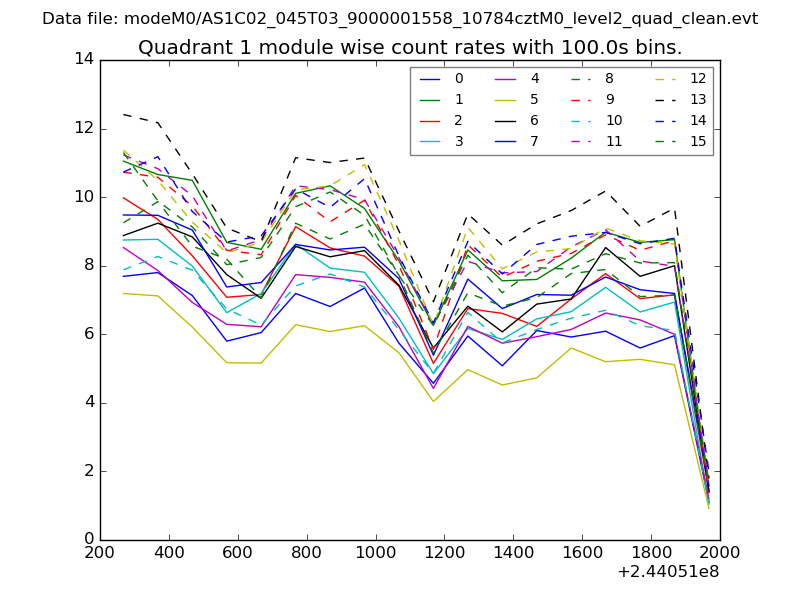
| Module-wise count rates for Quadrant A Data is divided into 100 sec bins |
 |
 |
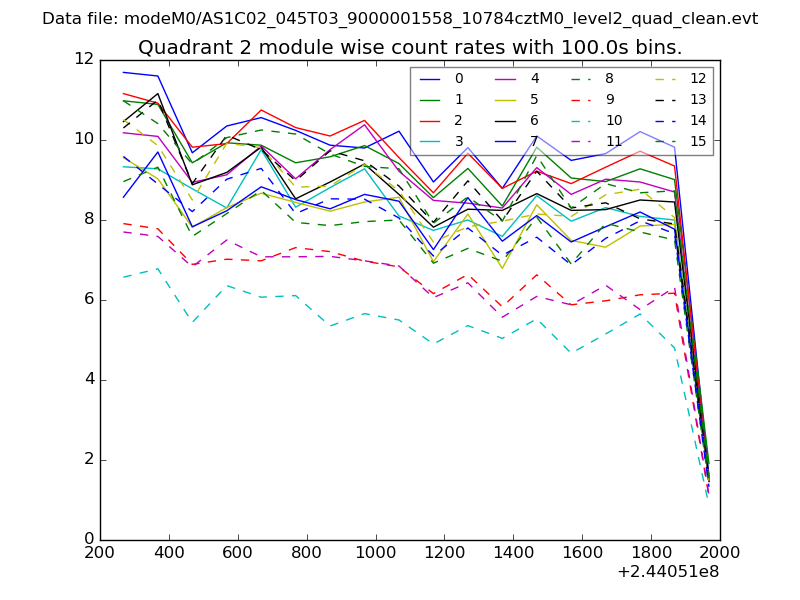
| Module-wise count rates for Quadrant B Data is divided into 100 sec bins |
 |
 |
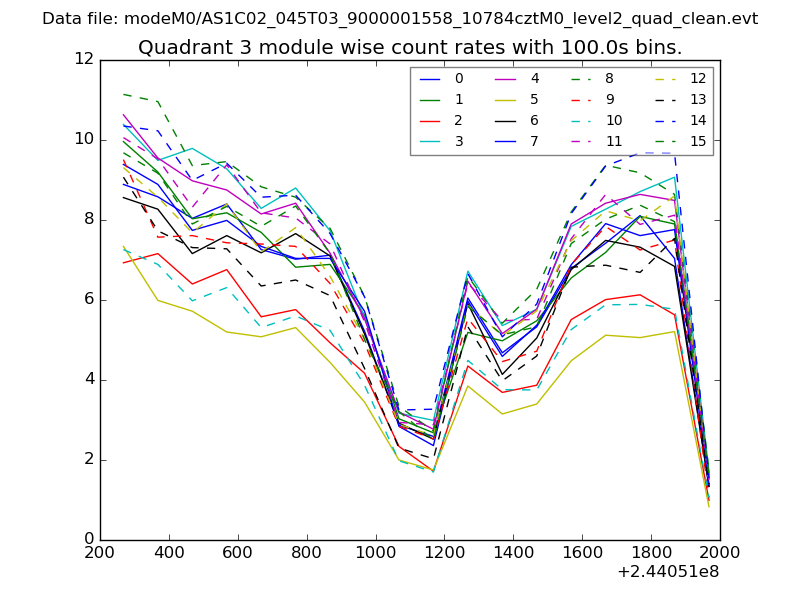
| Module-wise count rates for Quadrant C Data is divided into 100 sec bins |
 |
 |
| Module-wise count rates for Quadrant D Data is divided into 100 sec bins |
 |
 |
| Parameter | Plot |
|---|---|
| CZT HV Monitor | 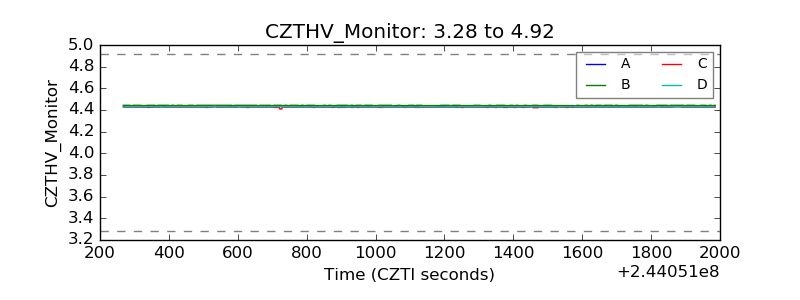 |
| D_VDD | 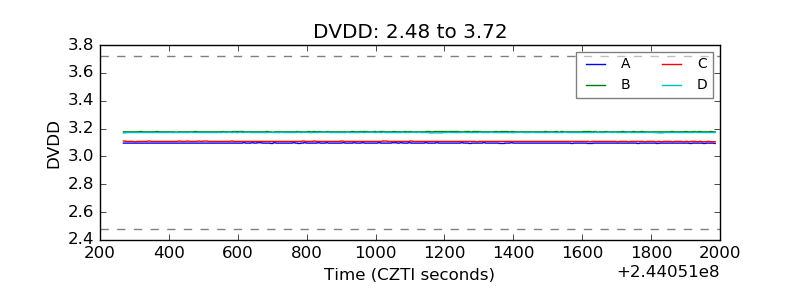 |
| Temperature 1 | 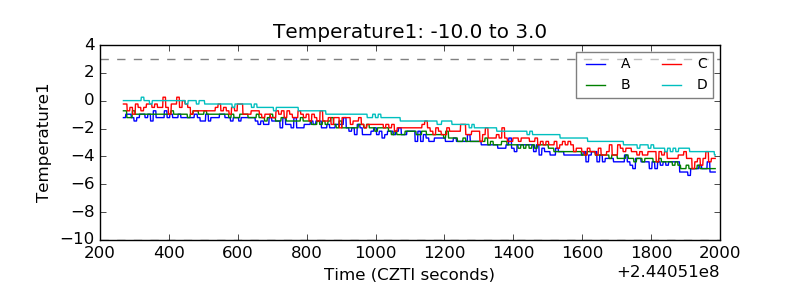 |
| Veto HV Monitor | 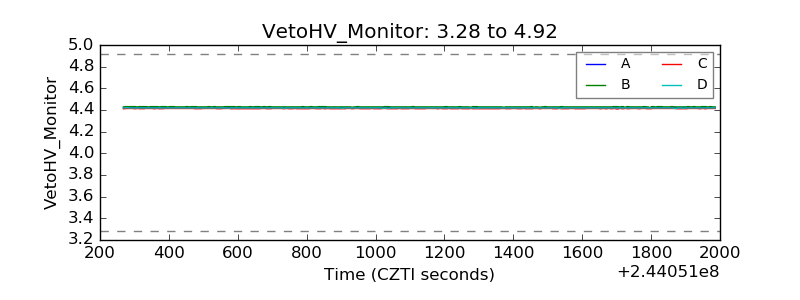 |
| Veto LLD | 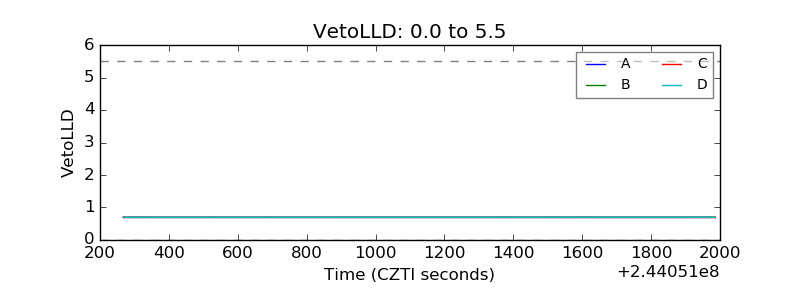 |
| Alpha Counter | 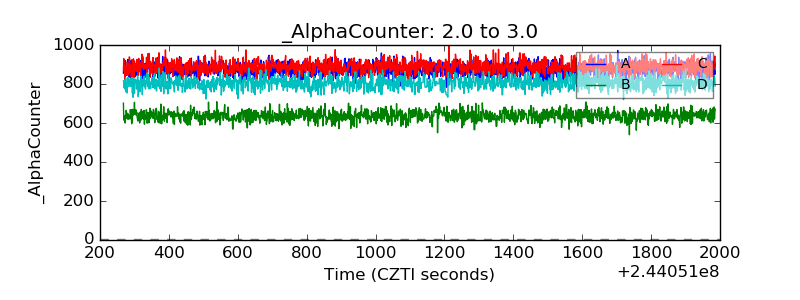 |
| _CPM_Rate | 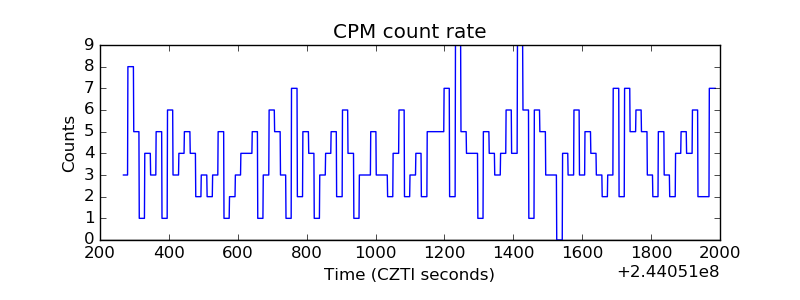 |
| CZT Counter | 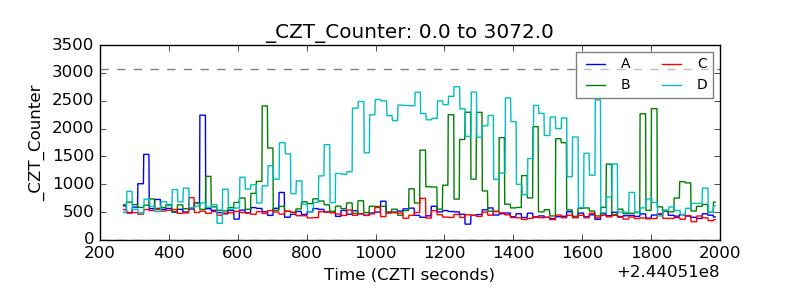 |
| +2.5 Volts monitor |  |
| +5 Volts monitor |  |
| _ROLL_ROT | 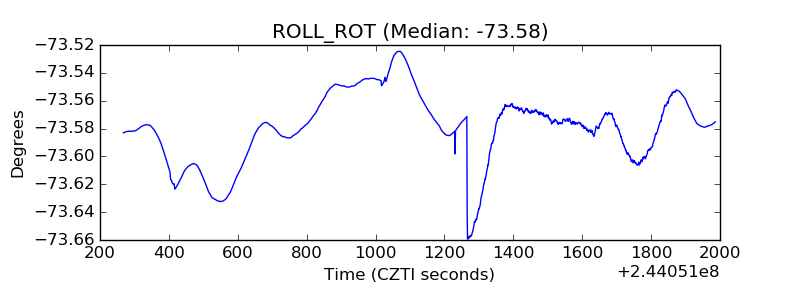 |
| _Roll_DEC | 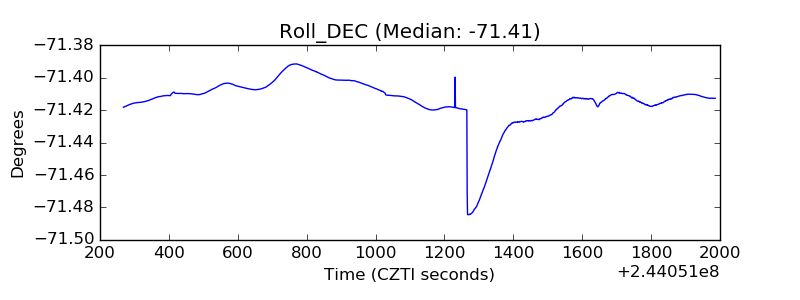 |
| _Roll_RA | 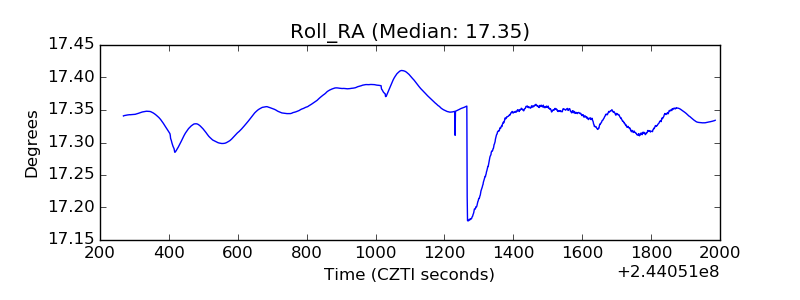 |
| Veto Counter | 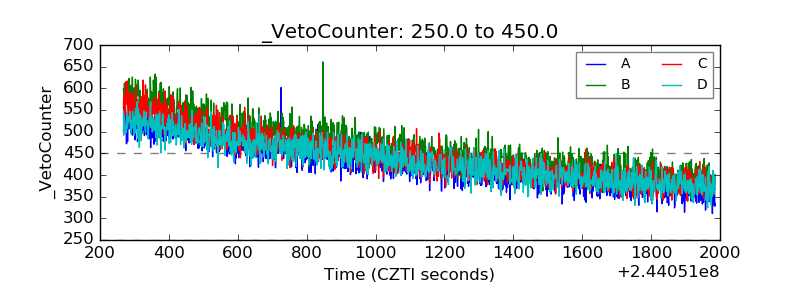 |