| Param | Original file | Final file |
|---|---|---|
| Filename | modeM0/AS1G07_062T01_9000001560cztM0_level2.fits | modeM0/AS1G07_062T01_9000001560cztM0_level2_quad_clean.evt |
| Size (bytes) | 460,653,120 | 681,877,440 |
| Size | 439.3 MB | 650.3 MB |
| Events in quadrant A | 2,749,920 | 4,483,292 |
| Events in quadrant B | 2,564,204 | 4,239,622 |
| Events in quadrant C | 2,749,222 | 4,439,331 |
| Events in quadrant D | 2,328,620 | 3,935,305 |
| Mode M0 | |||
|---|---|---|---|
| Quadrant | BADHDUFLAG | Total packets | Discarded packets |
| A | 0 | 111009 | 0 |
| B | 0 | 147420 | 0 |
| C | 0 | 105677 | 0 |
| D | 0 | 140748 | 0 |
| Mode SS | |||
|---|---|---|---|
| Quadrant | BADHDUFLAG | Total packets | Discarded packets |
| A | 0 | 1056 | 0 |
| B | 0 | 1058 | 0 |
| C | 0 | 1058 | 0 |
| D | 0 | 1058 | 0 |
| Mode M9 | |||
|---|---|---|---|
| Quadrant | BADHDUFLAG | Total packets | Discarded packets |
| A | 0 | 61 | 0 |
| B | 0 | 61 | 0 |
| C | 0 | 61 | 0 |
| D | 0 | 61 | 0 |
| Quadrant | Total seconds | Saturated seconds | Saturation percentage |
|---|---|---|---|
| A | 51810 | 843 | 1.627099% |
| B | 51808 | 4803 | 9.270769% |
| C | 51801 | 305 | 0.588792% |
| D | 51811 | 2432 | 4.693984% |
Noise dominated data is calculated using 1-second bins in cleaned event files. If a bin has >2000 counts, and if more than 50% of those come from <1% of pixels, then it is considered to be noise-dominated and hence unusable.
| Quadrant | # 1 sec bins | Bins with >0 counts | Bins with >2000 counts | High rate bins dominated by noise | Noise dominated (total time) | Noise dominated (detector-on time) | Marked lightcurve |
|---|---|---|---|---|---|---|---|
| A | 58018 | 51815 | 0 | 0 | 0.00% | 0.00% | 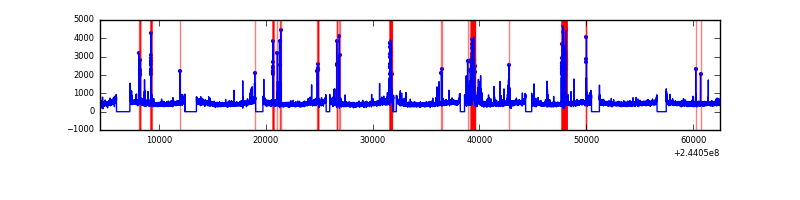 |
| B | 58018 | 51810 | 0 | 0 | 0.00% | 0.00% | 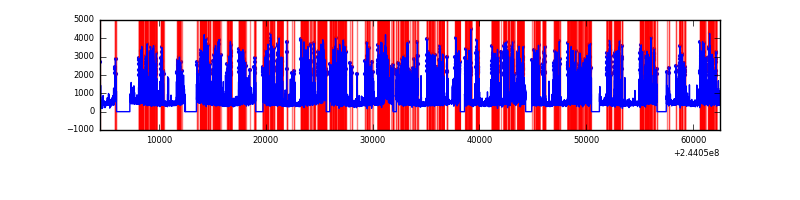 |
| C | 58018 | 51818 | 0 | 0 | 0.00% | 0.00% | 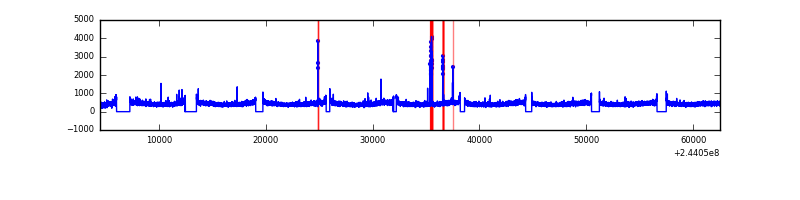 |
| D | 58018 | 51787 | 0 | 0 | 0.00% | 0.00% | 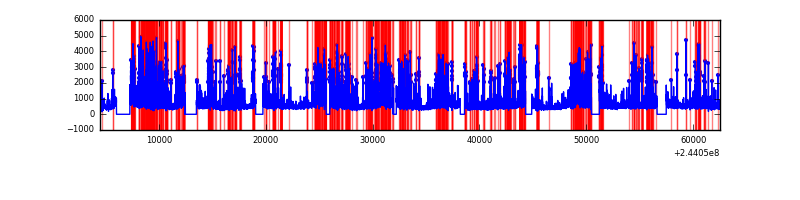 |
Top three noisy pixels from each quadrant. If the there are fewer than three noisy pixels in the level2.evt file, extra rows are filled as -1
| Pixel properties | Quadrant properties | ||||||
|---|---|---|---|---|---|---|---|
| Quadrant | DetID | PixID | Counts | Sigma | Mean | Median | Sigma |
| A | 0 | 29 | 2666 | 10.93 | 716 | 672 | 182.5 |
| A | 7 | 110 | 2262 | 8.71 | 716 | 672 | 182.5 |
| A | 0 | 30 | 2119 | 7.93 | 716 | 672 | 182.5 |
| B | 2 | 9 | 2240 | 11.81 | 677 | 646 | 135.0 |
| B | 14 | 254 | 1764 | 8.28 | 677 | 646 | 135.0 |
| B | 3 | 17 | 1721 | 7.96 | 677 | 646 | 135.0 |
| C | 12 | 241 | 1936 | 6.71 | 726 | 676 | 187.9 |
| C | 2 | 191 | 1890 | 6.46 | 726 | 676 | 187.9 |
| C | 3 | 126 | 1828 | 6.13 | 726 | 676 | 187.9 |
| D | 6 | 231 | 1769 | 6.49 | 663 | 602 | 179.7 |
| D | 3 | 14 | 1731 | 6.28 | 663 | 602 | 179.7 |
| D | 7 | 5 | 1673 | 5.96 | 663 | 602 | 179.7 |
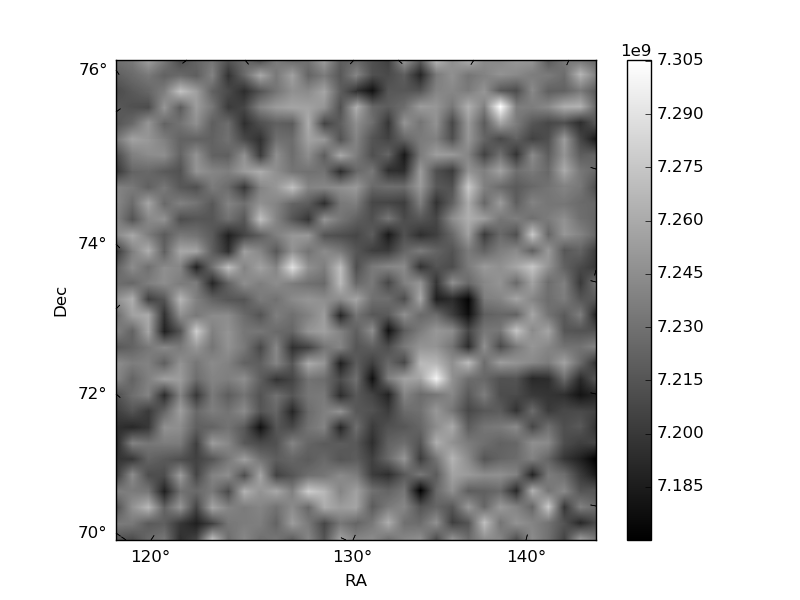
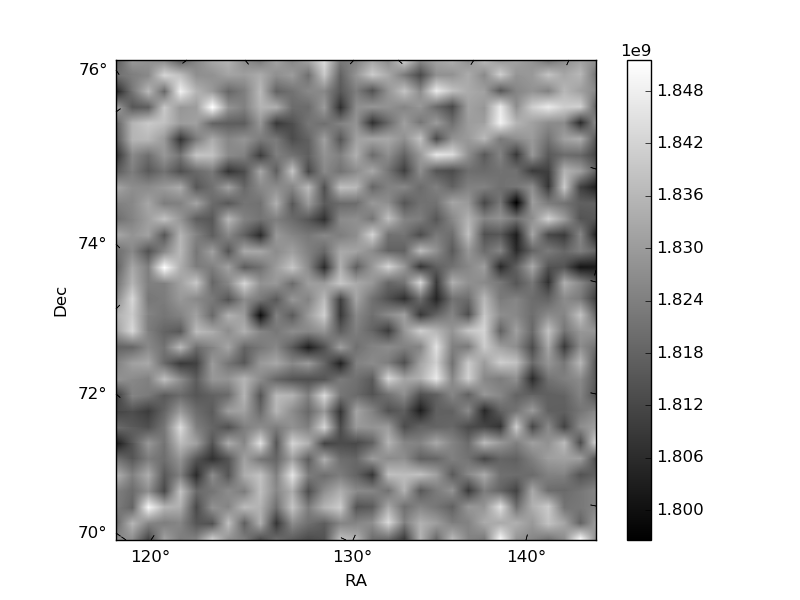
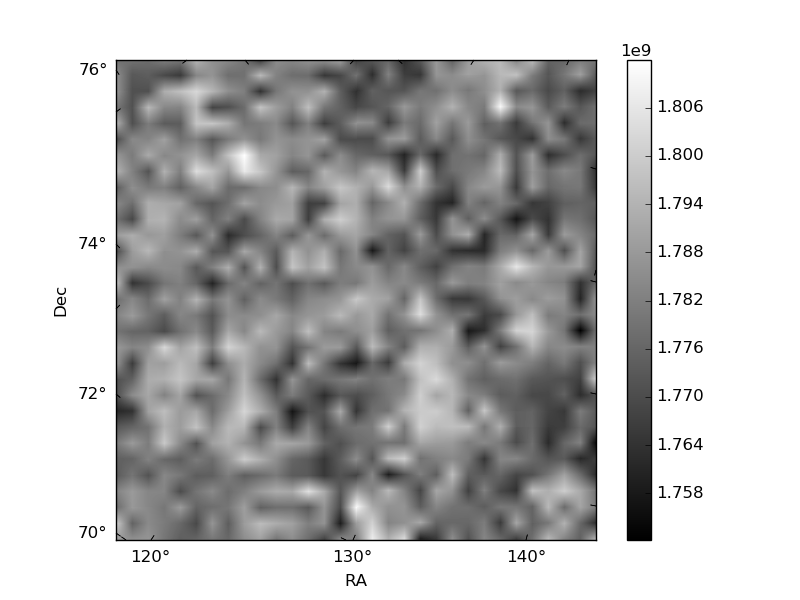
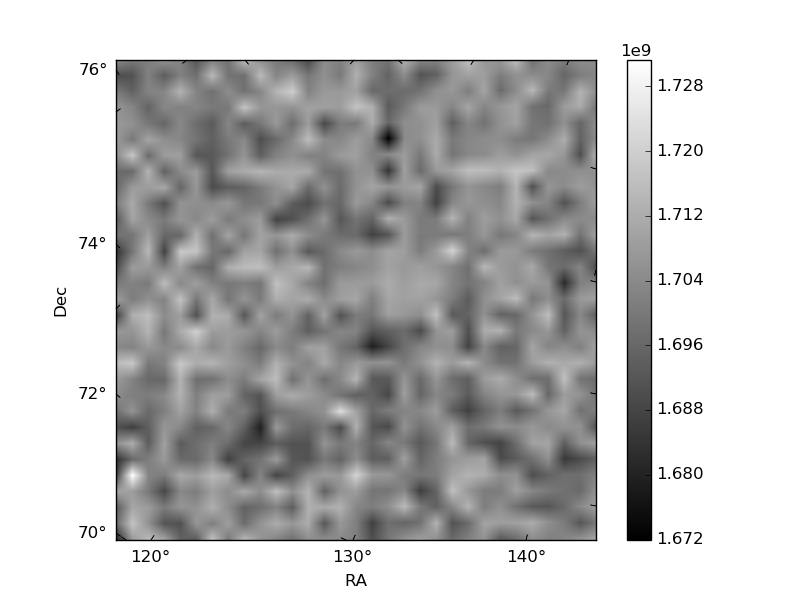
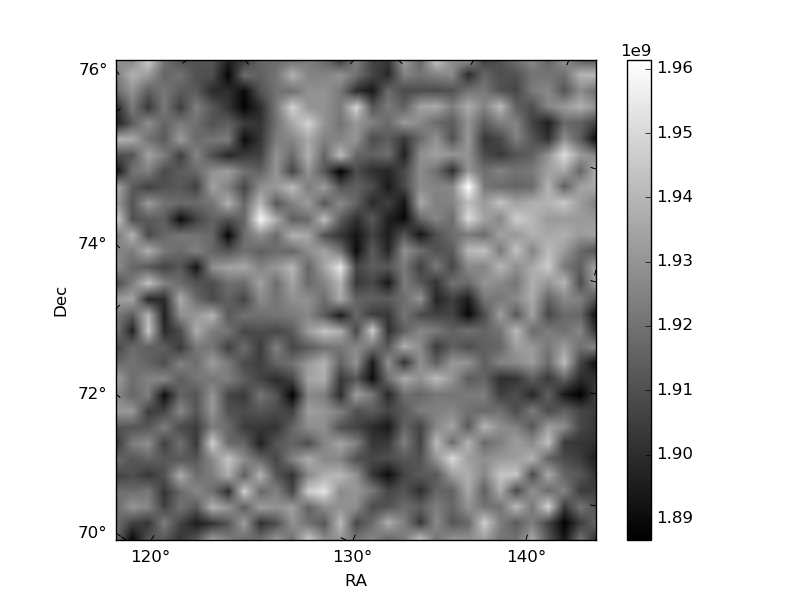
Histogram calculated using DETX and DETY for each event in the final _common_clean file
| Quadrant A | 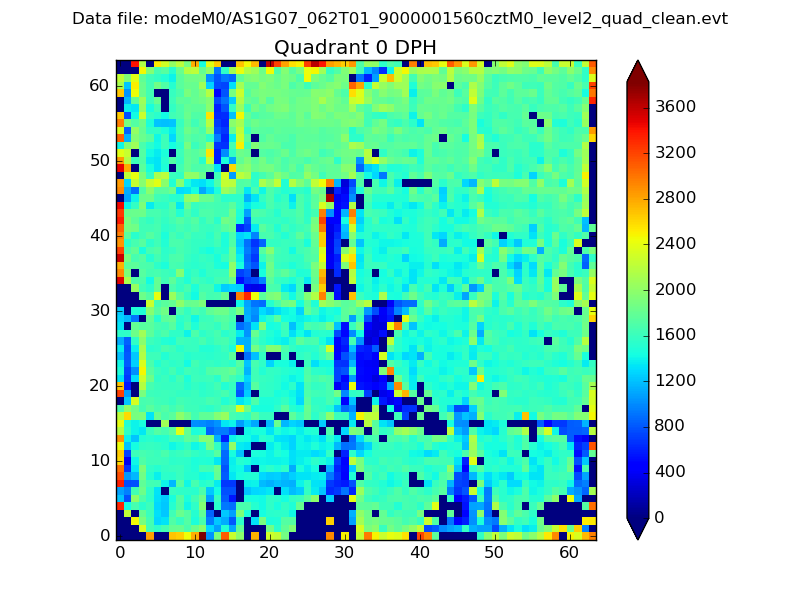 |
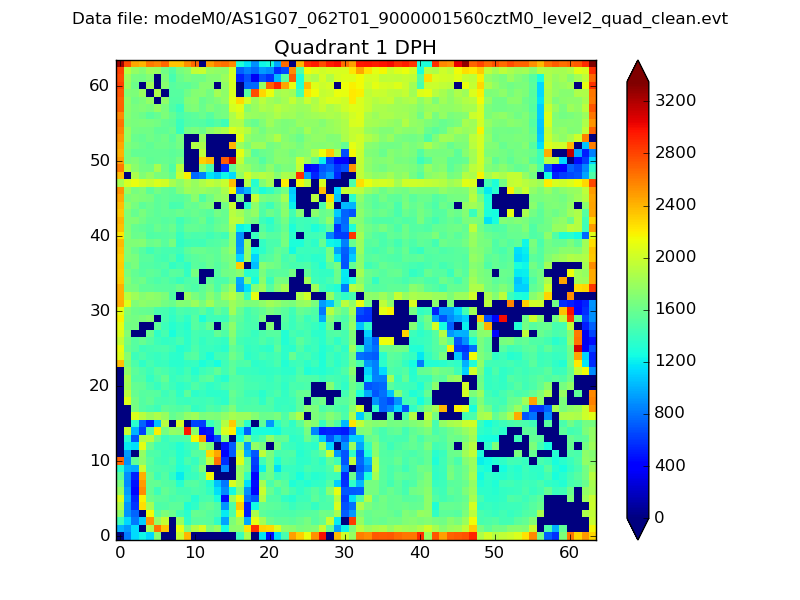 |
Quadrant B |
|---|---|---|---|
| Quadrant D | 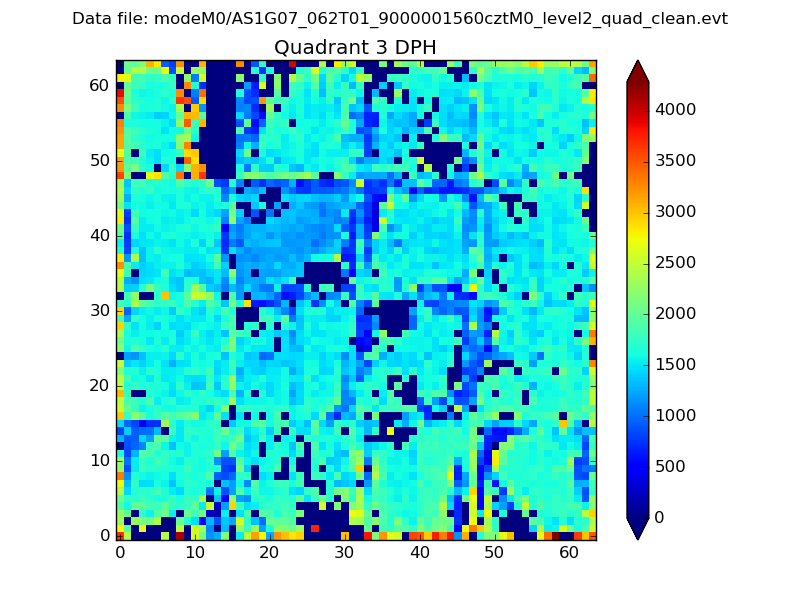 |
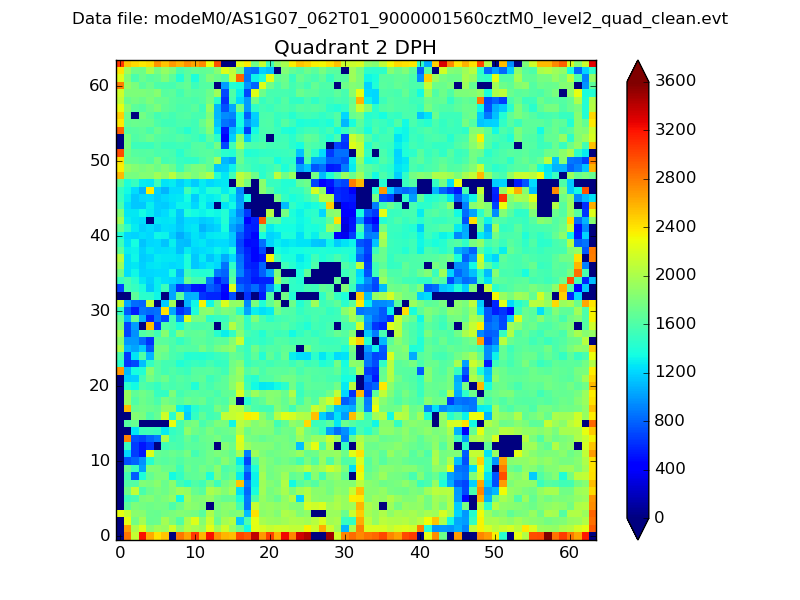 |
Quadrant C |
| Plot type | Count rate plots | Images |
|---|---|---|
| Comparison with Poisson distribution Blue bars denote a histogram of data divided into 1 sec bins. Red curve is a Poisson curve with rate = median count rate of data. |
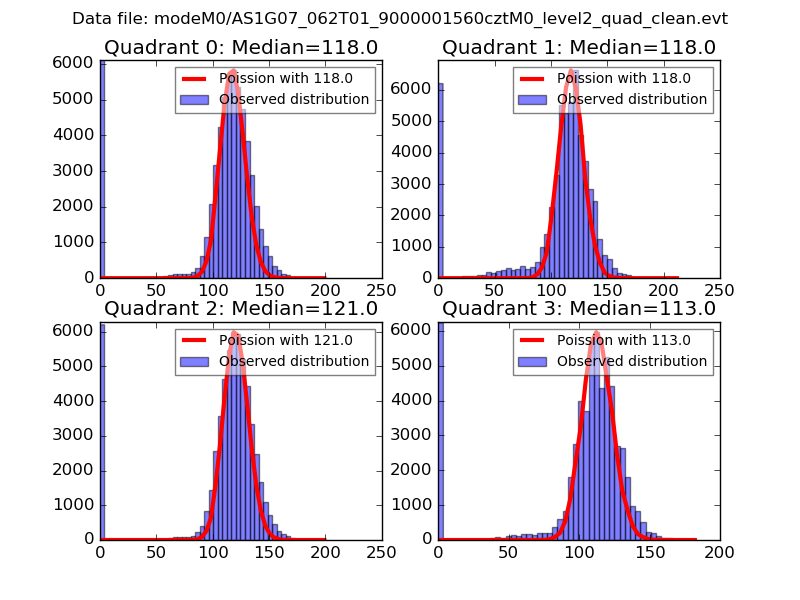 |
 |
| Quadrant-wise count rates Data is divided into 100 sec bins |
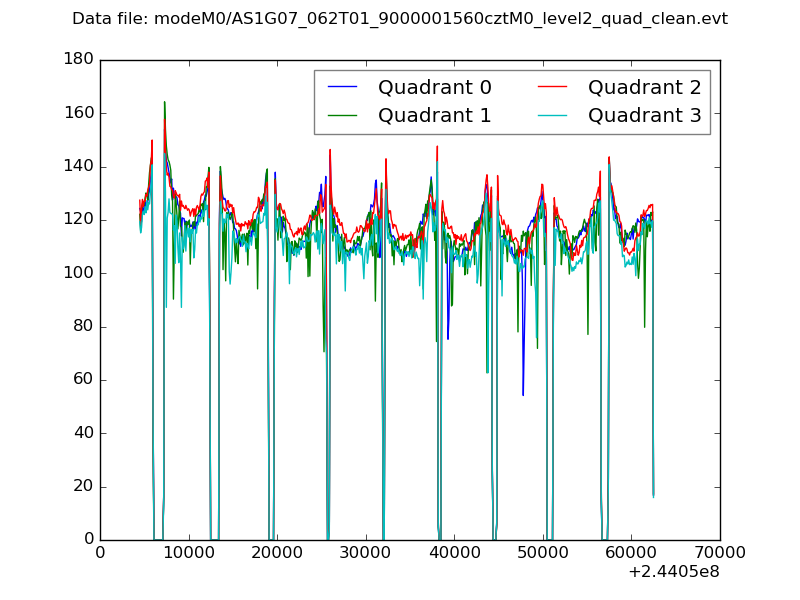 |
|
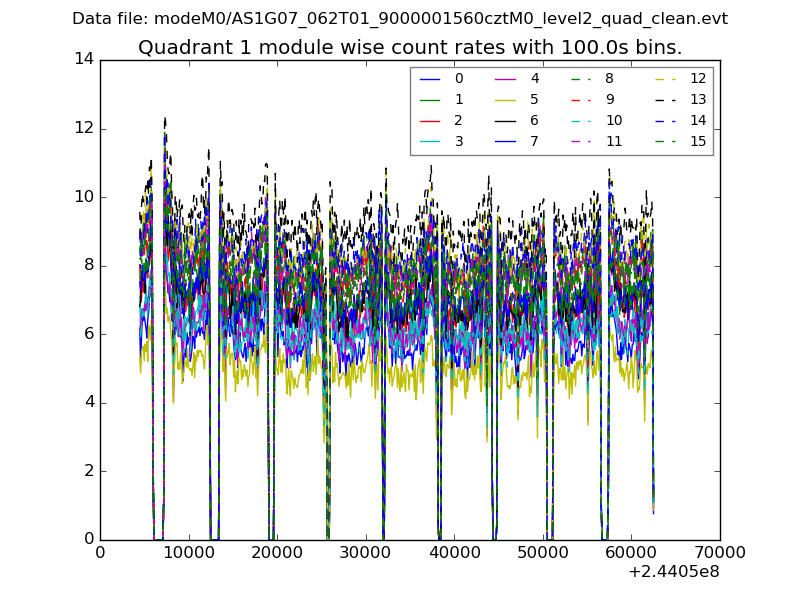
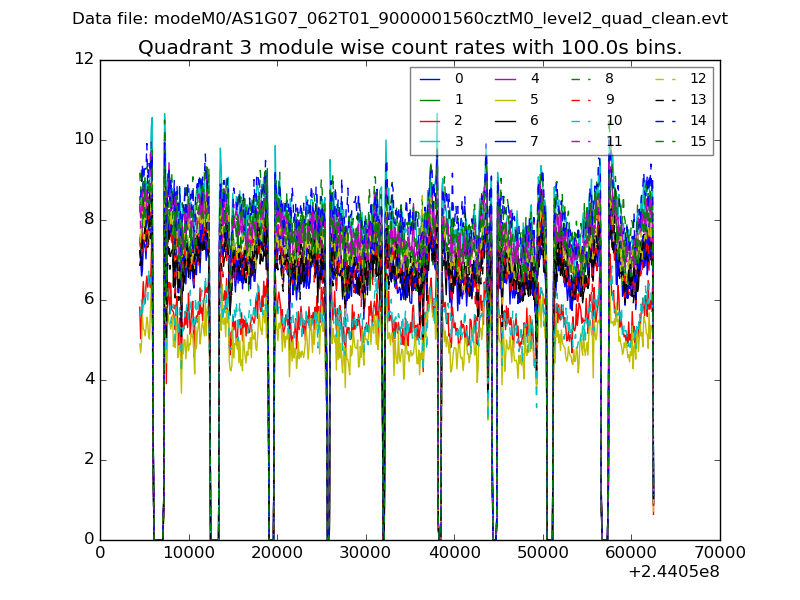
| Module-wise count rates for Quadrant A Data is divided into 100 sec bins |
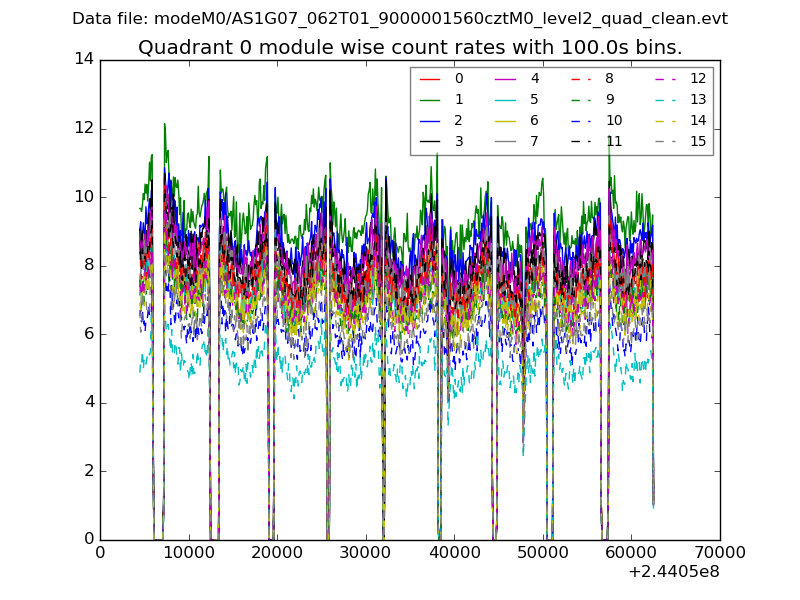 |
 |
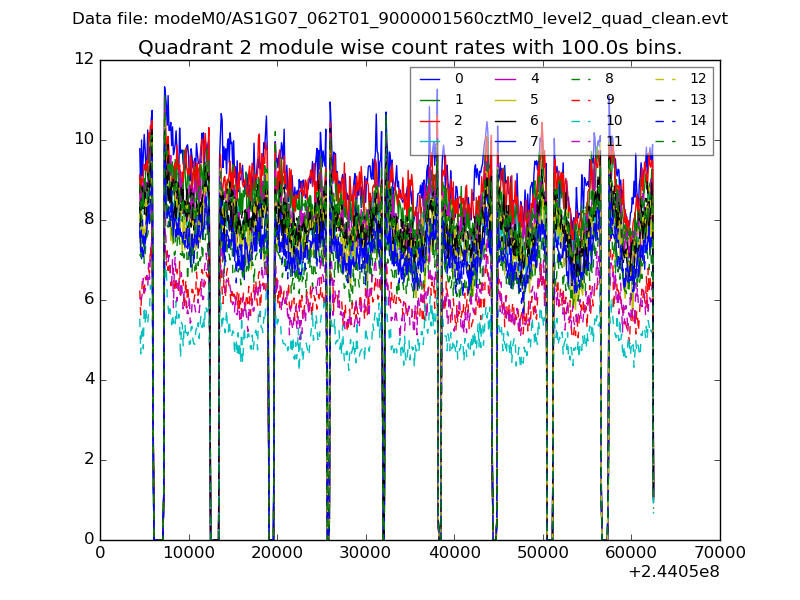
| Module-wise count rates for Quadrant B Data is divided into 100 sec bins |
 |
 |
| Module-wise count rates for Quadrant C Data is divided into 100 sec bins |
 |
 |
| Module-wise count rates for Quadrant D Data is divided into 100 sec bins |
 |
 |
| Parameter | Plot |
|---|---|
| CZT HV Monitor | 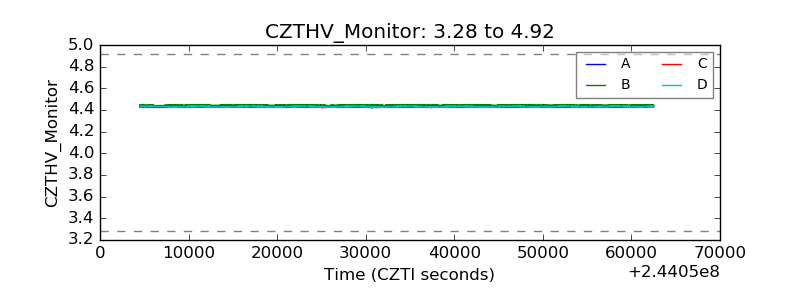 |
| D_VDD | 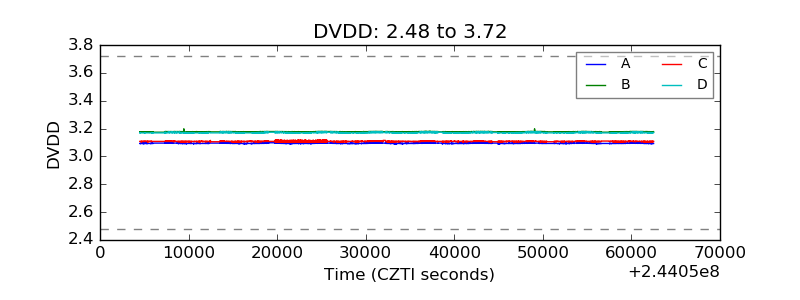 |
| Temperature 1 | 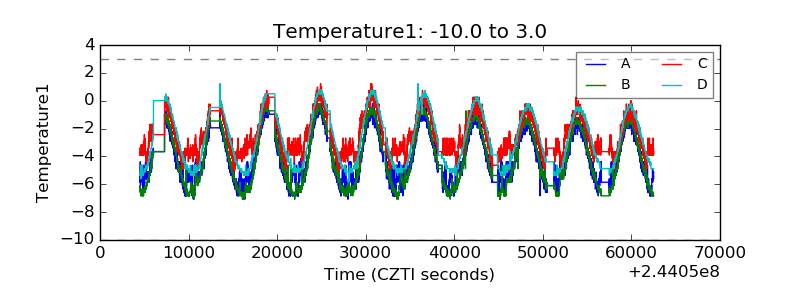 |
| Veto HV Monitor | 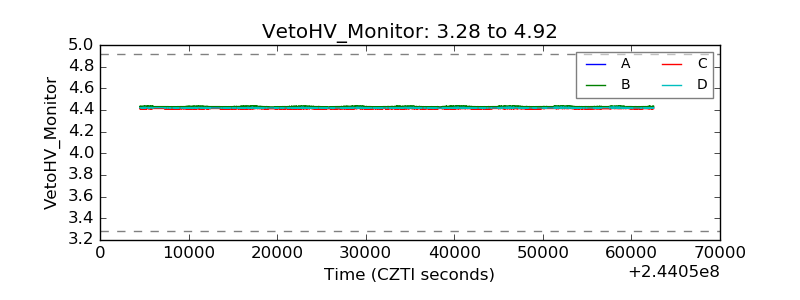 |
| Veto LLD | 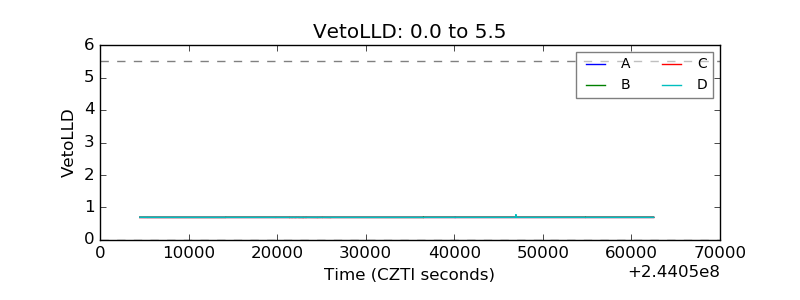 |
| Alpha Counter | 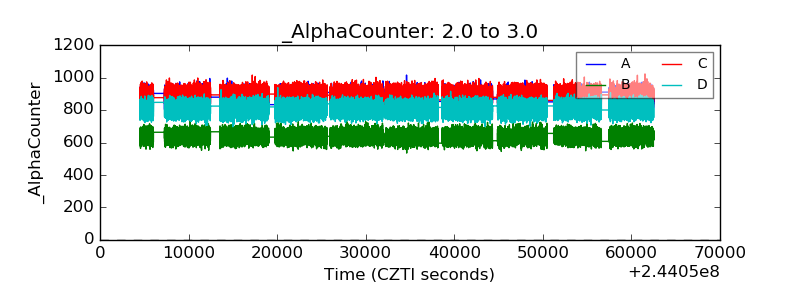 |
| _CPM_Rate | 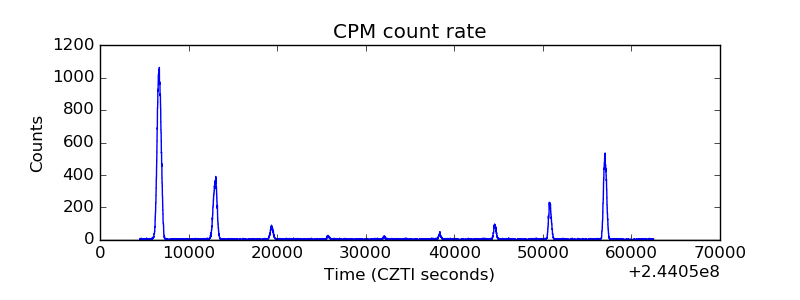 |
| CZT Counter | 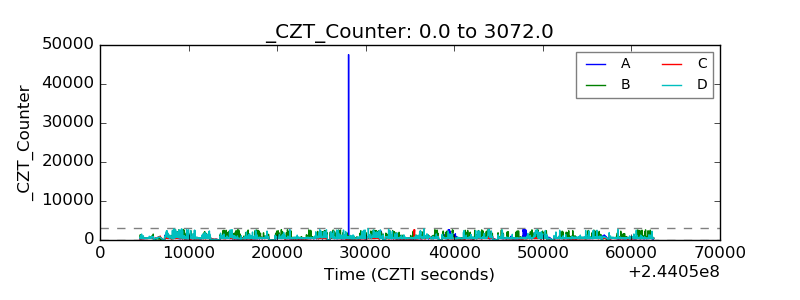 |
| +2.5 Volts monitor | 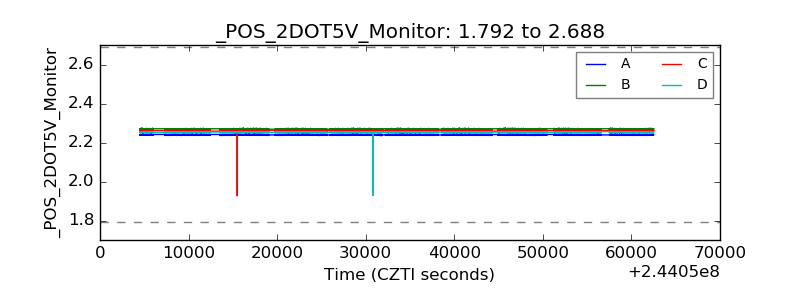 |
| +5 Volts monitor | 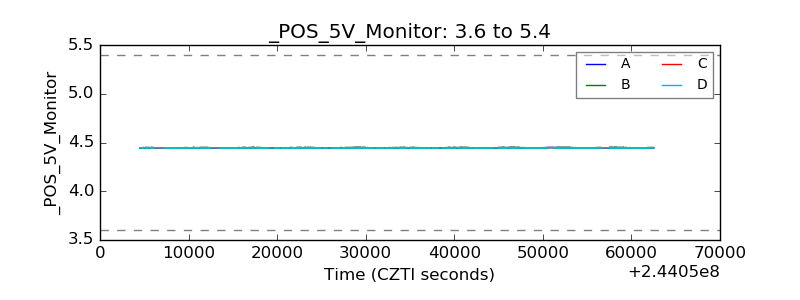 |
| _ROLL_ROT | 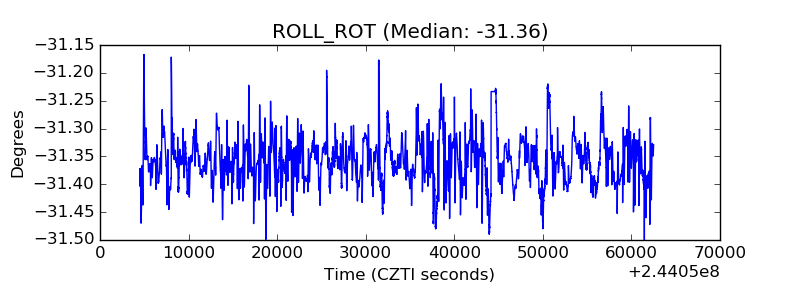 |
| _Roll_DEC | 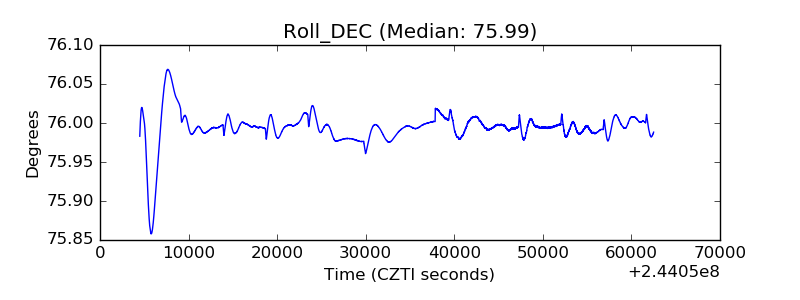 |
| _Roll_RA | 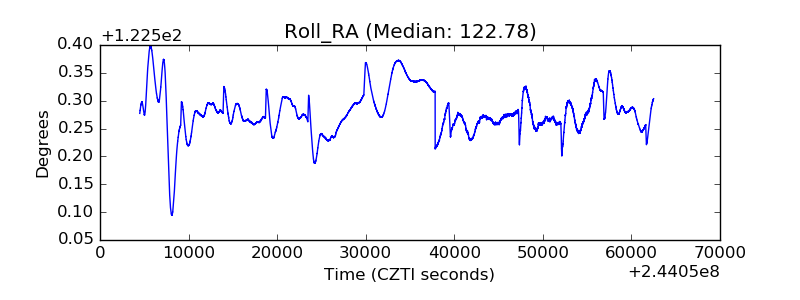 |
| Veto Counter | 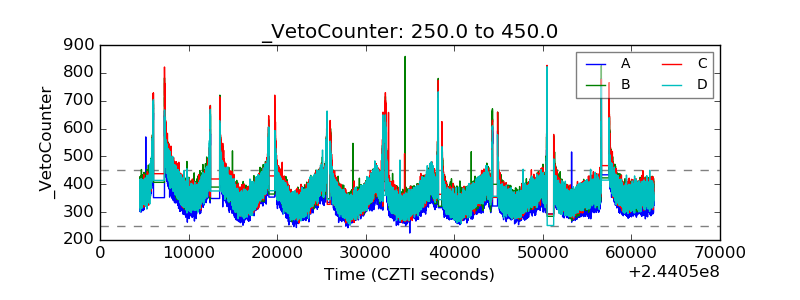 |