| Param | Original file | Final file |
|---|---|---|
| Filename | modeM0/AS1G07_062T01_9000001560_10784cztM0_level2.evt | modeM0/AS1G07_062T01_9000001560_10784cztM0_level2_quad_clean.evt |
| Size (bytes) | 233,328,960 | 54,766,080 |
| Size | 222.5 MB | 52.2 MB |
| Events in quadrant A | 1,454,676 | 370,438 |
| Events in quadrant B | 1,910,461 | 369,290 |
| Events in quadrant C | 1,330,378 | 374,043 |
| Events in quadrant D | 2,179,097 | 344,620 |
| Mode M0 | |||
|---|---|---|---|
| Quadrant | BADHDUFLAG | Total packets | Discarded packets |
| A | 0 | 6186 | 17 |
| B | 0 | 7531 | 21 |
| C | 0 | 5849 | 36 |
| D | 0 | 8449 | 15 |
| Mode SS | |||
|---|---|---|---|
| Quadrant | BADHDUFLAG | Total packets | Discarded packets |
| A | 0 | 60 | 2 |
| B | 0 | 60 | 0 |
| C | 0 | 60 | 0 |
| D | 0 | 60 | 0 |
| Mode M9 | |||
|---|---|---|---|
| Quadrant | BADHDUFLAG | Total packets | Discarded packets |
| A | 0 | 12 | 0 |
| B | 0 | 12 | 0 |
| C | 0 | 12 | 0 |
| D | 0 | 12 | 0 |
| Quadrant | Total seconds | Saturated seconds | Saturation percentage |
|---|---|---|---|
| A | 2794 | 89 | 3.185397% |
| B | 2791 | 269 | 9.638123% |
| C | 2784 | 71 | 2.550287% |
| D | 2794 | 268 | 9.591983% |
Noise dominated data is calculated using 1-second bins in cleaned event files. If a bin has >2000 counts, and if more than 50% of those come from <1% of pixels, then it is considered to be noise-dominated and hence unusable.
| Quadrant | # 1 sec bins | Bins with >0 counts | Bins with >2000 counts | High rate bins dominated by noise | Noise dominated (total time) | Noise dominated (detector-on time) | Marked lightcurve |
|---|---|---|---|---|---|---|---|
| A | 4051 | 2802 | 6 | 6 | 0.15% | 0.21% | 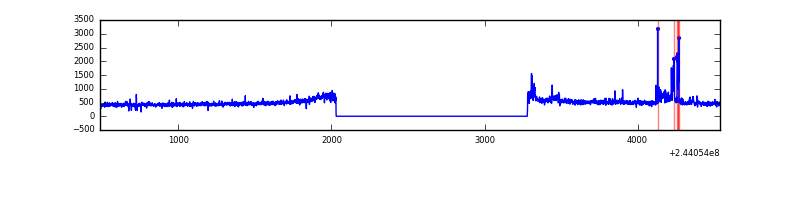 |
| B | 4051 | 2802 | 105 | 105 | 2.59% | 3.75% | 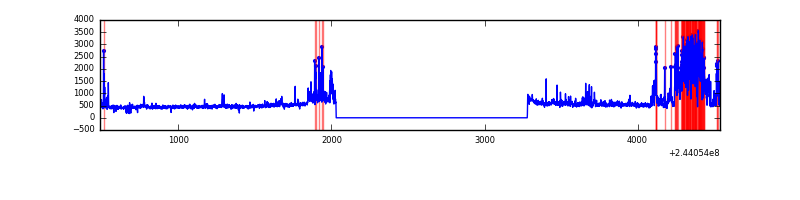 |
| C | 4051 | 2802 | 0 | 0 | 0.00% | 0.00% | 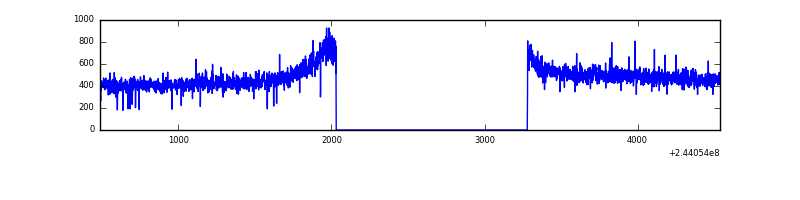 |
| D | 4050 | 2801 | 123 | 123 | 3.04% | 4.39% | 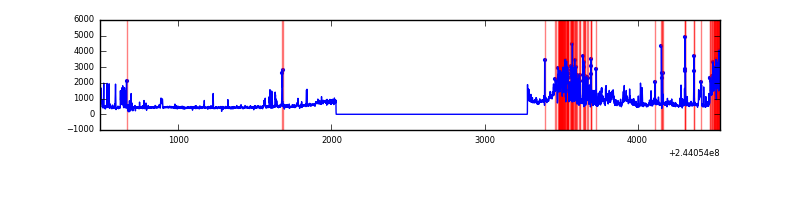 |
Top three noisy pixels from each quadrant. If the there are fewer than three noisy pixels in the level2.evt file, extra rows are filled as -1
| Pixel properties | Quadrant properties | ||||||
|---|---|---|---|---|---|---|---|
| Quadrant | DetID | PixID | Counts | Sigma | Mean | Median | Sigma |
| A | 15 | 174 | 88066 | 1219.29 | 350 | 342 | 71.9 |
| A | 1 | 162 | 8518 | 113.64 | 350 | 342 | 71.9 |
| A | 0 | 226 | 3279 | 40.82 | 350 | 342 | 71.9 |
| B | 4 | 239 | 539359 | 8247.74 | 342 | 334 | 65.4 |
| B | 15 | 204 | 16056 | 240.57 | 342 | 334 | 65.4 |
| B | 0 | 219 | 8556 | 125.81 | 342 | 334 | 65.4 |
| C | 8 | 222 | 4076 | 47.78 | 339 | 340 | 78.2 |
| C | 13 | 61 | 2774 | 31.13 | 339 | 340 | 78.2 |
| C | 0 | 207 | 1747 | 18.0 | 339 | 340 | 78.2 |
| D | 10 | 199 | 322166 | 4072.81 | 330 | 320 | 79.0 |
| D | 13 | 104 | 190747 | 2409.76 | 330 | 320 | 79.0 |
| D | 8 | 195 | 166637 | 2104.66 | 330 | 320 | 79.0 |
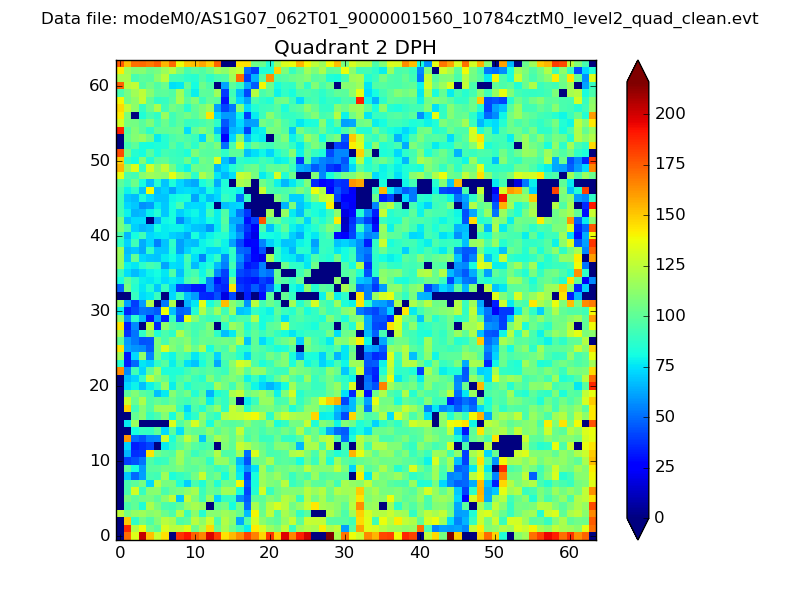
Histogram calculated using DETX and DETY for each event in the final _common_clean file
| Quadrant A | 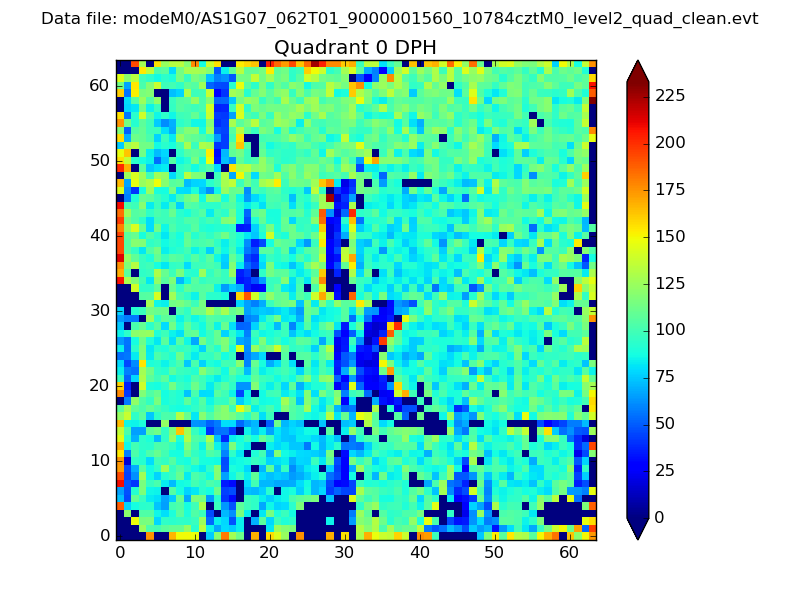 |
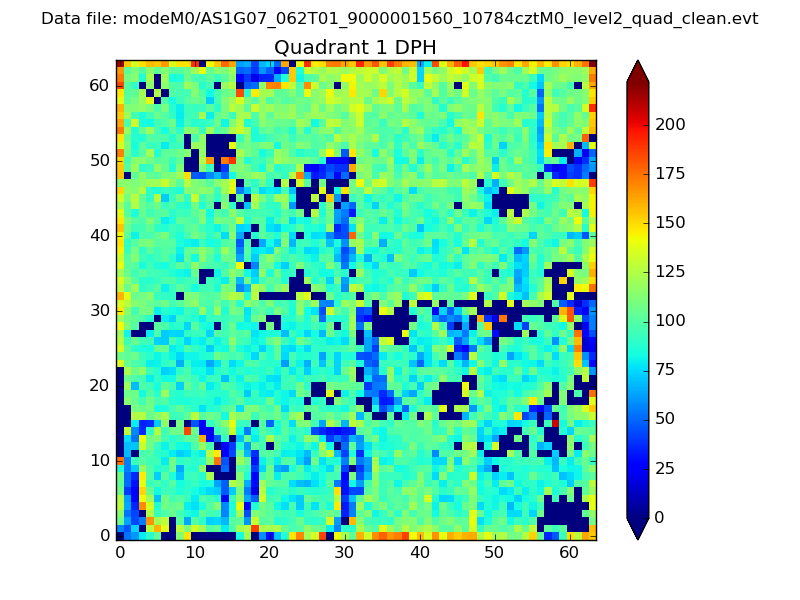 |
Quadrant B |
|---|---|---|---|
| Quadrant D | 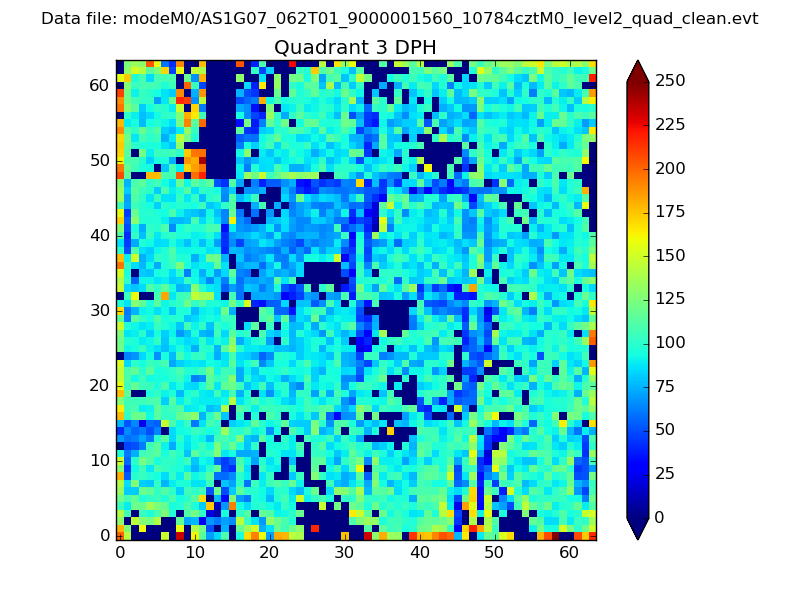 |
 |
Quadrant C |
| Plot type | Count rate plots | Images |
|---|---|---|
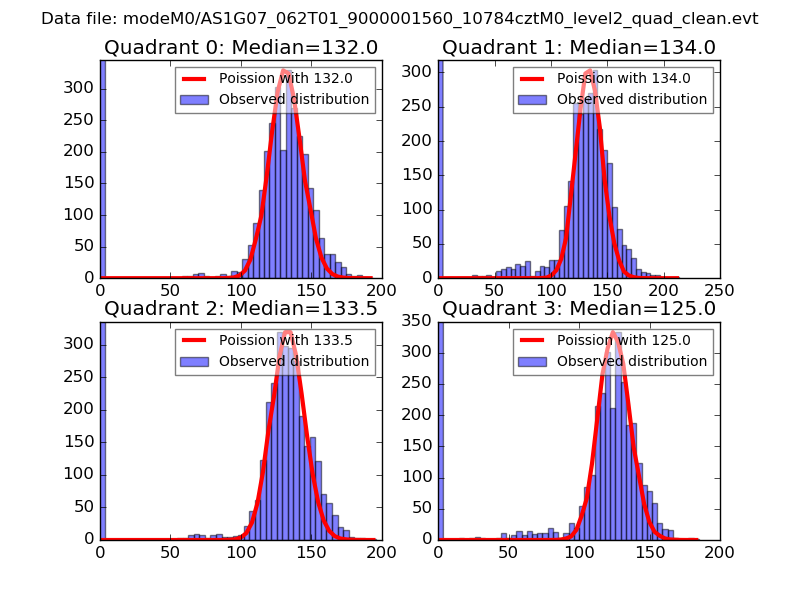
| Comparison with Poisson distribution Blue bars denote a histogram of data divided into 1 sec bins. Red curve is a Poisson curve with rate = median count rate of data. |
 |
 |
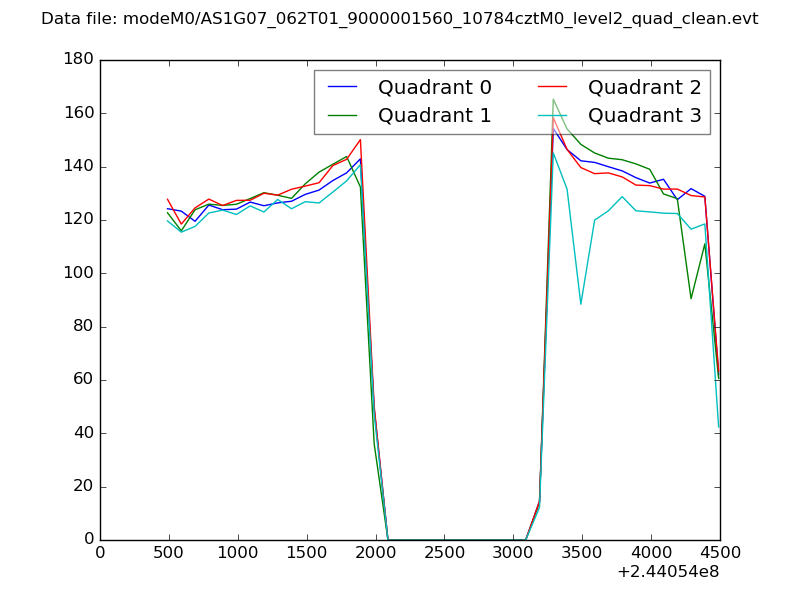
| Quadrant-wise count rates Data is divided into 100 sec bins |
 |
|
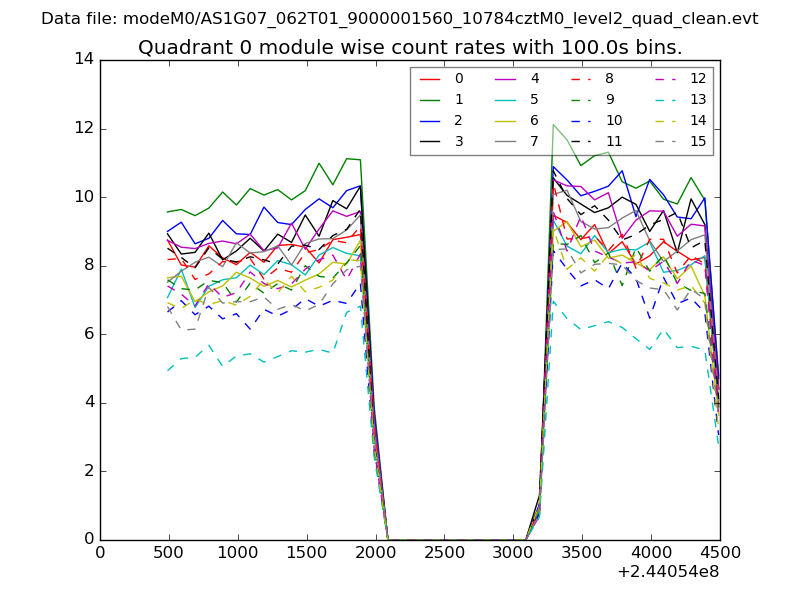
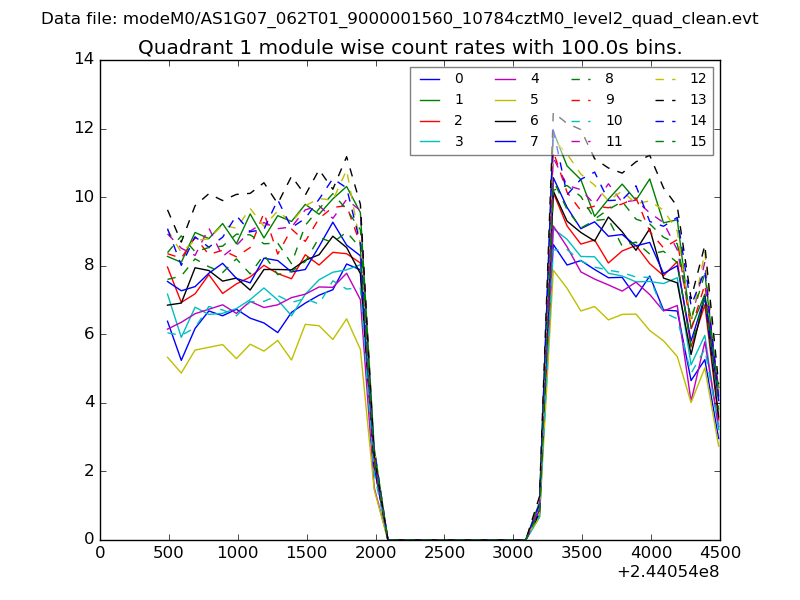
| Module-wise count rates for Quadrant A Data is divided into 100 sec bins |
 |
 |
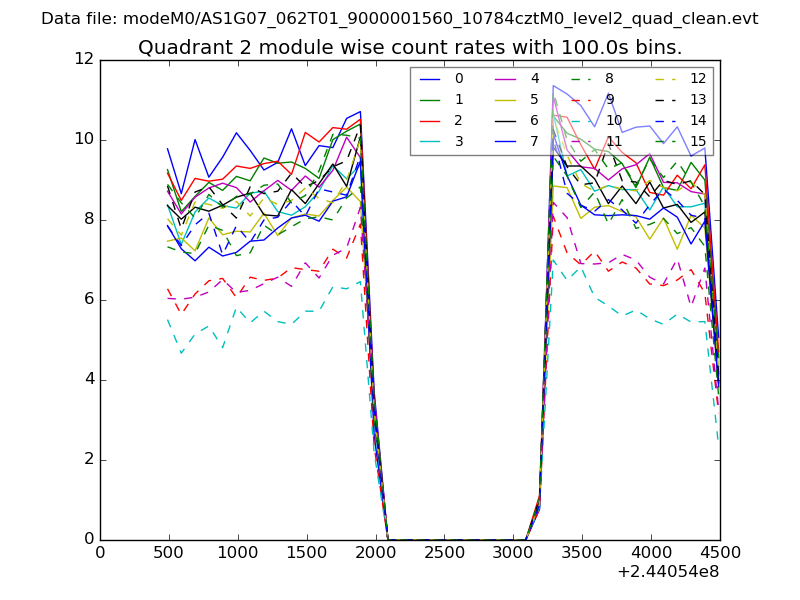
| Module-wise count rates for Quadrant B Data is divided into 100 sec bins |
 |
 |
| Module-wise count rates for Quadrant C Data is divided into 100 sec bins |
 |
 |
| Module-wise count rates for Quadrant D Data is divided into 100 sec bins |
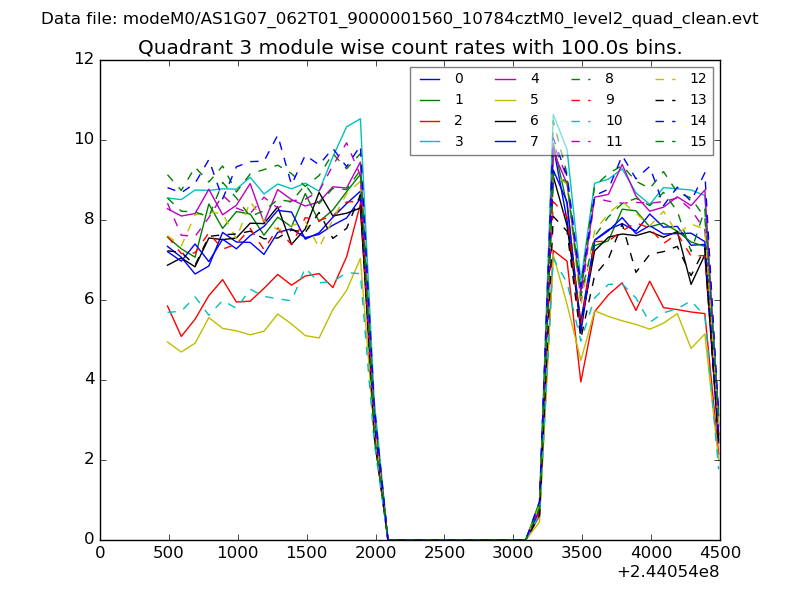 |
 |
| Parameter | Plot |
|---|---|
| CZT HV Monitor | 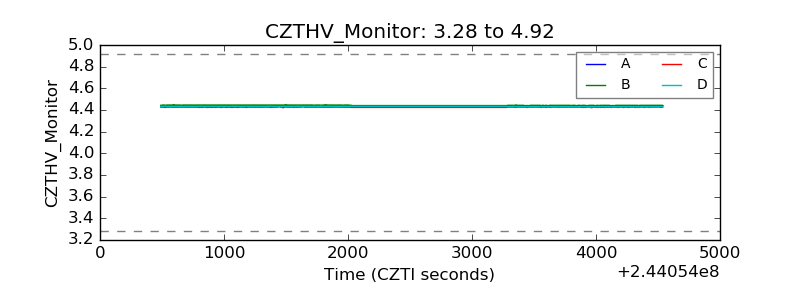 |
| D_VDD | 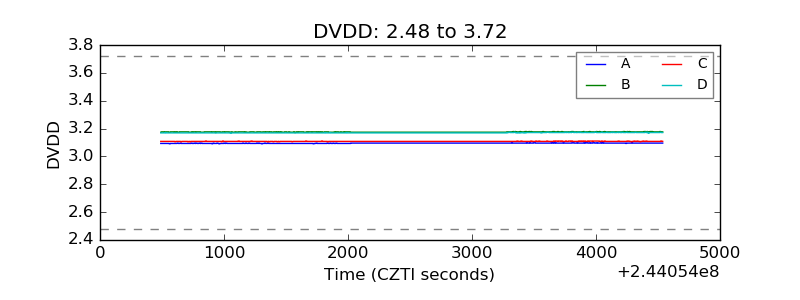 |
| Temperature 1 | 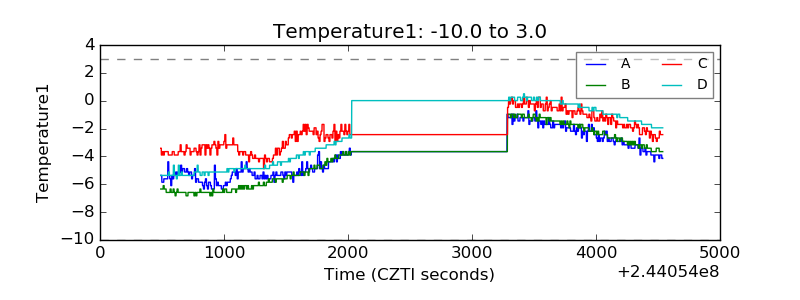 |
| Veto HV Monitor | 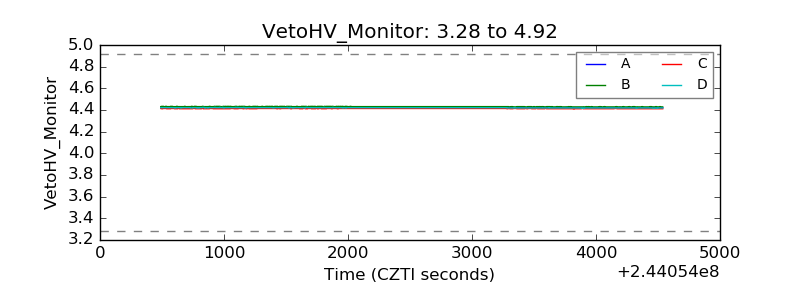 |
| Veto LLD | 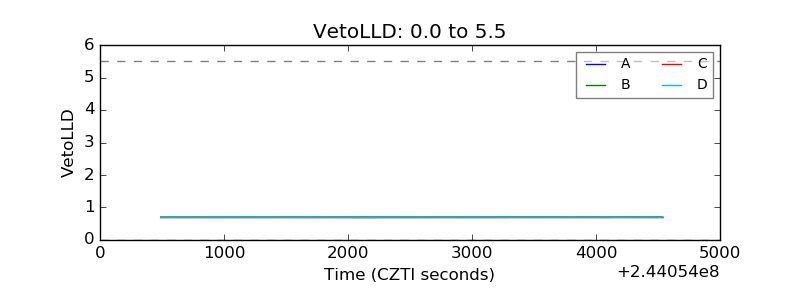 |
| Alpha Counter | 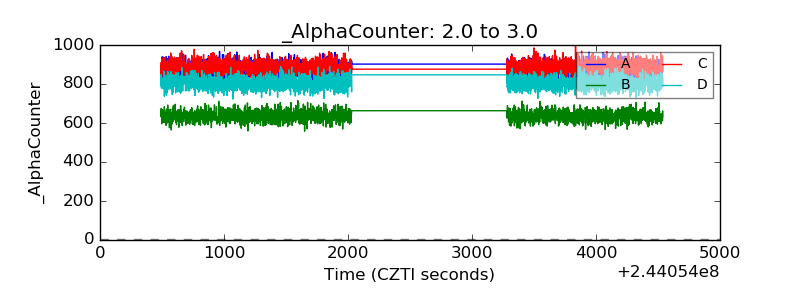 |
| _CPM_Rate | 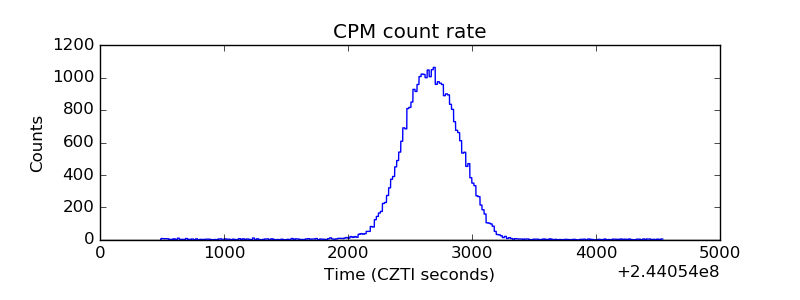 |
| CZT Counter |  |
| +2.5 Volts monitor |  |
| +5 Volts monitor |  |
| _ROLL_ROT | 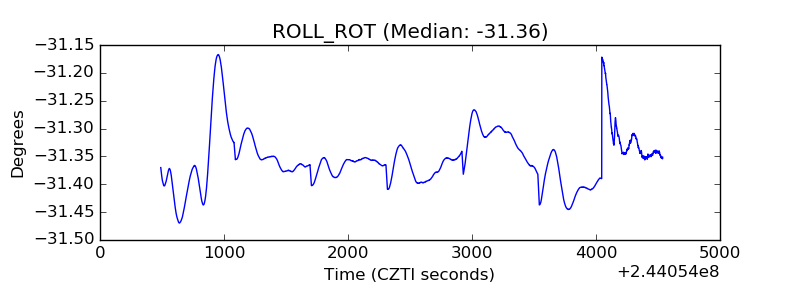 |
| _Roll_DEC | 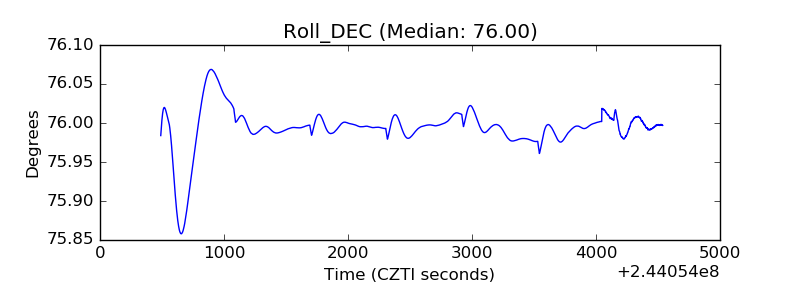 |
| _Roll_RA |  |
| Veto Counter | 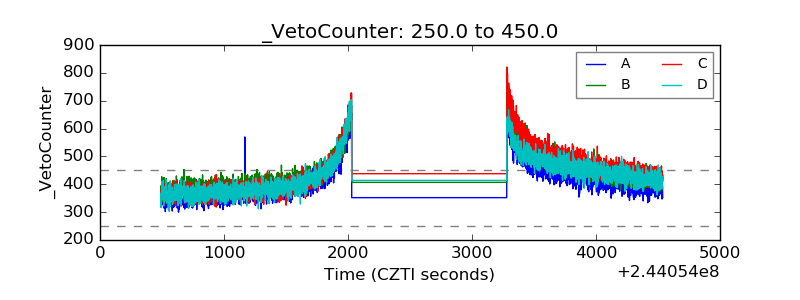 |