| Param | Original file | Final file |
|---|---|---|
| Filename | modeM0/AS1G07_062T01_9000001560_10786cztM0_level2.evt | modeM0/AS1G07_062T01_9000001560_10786cztM0_level2_quad_clean.evt |
| Size (bytes) | 560,278,080 | 128,321,280 |
| Size | 534.3 MB | 122.4 MB |
| Events in quadrant A | 3,210,565 | 858,950 |
| Events in quadrant B | 5,485,753 | 839,949 |
| Events in quadrant C | 3,109,421 | 876,916 |
| Events in quadrant D | 4,684,232 | 819,522 |
| Mode M0 | |||
|---|---|---|---|
| Quadrant | BADHDUFLAG | Total packets | Discarded packets |
| A | 0 | 14641 | 3 |
| B | 0 | 21194 | 2 |
| C | 0 | 14382 | 2 |
| D | 0 | 18717 | 2 |
| Mode SS | |||
|---|---|---|---|
| Quadrant | BADHDUFLAG | Total packets | Discarded packets |
| A | 0 | 142 | 0 |
| B | 0 | 142 | 0 |
| C | 0 | 142 | 0 |
| D | 0 | 142 | 0 |
| Mode M9 | |||
|---|---|---|---|
| Quadrant | BADHDUFLAG | Total packets | Discarded packets |
| A | 0 | 9 | 0 |
| B | 0 | 9 | 0 |
| C | 0 | 9 | 0 |
| D | 0 | 10 | 0 |
| Quadrant | Total seconds | Saturated seconds | Saturation percentage |
|---|---|---|---|
| A | 7052 | 39 | 0.553035% |
| B | 7052 | 699 | 9.912082% |
| C | 7052 | 42 | 0.595576% |
| D | 7052 | 287 | 4.069767% |
Noise dominated data is calculated using 1-second bins in cleaned event files. If a bin has >2000 counts, and if more than 50% of those come from <1% of pixels, then it is considered to be noise-dominated and hence unusable.
| Quadrant | # 1 sec bins | Bins with >0 counts | Bins with >2000 counts | High rate bins dominated by noise | Noise dominated (total time) | Noise dominated (detector-on time) | Marked lightcurve |
|---|---|---|---|---|---|---|---|
| A | 7732 | 7053 | 12 | 12 | 0.16% | 0.17% | 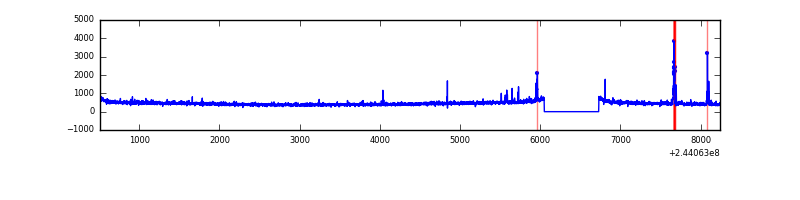 |
| B | 7732 | 7053 | 390 | 390 | 5.04% | 5.53% | 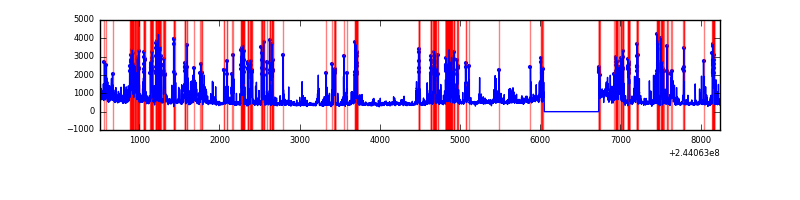 |
| C | 7732 | 7053 | 0 | 0 | 0.00% | 0.00% | 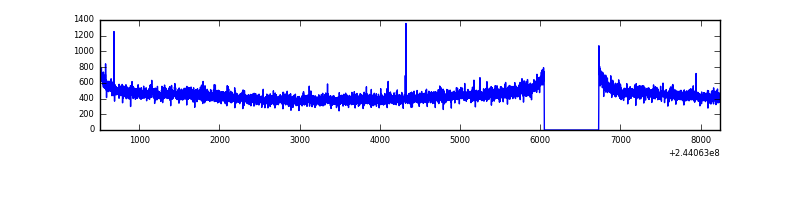 |
| D | 7732 | 7053 | 193 | 193 | 2.50% | 2.74% | 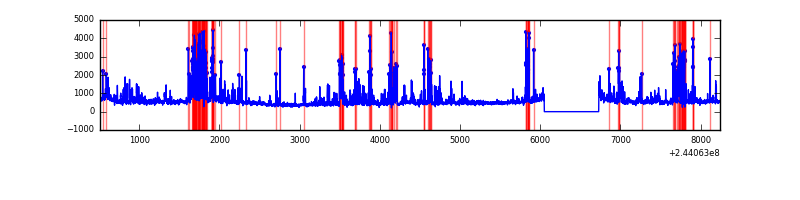 |
Top three noisy pixels from each quadrant. If the there are fewer than three noisy pixels in the level2.evt file, extra rows are filled as -1
| Pixel properties | Quadrant properties | ||||||
|---|---|---|---|---|---|---|---|
| Quadrant | DetID | PixID | Counts | Sigma | Mean | Median | Sigma |
| A | 15 | 174 | 85798 | 519.72 | 802 | 783 | 163.6 |
| A | 1 | 162 | 11944 | 68.23 | 802 | 783 | 163.6 |
| A | 13 | 248 | 9024 | 50.38 | 802 | 783 | 163.6 |
| B | 4 | 239 | 2180558 | 14648.25 | 784 | 762 | 148.8 |
| B | 0 | 219 | 86041 | 573.08 | 784 | 762 | 148.8 |
| B | 6 | 51 | 85865 | 571.89 | 784 | 762 | 148.8 |
| C | 0 | 207 | 5914 | 28.02 | 791 | 793 | 182.8 |
| C | 13 | 61 | 5883 | 27.85 | 791 | 793 | 182.8 |
| C | 8 | 222 | 5297 | 24.64 | 791 | 793 | 182.8 |
| D | 10 | 199 | 476824 | 2555.52 | 776 | 754 | 186.3 |
| D | 12 | 233 | 341872 | 1831.1 | 776 | 754 | 186.3 |
| D | 8 | 195 | 303703 | 1626.22 | 776 | 754 | 186.3 |
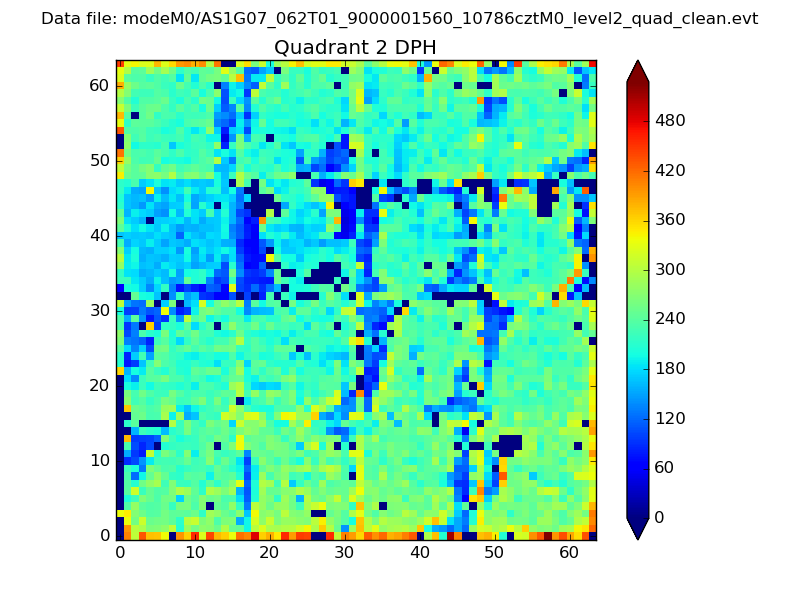
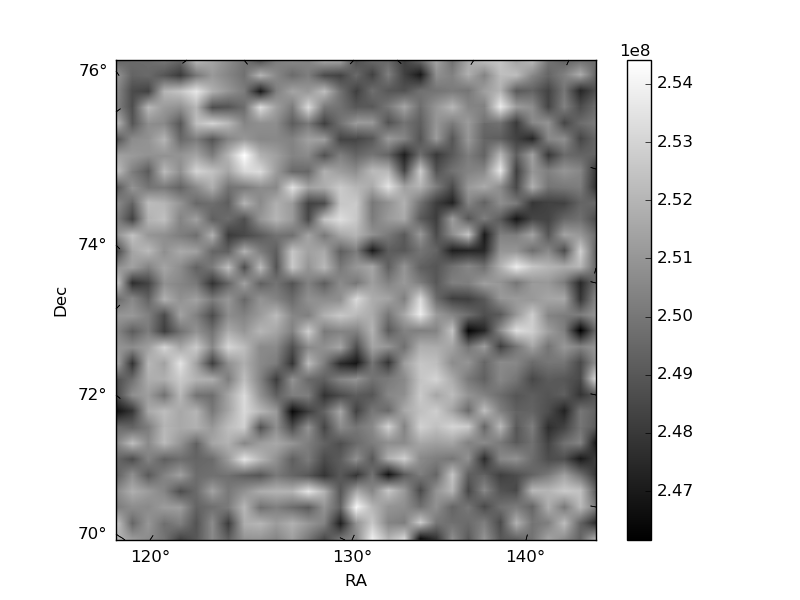
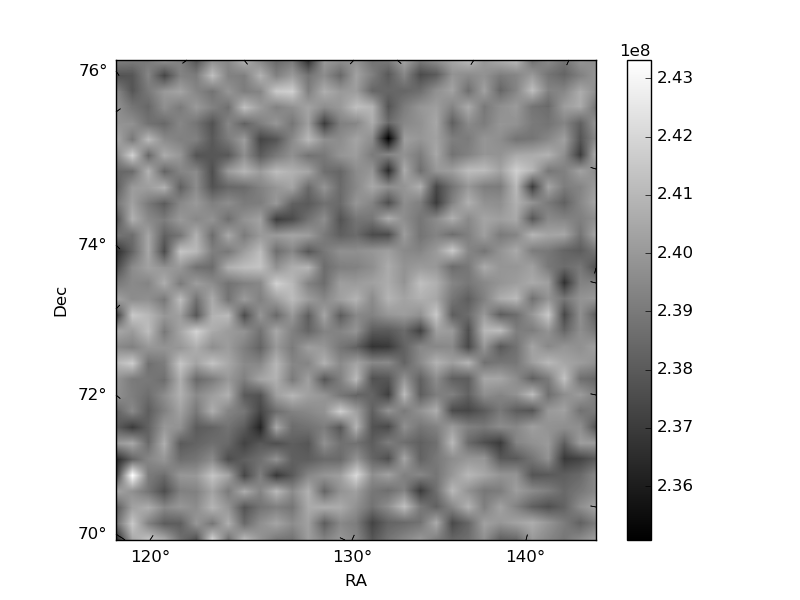
Histogram calculated using DETX and DETY for each event in the final _common_clean file
| Quadrant A | 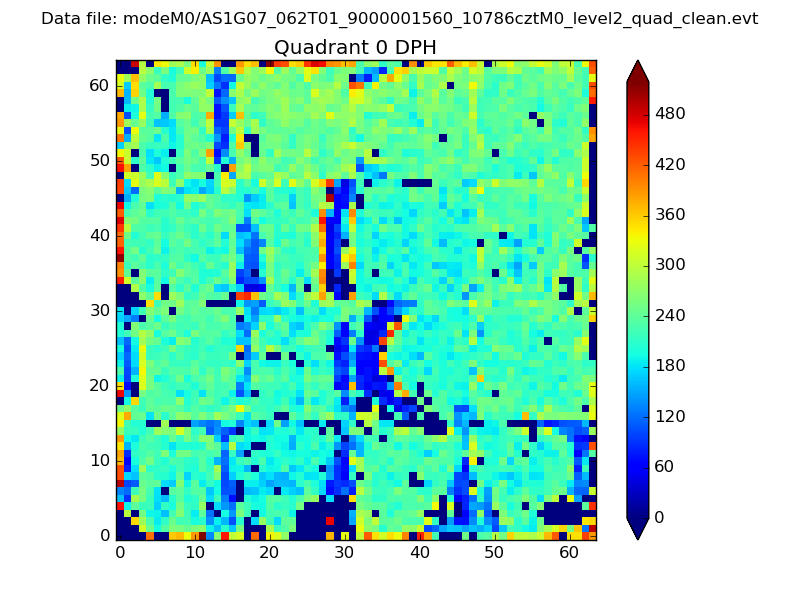 |
 |
Quadrant B |
|---|---|---|---|
| Quadrant D |  |
 |
Quadrant C |
| Plot type | Count rate plots | Images |
|---|---|---|
| Comparison with Poisson distribution Blue bars denote a histogram of data divided into 1 sec bins. Red curve is a Poisson curve with rate = median count rate of data. |
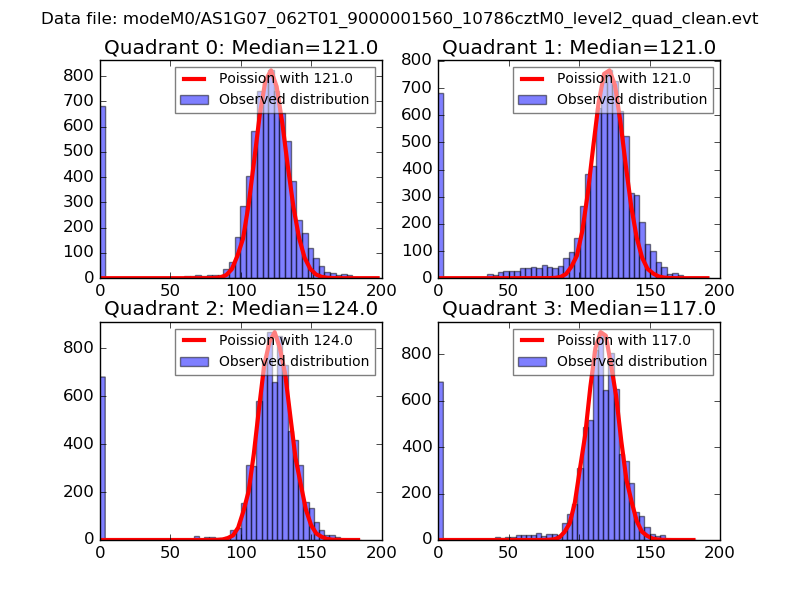 |
 |
| Quadrant-wise count rates Data is divided into 100 sec bins |
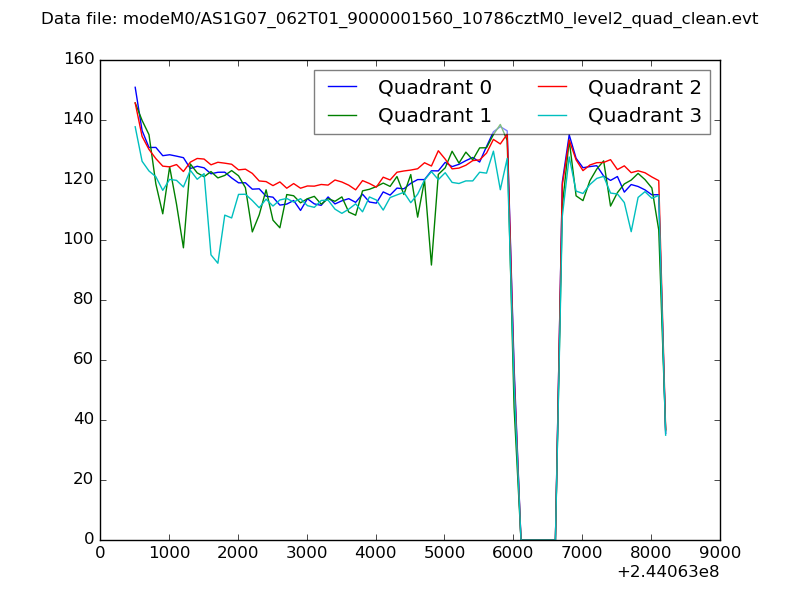 |
|
| Module-wise count rates for Quadrant A Data is divided into 100 sec bins |
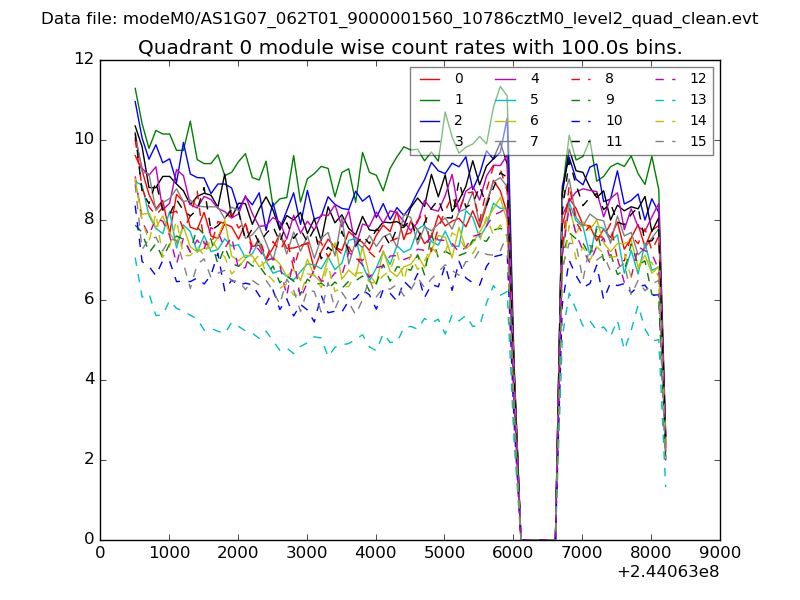 |
 |
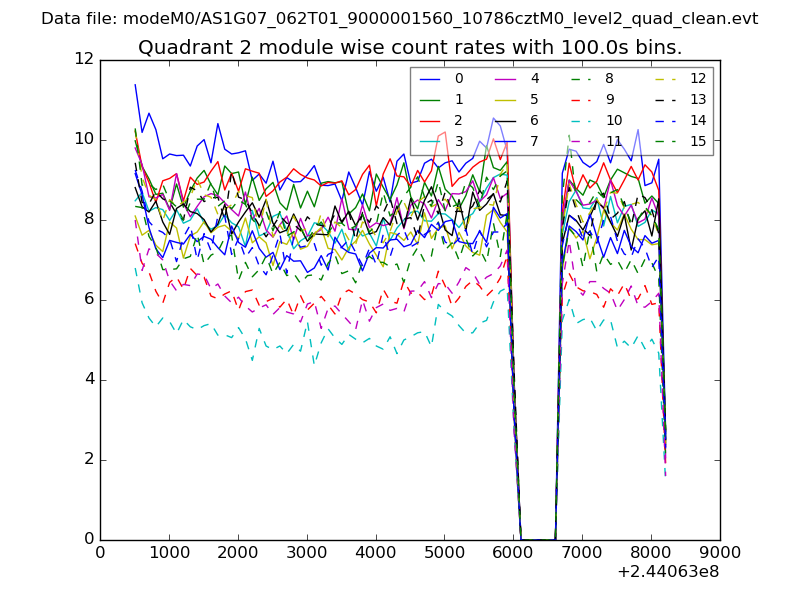
| Module-wise count rates for Quadrant B Data is divided into 100 sec bins |
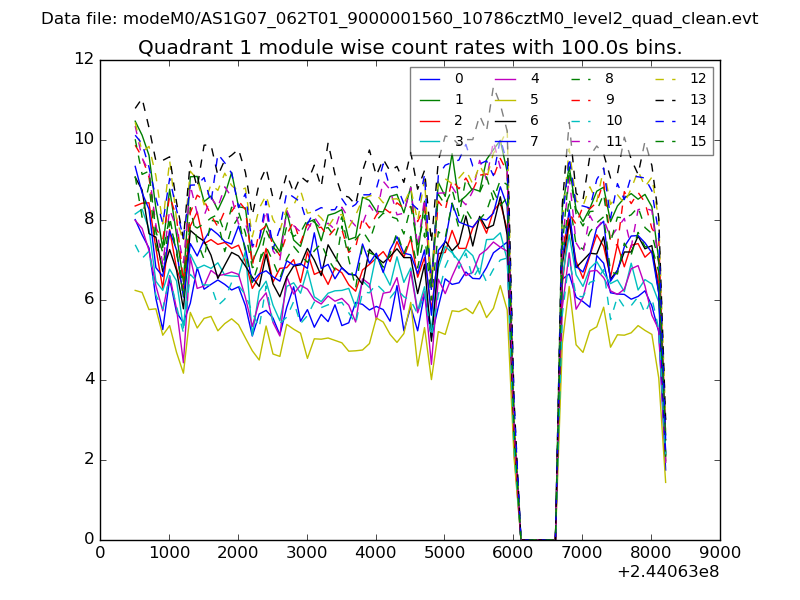 |
 |
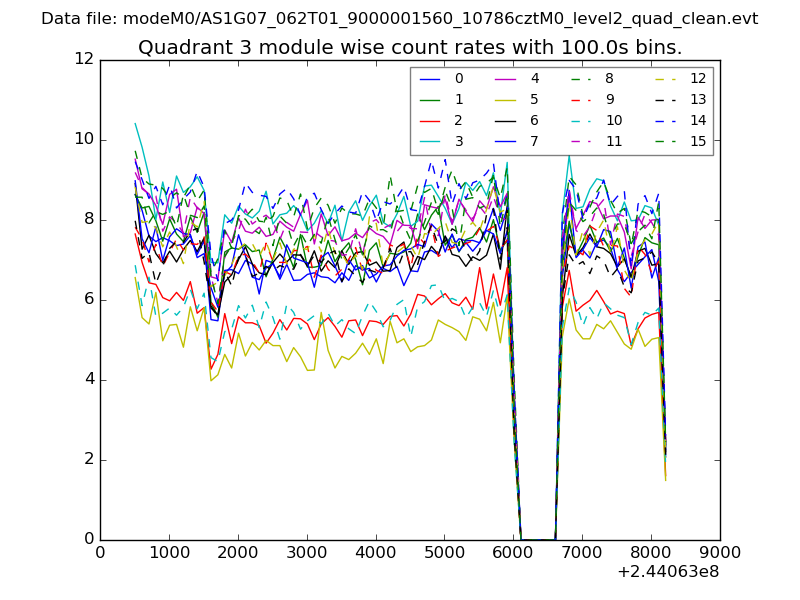
| Module-wise count rates for Quadrant C Data is divided into 100 sec bins |
 |
 |
| Module-wise count rates for Quadrant D Data is divided into 100 sec bins |
 |
 |
| Parameter | Plot |
|---|---|
| CZT HV Monitor |  |
| D_VDD | 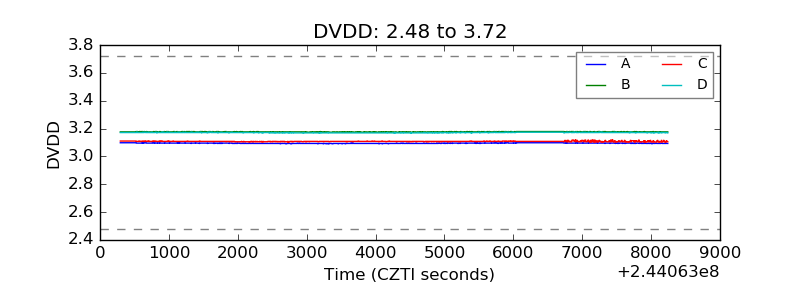 |
| Temperature 1 | 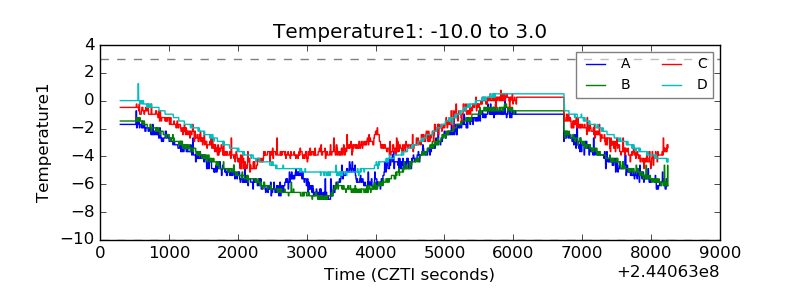 |
| Veto HV Monitor | 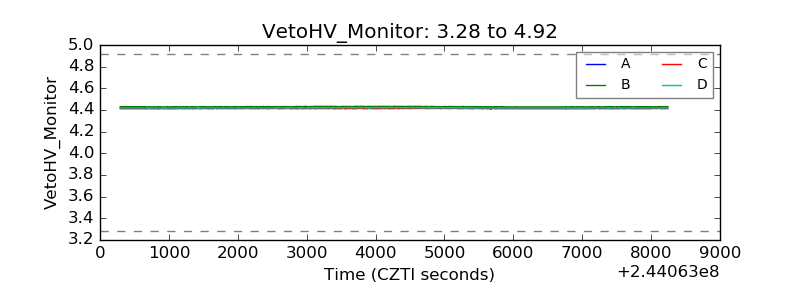 |
| Veto LLD | 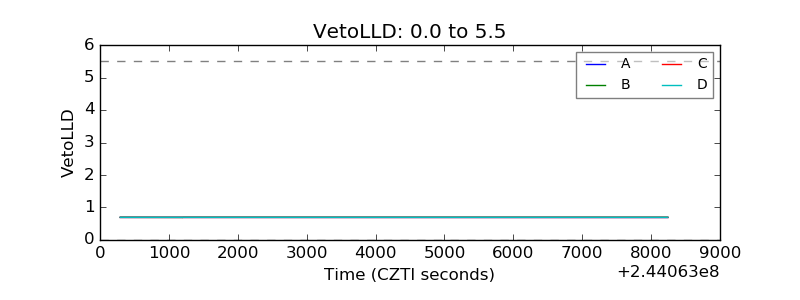 |
| Alpha Counter | 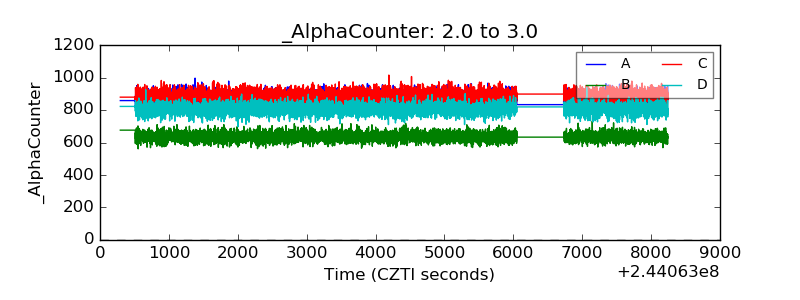 |
| _CPM_Rate | 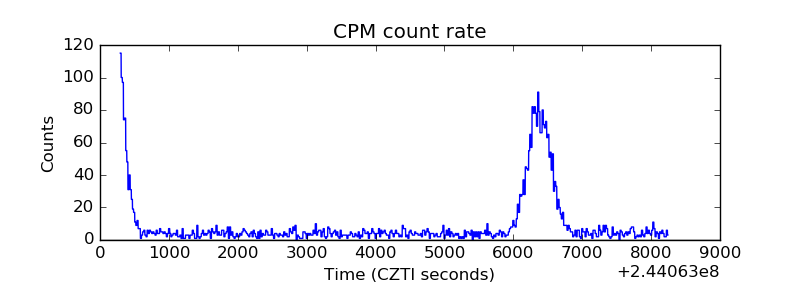 |
| CZT Counter | 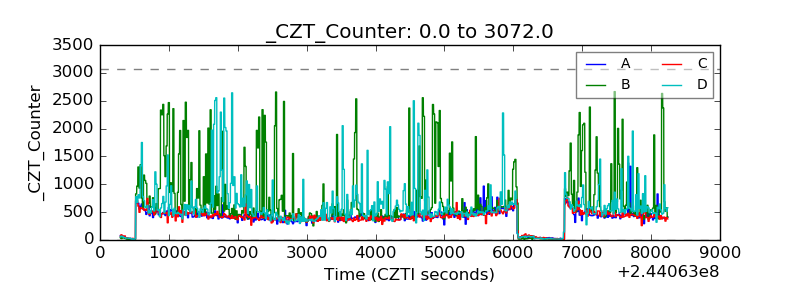 |
| +2.5 Volts monitor |  |
| +5 Volts monitor |  |
| _ROLL_ROT | 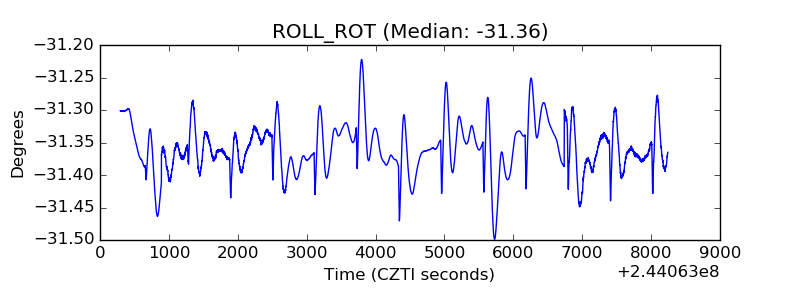 |
| _Roll_DEC | 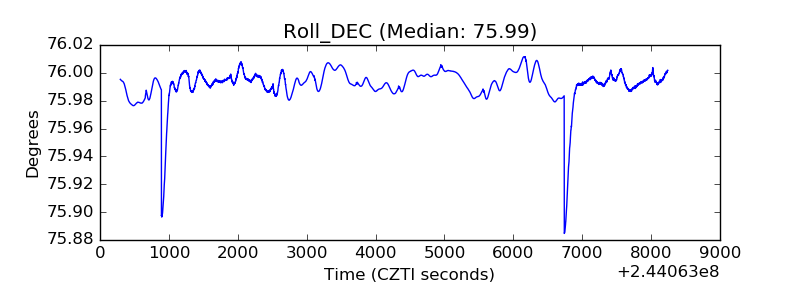 |
| _Roll_RA | 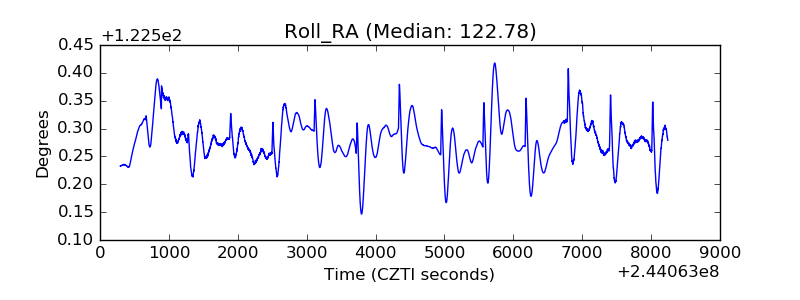 |
| Veto Counter | 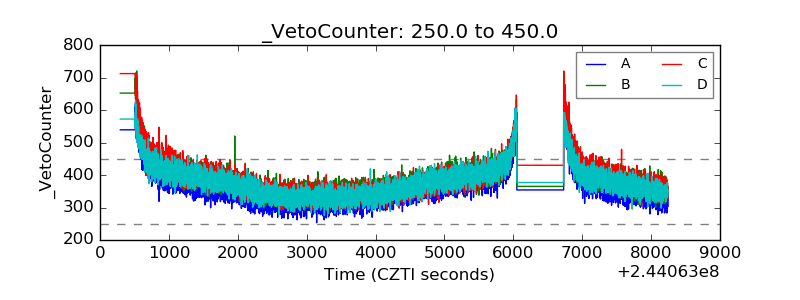 |