| Param | Original file | Final file |
|---|---|---|
| Filename | modeM0/AS1G07_062T01_9000001560_10787cztM0_level2.evt | modeM0/AS1G07_062T01_9000001560_10787cztM0_level2_quad_clean.evt |
| Size (bytes) | 608,359,680 | 131,247,360 |
| Size | 580.2 MB | 125.2 MB |
| Events in quadrant A | 3,425,736 | 878,638 |
| Events in quadrant B | 5,915,485 | 846,132 |
| Events in quadrant C | 3,264,004 | 901,040 |
| Events in quadrant D | 5,317,627 | 834,343 |
| Mode M0 | |||
|---|---|---|---|
| Quadrant | BADHDUFLAG | Total packets | Discarded packets |
| A | 0 | 15548 | 3 |
| B | 0 | 22822 | 2 |
| C | 0 | 15133 | 2 |
| D | 0 | 20666 | 2 |
| Mode SS | |||
|---|---|---|---|
| Quadrant | BADHDUFLAG | Total packets | Discarded packets |
| A | 0 | 150 | 0 |
| B | 0 | 150 | 0 |
| C | 0 | 150 | 0 |
| D | 0 | 150 | 0 |
| Mode M9 | |||
|---|---|---|---|
| Quadrant | BADHDUFLAG | Total packets | Discarded packets |
| A | 0 | 9 | 0 |
| B | 0 | 9 | 0 |
| C | 0 | 9 | 0 |
| D | 0 | 9 | 0 |
| Quadrant | Total seconds | Saturated seconds | Saturation percentage |
|---|---|---|---|
| A | 7393 | 60 | 0.811579% |
| B | 7393 | 994 | 13.445151% |
| C | 7393 | 29 | 0.392263% |
| D | 7393 | 366 | 4.950629% |
Noise dominated data is calculated using 1-second bins in cleaned event files. If a bin has >2000 counts, and if more than 50% of those come from <1% of pixels, then it is considered to be noise-dominated and hence unusable.
| Quadrant | # 1 sec bins | Bins with >0 counts | Bins with >2000 counts | High rate bins dominated by noise | Noise dominated (total time) | Noise dominated (detector-on time) | Marked lightcurve |
|---|---|---|---|---|---|---|---|
| A | 7733 | 7394 | 25 | 25 | 0.32% | 0.34% | 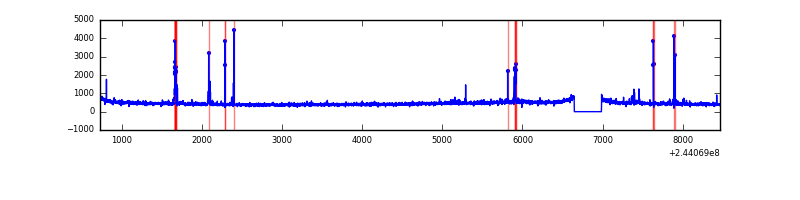 |
| B | 7733 | 7394 | 501 | 501 | 6.48% | 6.78% | 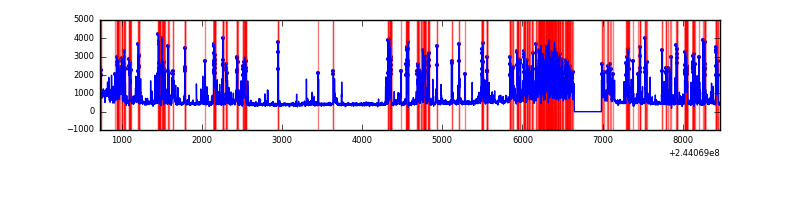 |
| C | 7733 | 7394 | 3 | 3 | 0.04% | 0.04% | 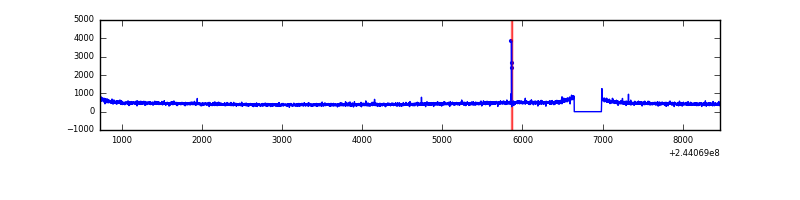 |
| D | 7733 | 7394 | 236 | 236 | 3.05% | 3.19% | 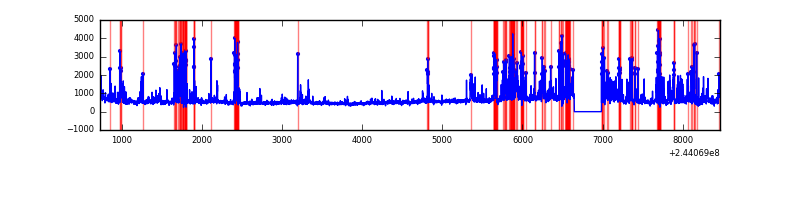 |
Top three noisy pixels from each quadrant. If the there are fewer than three noisy pixels in the level2.evt file, extra rows are filled as -1
| Pixel properties | Quadrant properties | ||||||
|---|---|---|---|---|---|---|---|
| Quadrant | DetID | PixID | Counts | Sigma | Mean | Median | Sigma |
| A | 15 | 174 | 132800 | 782.58 | 836 | 817 | 168.7 |
| A | 13 | 248 | 26290 | 151.04 | 836 | 817 | 168.7 |
| A | 11 | 29 | 14813 | 82.99 | 836 | 817 | 168.7 |
| B | 4 | 239 | 2604601 | 17051.4 | 805 | 783 | 152.7 |
| B | 0 | 219 | 60451 | 390.74 | 805 | 783 | 152.7 |
| B | 0 | 85 | 38954 | 249.97 | 805 | 783 | 152.7 |
| C | 0 | 207 | 9973 | 47.35 | 827 | 829 | 193.1 |
| C | 8 | 128 | 9776 | 46.33 | 827 | 829 | 193.1 |
| C | 8 | 112 | 7111 | 32.53 | 827 | 829 | 193.1 |
| D | 8 | 195 | 637411 | 3325.54 | 801 | 777 | 191.4 |
| D | 10 | 199 | 299792 | 1561.94 | 801 | 777 | 191.4 |
| D | 13 | 104 | 265622 | 1383.45 | 801 | 777 | 191.4 |
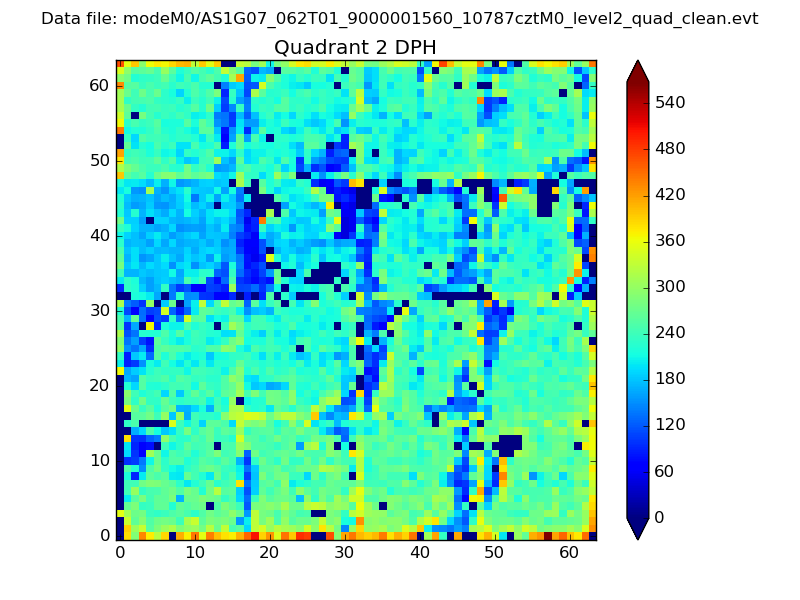
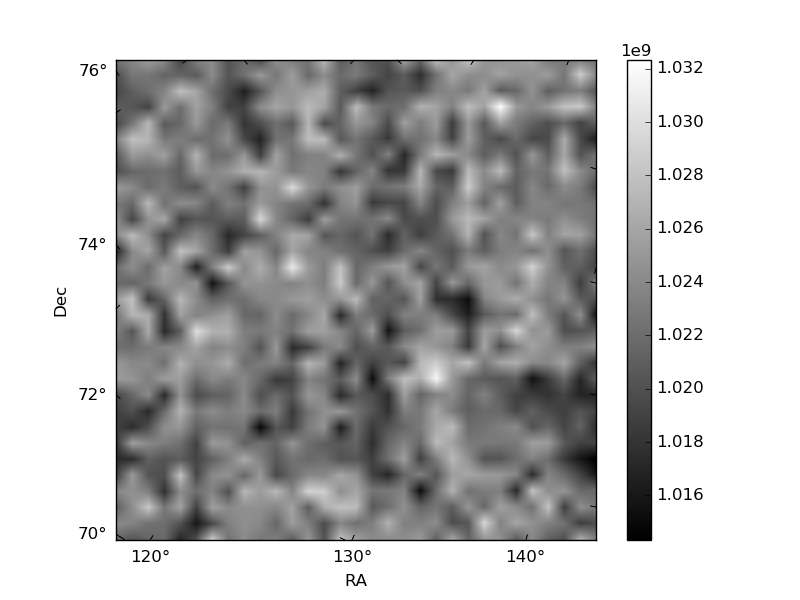
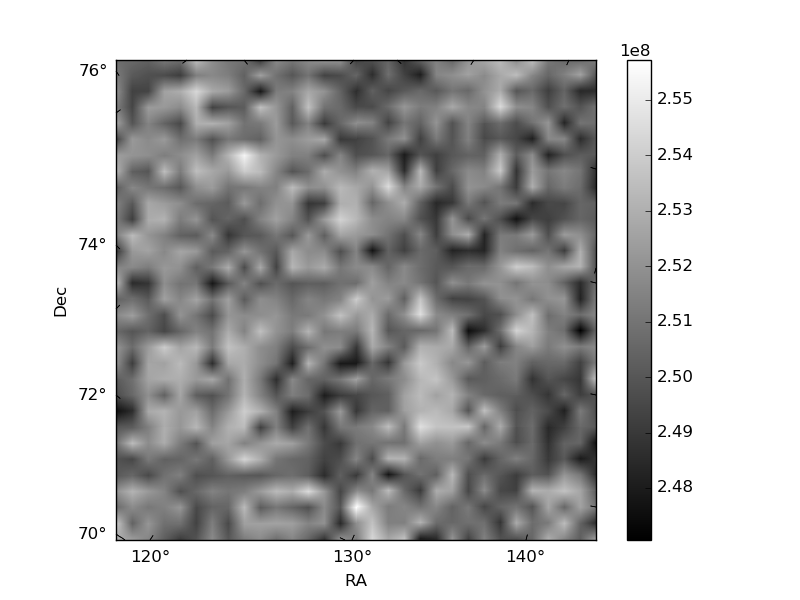
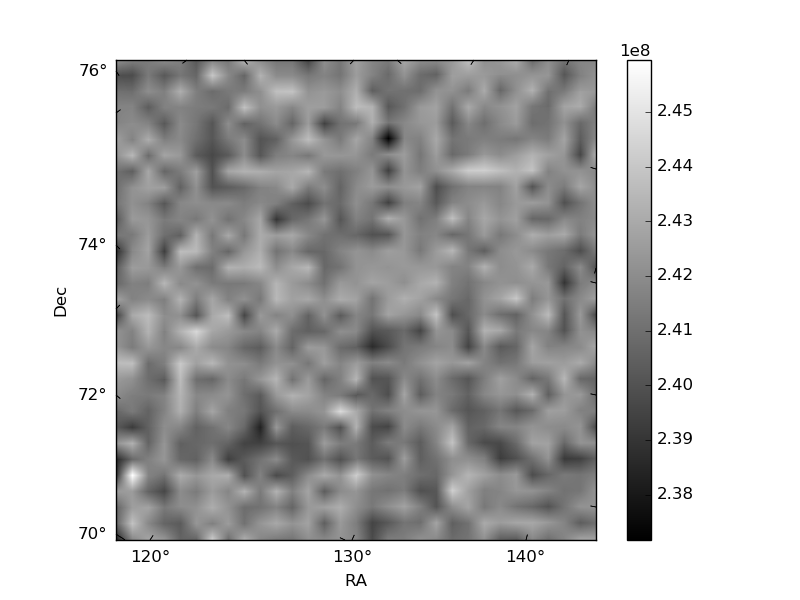
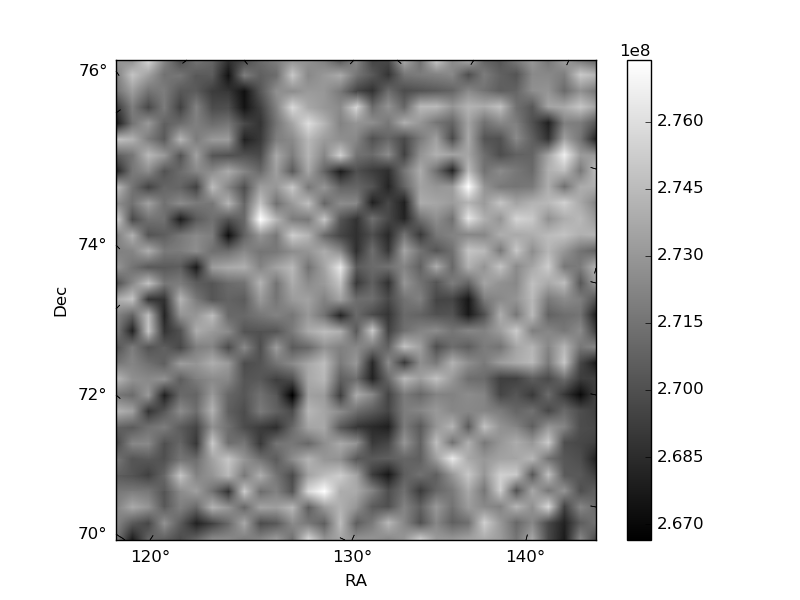
Histogram calculated using DETX and DETY for each event in the final _common_clean file
| Quadrant A | 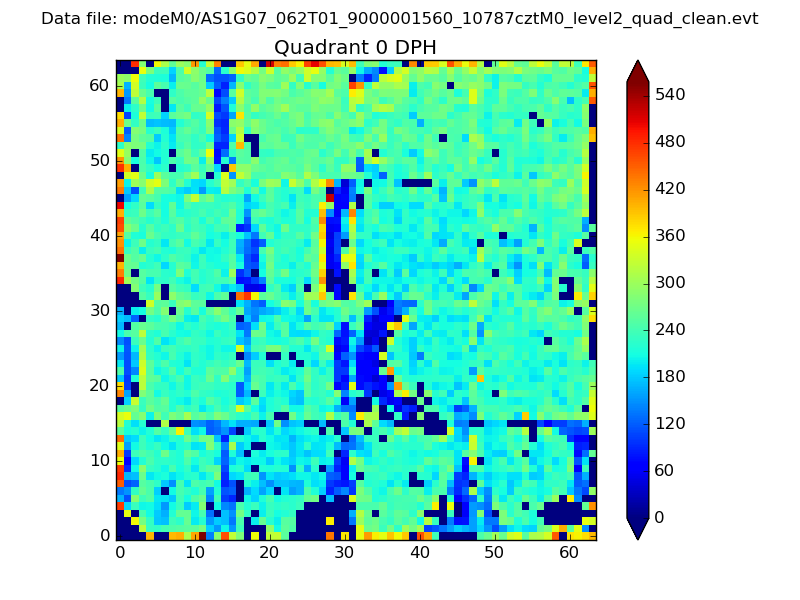 |
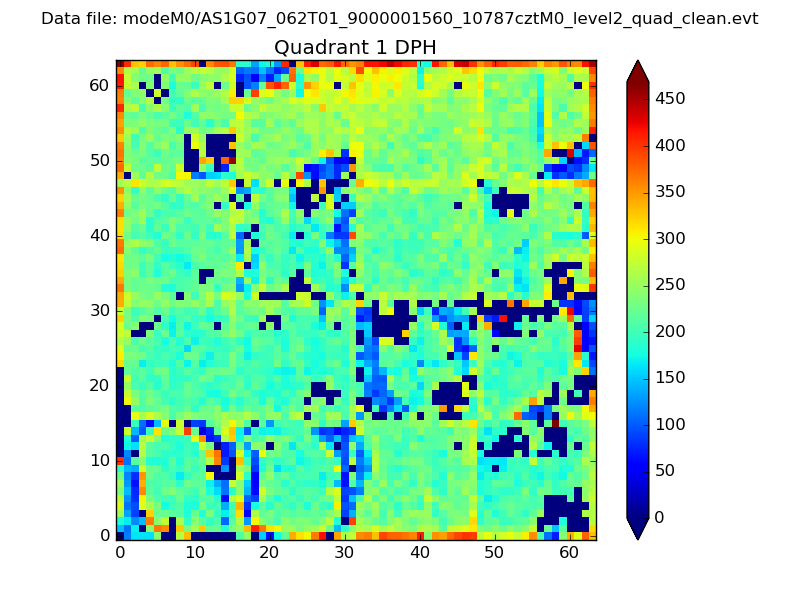 |
Quadrant B |
|---|---|---|---|
| Quadrant D | 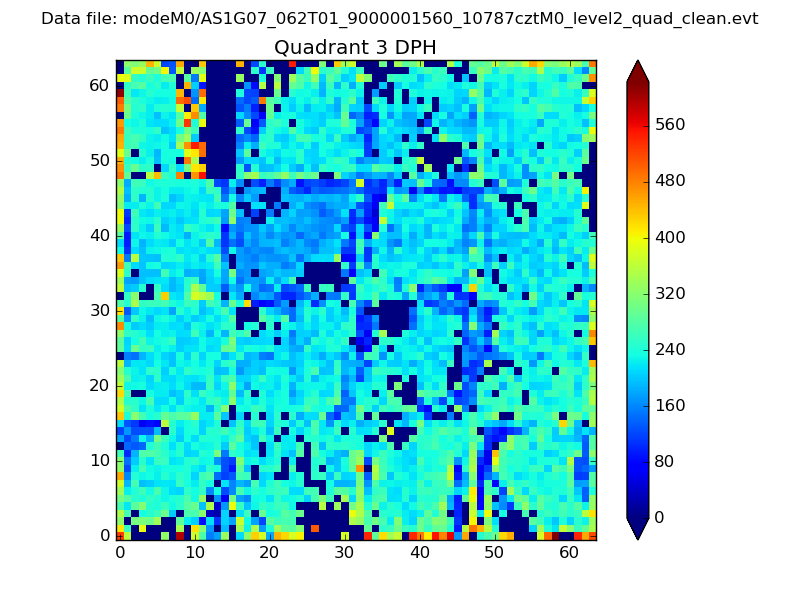 |
 |
Quadrant C |
| Plot type | Count rate plots | Images |
|---|---|---|
| Comparison with Poisson distribution Blue bars denote a histogram of data divided into 1 sec bins. Red curve is a Poisson curve with rate = median count rate of data. |
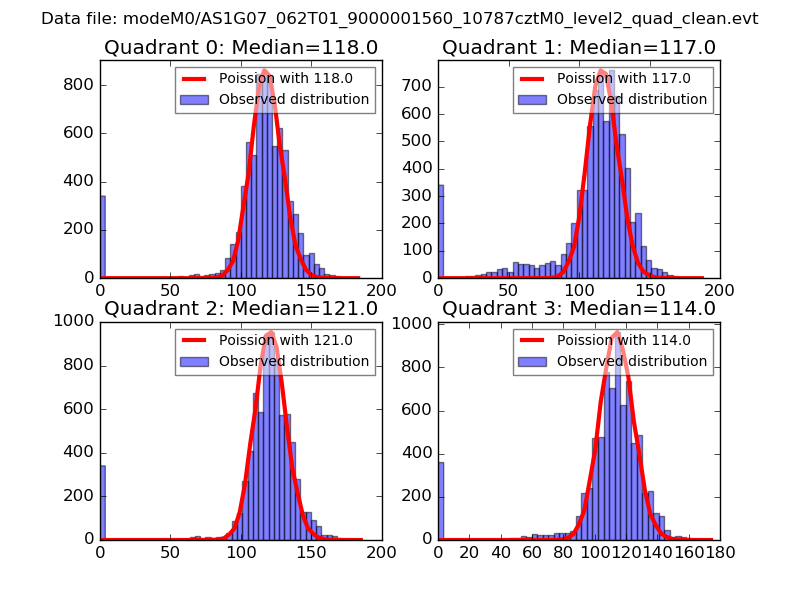 |
 |
| Quadrant-wise count rates Data is divided into 100 sec bins |
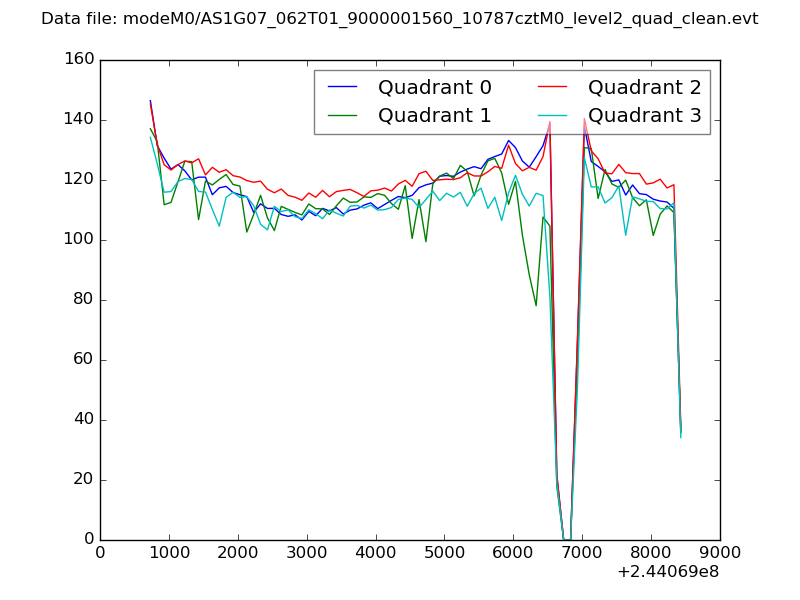 |
|
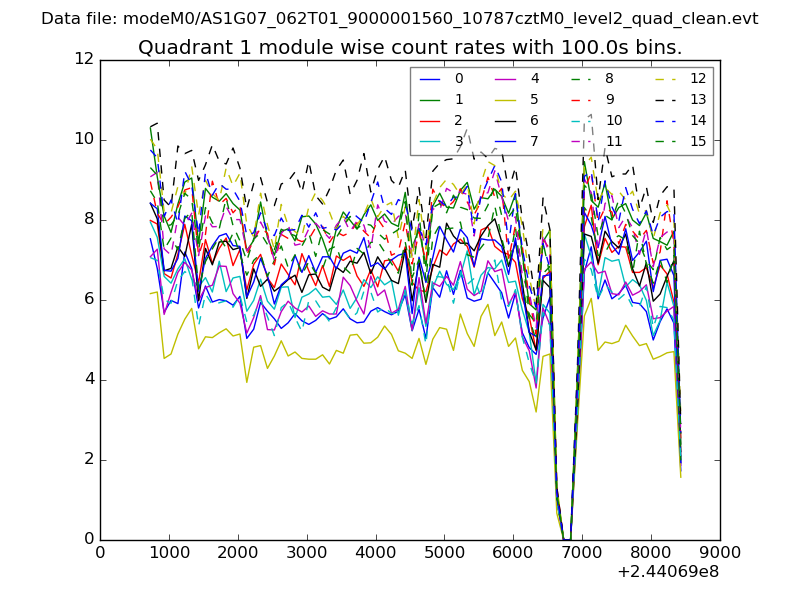
| Module-wise count rates for Quadrant A Data is divided into 100 sec bins |
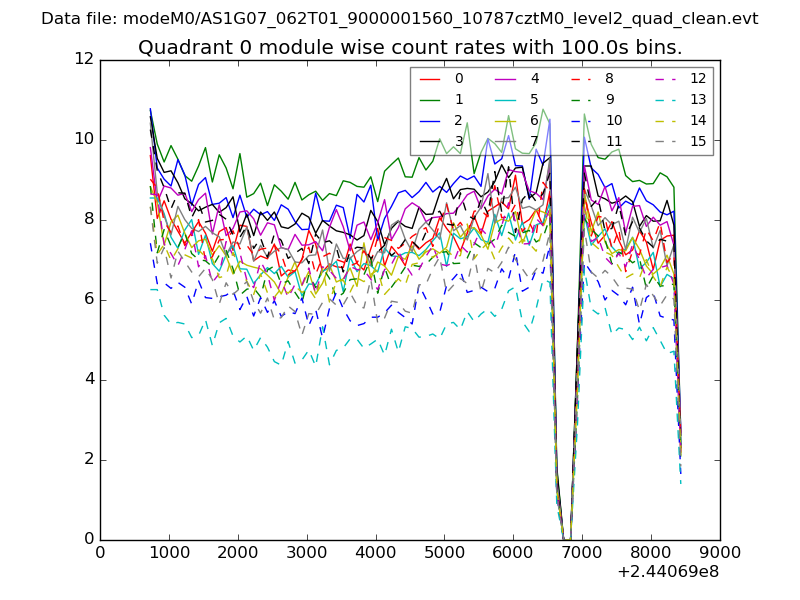 |
 |
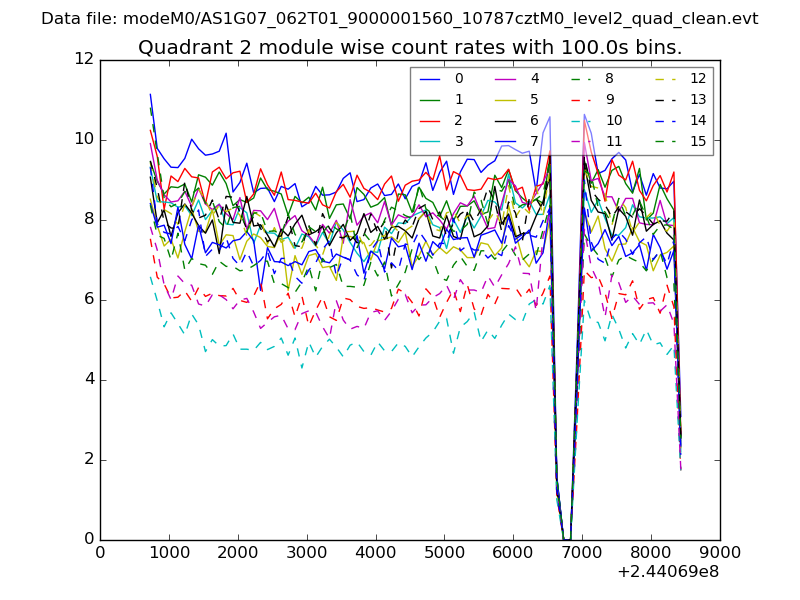
| Module-wise count rates for Quadrant B Data is divided into 100 sec bins |
 |
 |
| Module-wise count rates for Quadrant C Data is divided into 100 sec bins |
 |
 |
| Module-wise count rates for Quadrant D Data is divided into 100 sec bins |
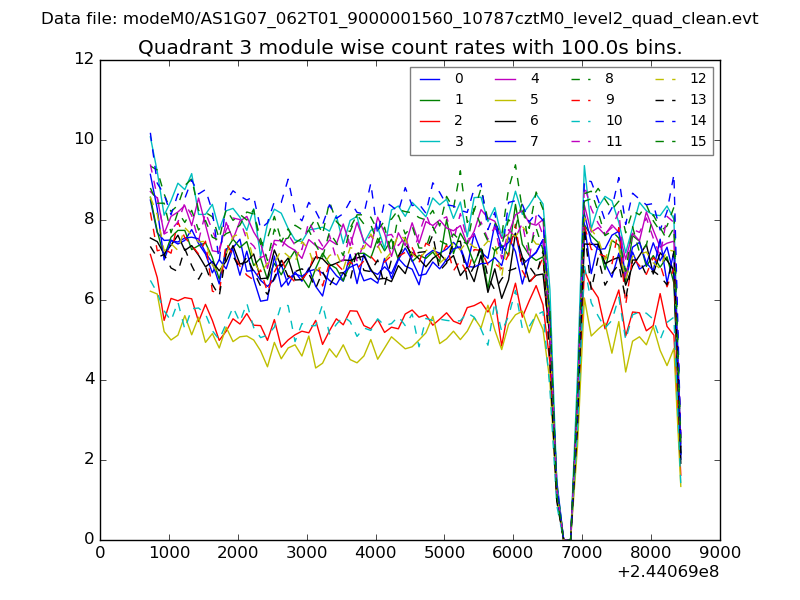 |
 |
| Parameter | Plot |
|---|---|
| CZT HV Monitor | 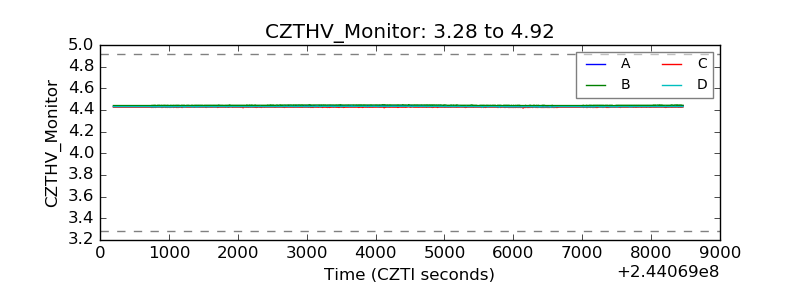 |
| D_VDD | 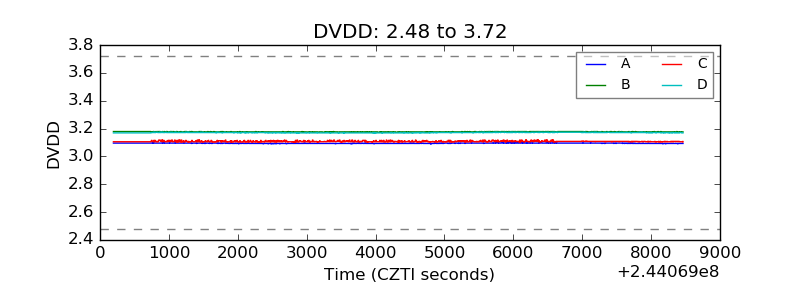 |
| Temperature 1 | 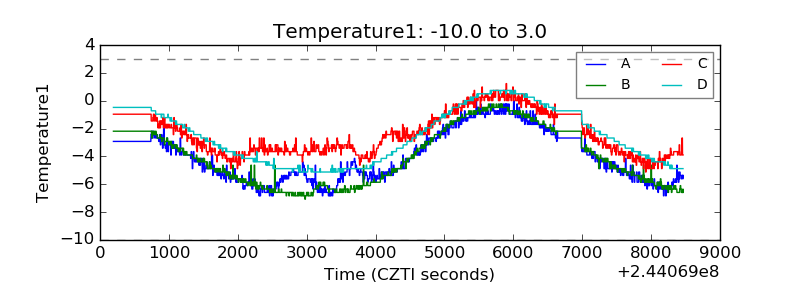 |
| Veto HV Monitor | 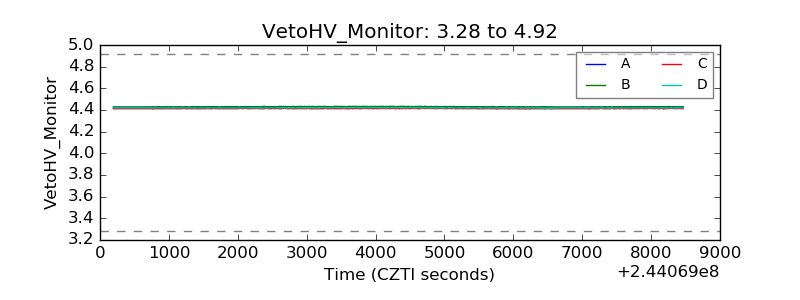 |
| Veto LLD | 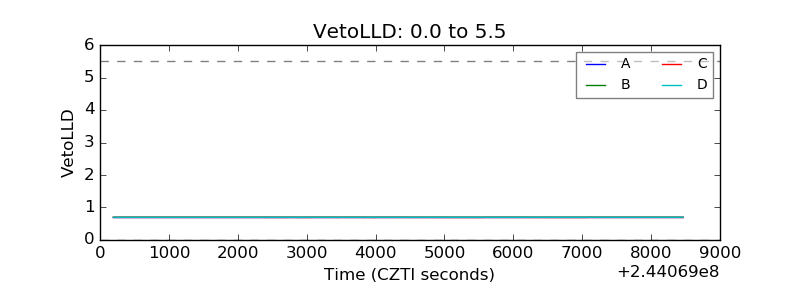 |
| Alpha Counter | 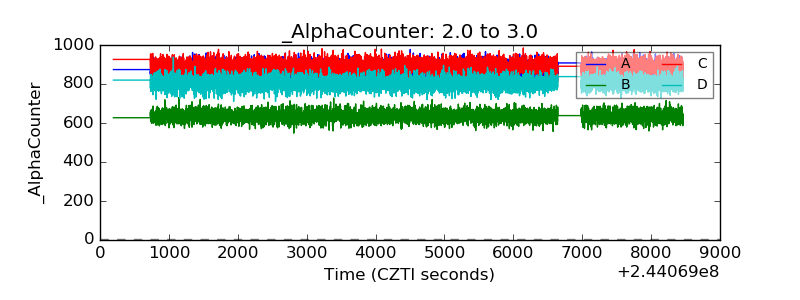 |
| _CPM_Rate | 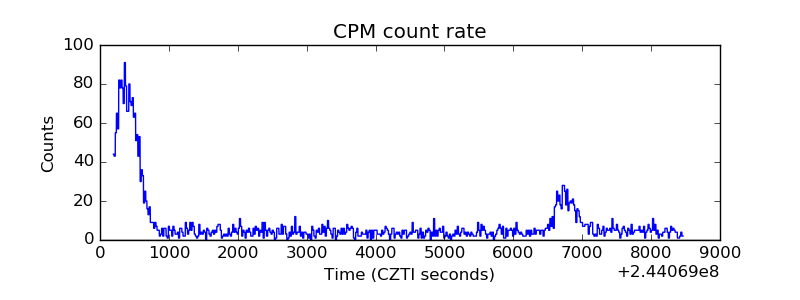 |
| CZT Counter |  |
| +2.5 Volts monitor |  |
| +5 Volts monitor |  |
| _ROLL_ROT | 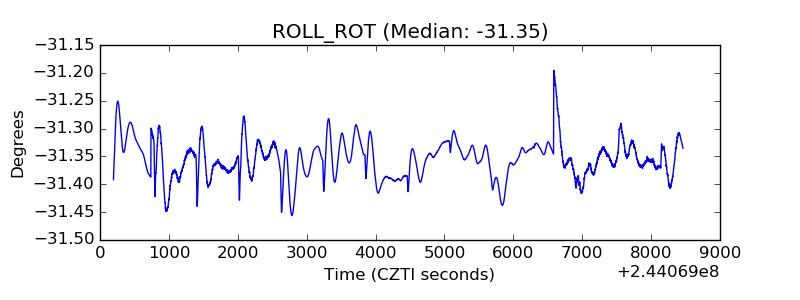 |
| _Roll_DEC | 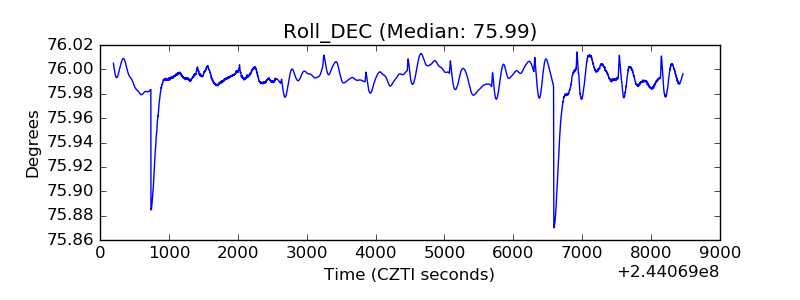 |
| _Roll_RA | 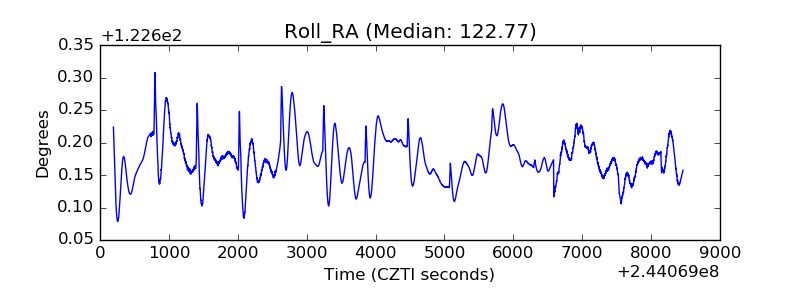 |
| Veto Counter | 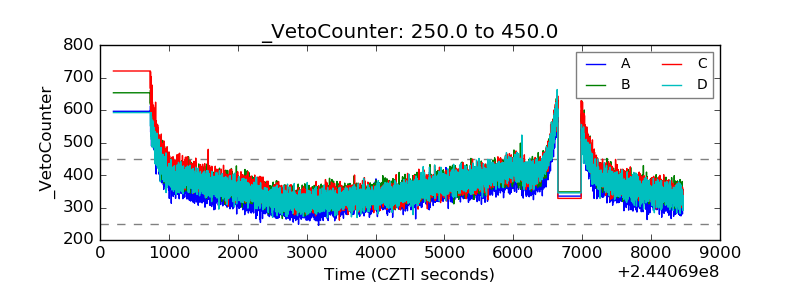 |