| Param | Original file | Final file |
|---|---|---|
| Filename | modeM0/AS1G07_062T01_9000001560_10793cztM0_level2.evt | modeM0/AS1G07_062T01_9000001560_10793cztM0_level2_quad_clean.evt |
| Size (bytes) | 327,029,760 | 80,712,000 |
| Size | 311.9 MB | 77.0 MB |
| Events in quadrant A | 2,004,333 | 540,791 |
| Events in quadrant B | 3,068,949 | 530,507 |
| Events in quadrant C | 1,909,681 | 538,229 |
| Events in quadrant D | 2,608,965 | 513,000 |
| Mode M0 | |||
|---|---|---|---|
| Quadrant | BADHDUFLAG | Total packets | Discarded packets |
| A | 0 | 9194 | 0 |
| B | 0 | 12221 | 0 |
| C | 0 | 9152 | 0 |
| D | 0 | 10652 | 0 |
| Mode SS | |||
|---|---|---|---|
| Quadrant | BADHDUFLAG | Total packets | Discarded packets |
| A | 0 | 92 | 0 |
| B | 0 | 92 | 0 |
| C | 0 | 92 | 0 |
| D | 0 | 92 | 0 |
| Quadrant | Total seconds | Saturated seconds | Saturation percentage |
|---|---|---|---|
| A | 4574 | 6 | 0.131176% |
| B | 4574 | 291 | 6.362046% |
| C | 4574 | 0 | 0.000000% |
| D | 4574 | 52 | 1.136861% |
Noise dominated data is calculated using 1-second bins in cleaned event files. If a bin has >2000 counts, and if more than 50% of those come from <1% of pixels, then it is considered to be noise-dominated and hence unusable.
| Quadrant | # 1 sec bins | Bins with >0 counts | Bins with >2000 counts | High rate bins dominated by noise | Noise dominated (total time) | Noise dominated (detector-on time) | Marked lightcurve |
|---|---|---|---|---|---|---|---|
| A | 4574 | 4574 | 2 | 2 | 0.04% | 0.04% | 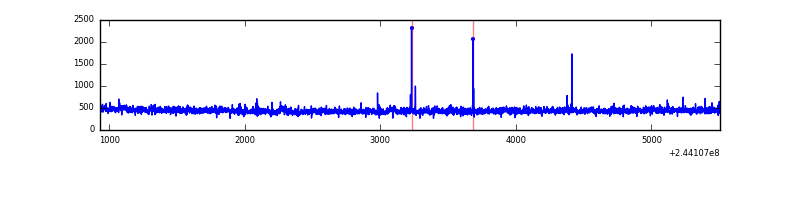 |
| B | 4574 | 4574 | 197 | 197 | 4.31% | 4.31% | 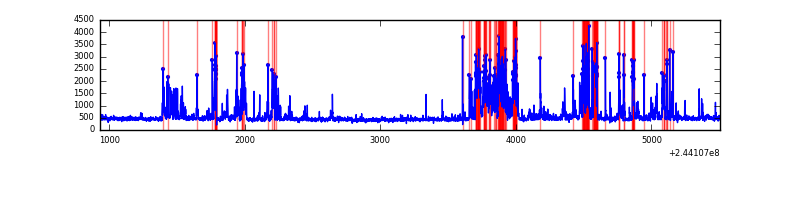 |
| C | 4574 | 4574 | 0 | 0 | 0.00% | 0.00% | 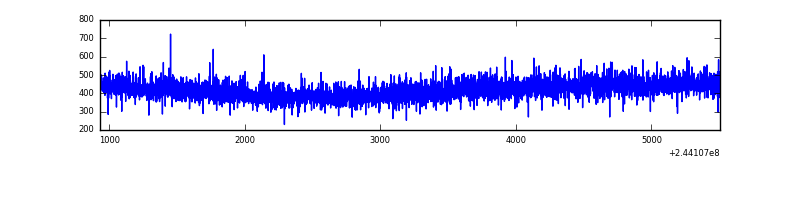 |
| D | 4574 | 4574 | 38 | 38 | 0.83% | 0.83% | 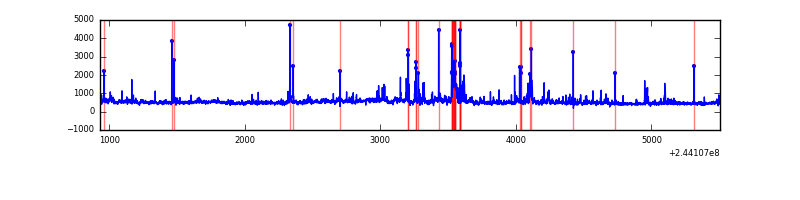 |
Top three noisy pixels from each quadrant. If the there are fewer than three noisy pixels in the level2.evt file, extra rows are filled as -1
| Pixel properties | Quadrant properties | ||||||
|---|---|---|---|---|---|---|---|
| Quadrant | DetID | PixID | Counts | Sigma | Mean | Median | Sigma |
| A | 8 | 15 | 43620 | 417.23 | 503 | 491 | 103.4 |
| A | 15 | 174 | 9729 | 89.37 | 503 | 491 | 103.4 |
| A | 14 | 254 | 6841 | 61.43 | 503 | 491 | 103.4 |
| B | 4 | 239 | 1070854 | 11358.51 | 493 | 482 | 94.2 |
| B | 0 | 219 | 24837 | 258.45 | 493 | 482 | 94.2 |
| B | 15 | 204 | 17567 | 181.3 | 493 | 482 | 94.2 |
| C | 13 | 61 | 3588 | 27.24 | 488 | 488 | 113.8 |
| C | 8 | 222 | 2452 | 17.25 | 488 | 488 | 113.8 |
| C | 14 | 67 | 1265 | 6.83 | 488 | 488 | 113.8 |
| D | 8 | 195 | 310840 | 2617.99 | 486 | 471 | 118.6 |
| D | 7 | 71 | 135206 | 1136.5 | 486 | 471 | 118.6 |
| D | 1 | 52 | 112013 | 940.87 | 486 | 471 | 118.6 |
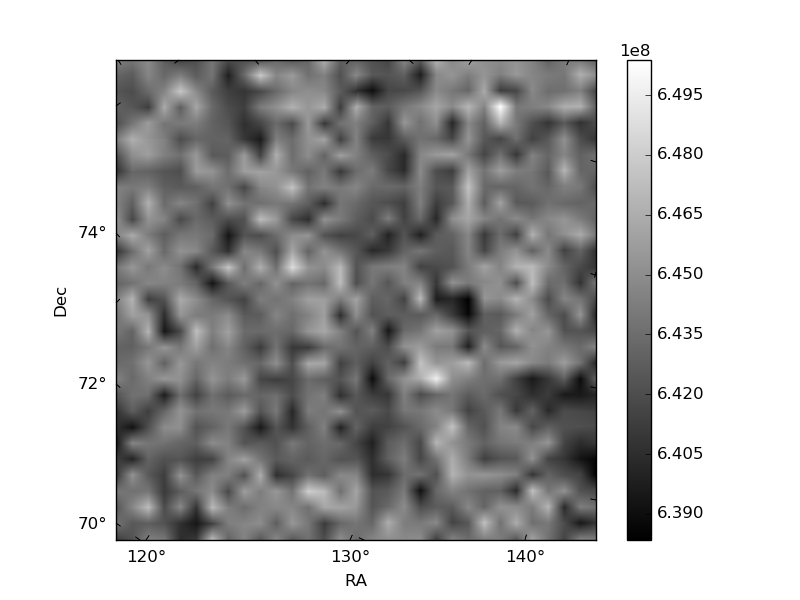
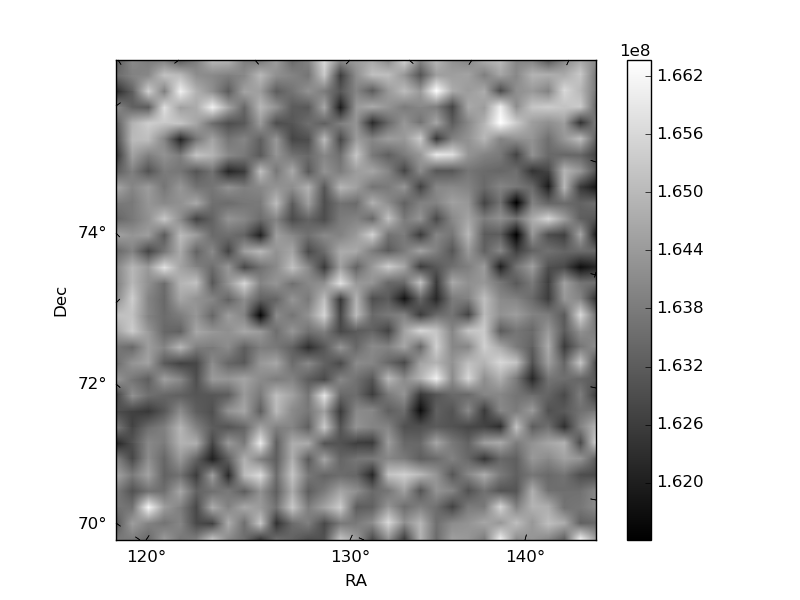
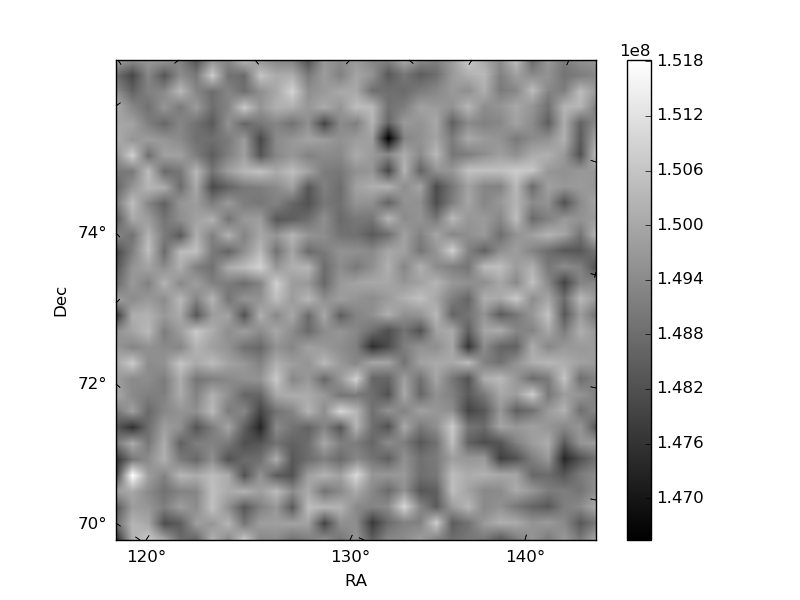
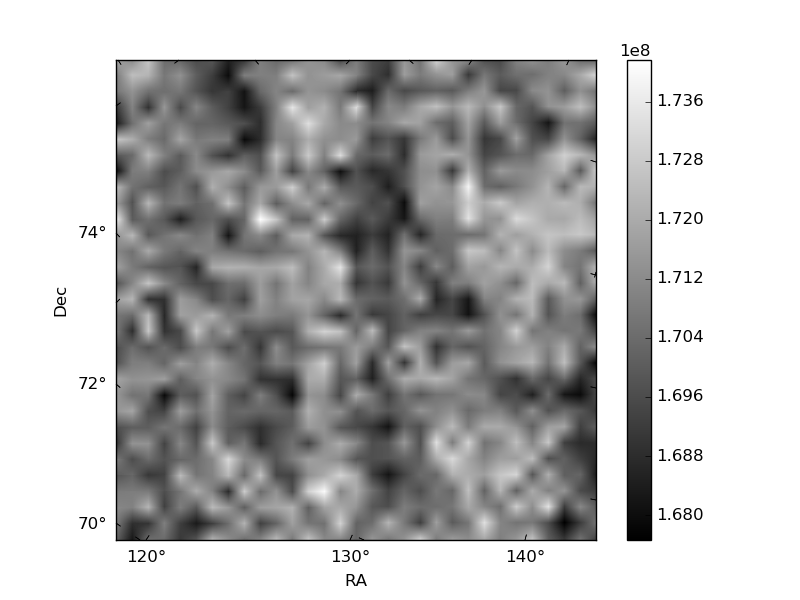
Histogram calculated using DETX and DETY for each event in the final _common_clean file
| Quadrant A | 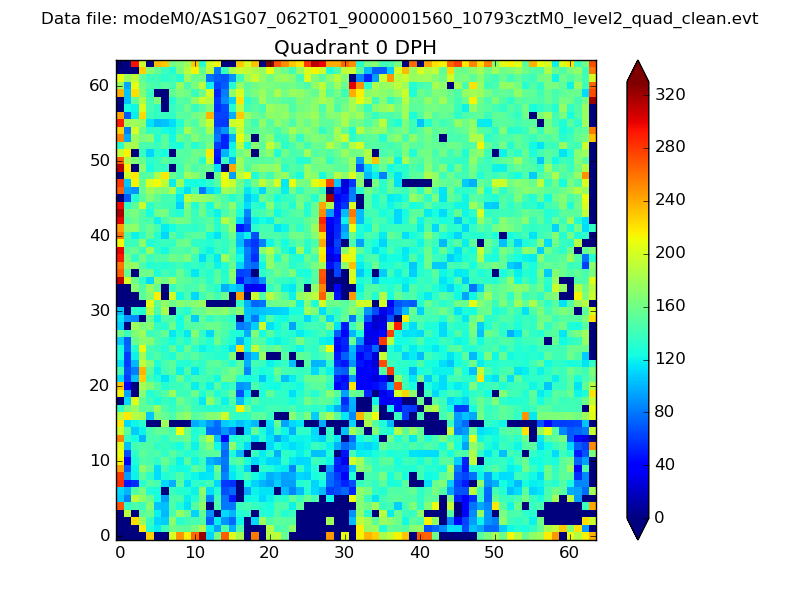 |
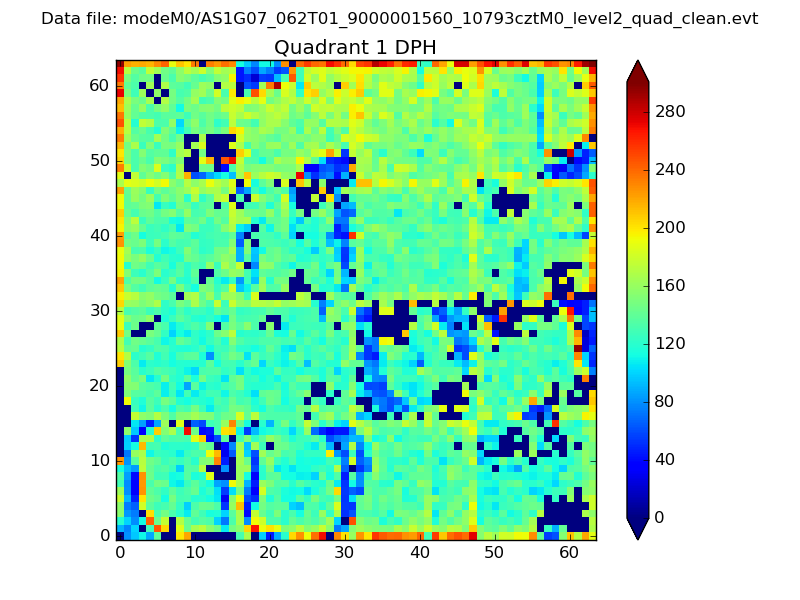 |
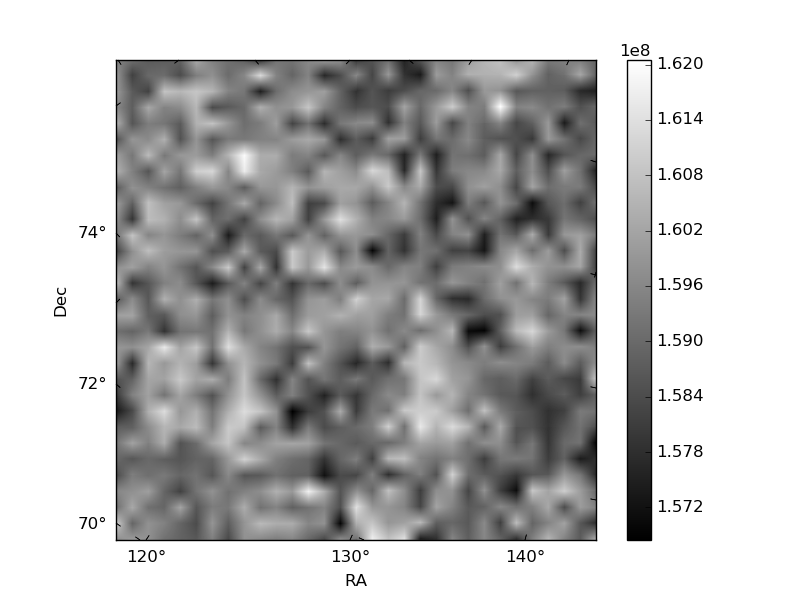
Quadrant B |
|---|---|---|---|
| Quadrant D | 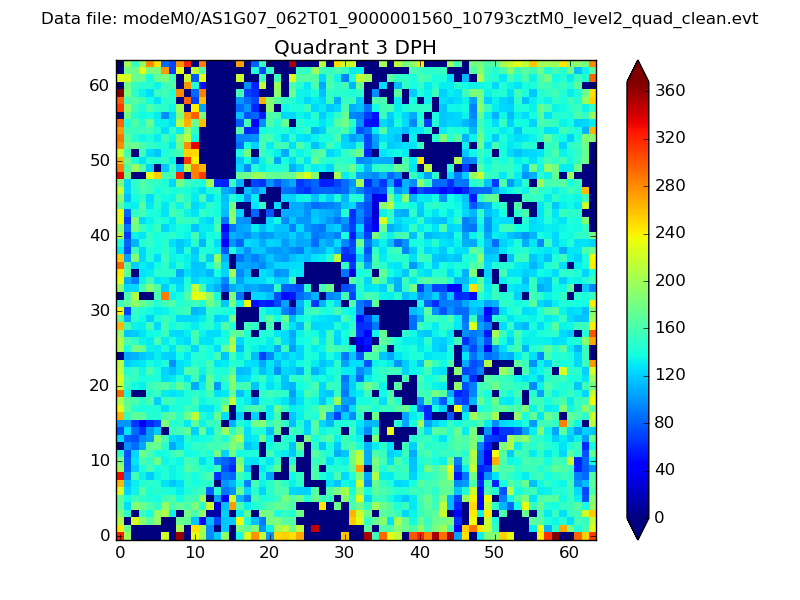 |
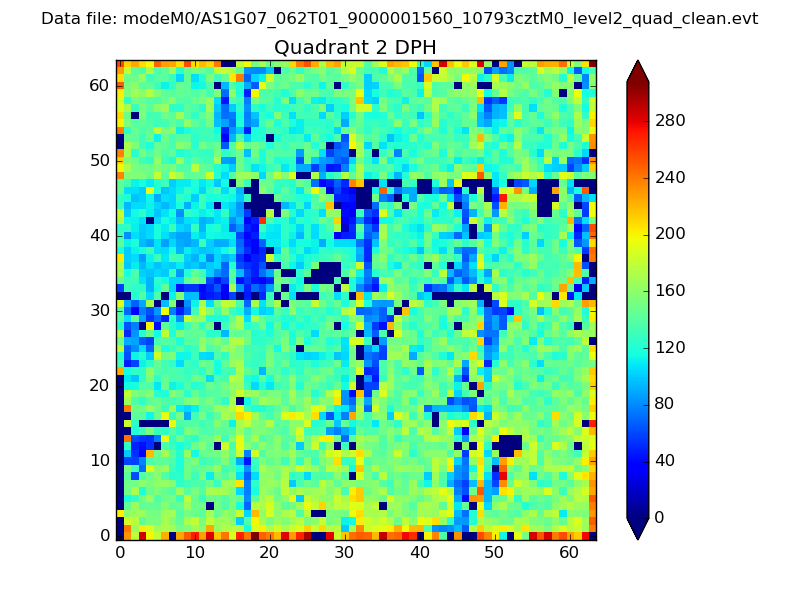 |
Quadrant C |
| Plot type | Count rate plots | Images |
|---|---|---|
| Comparison with Poisson distribution Blue bars denote a histogram of data divided into 1 sec bins. Red curve is a Poisson curve with rate = median count rate of data. |
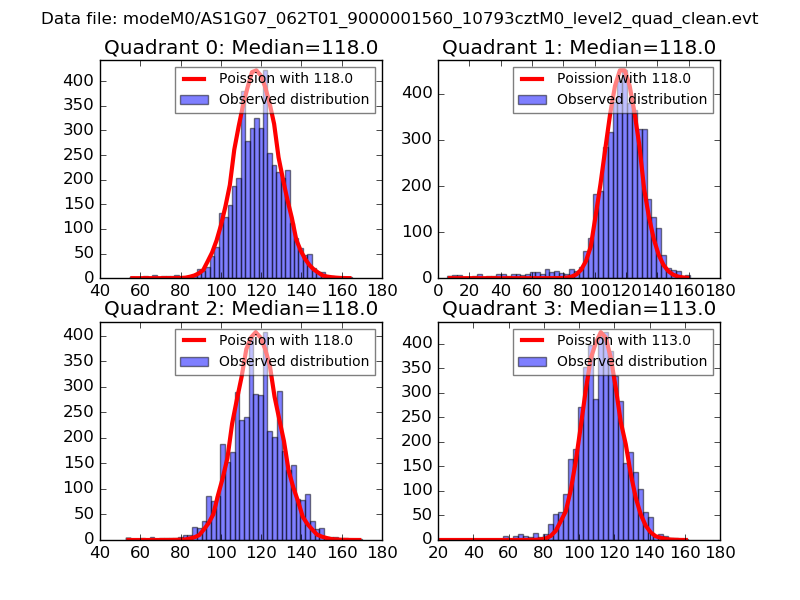 |
 |
| Quadrant-wise count rates Data is divided into 100 sec bins |
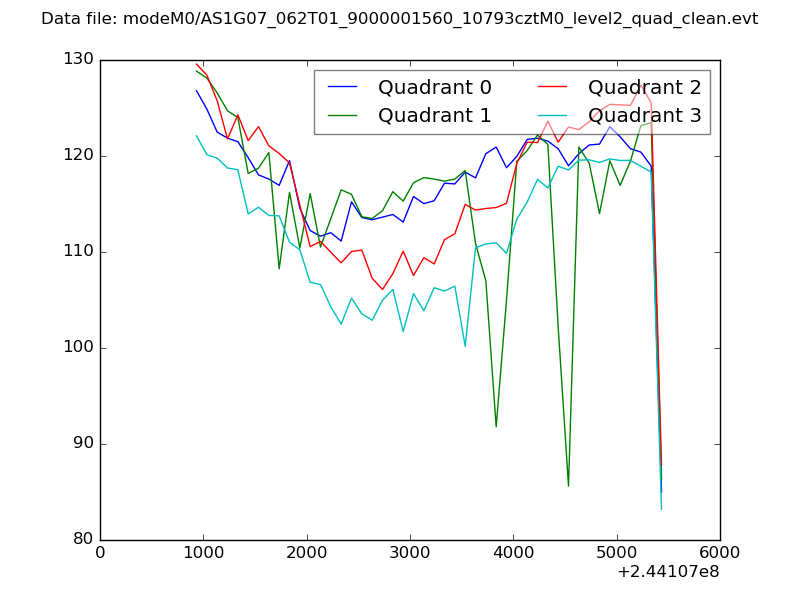 |
|
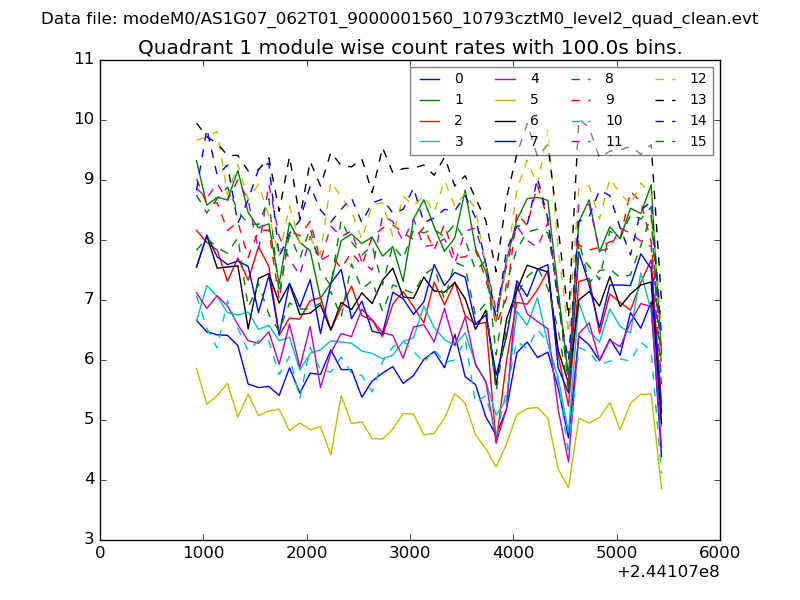
| Module-wise count rates for Quadrant A Data is divided into 100 sec bins |
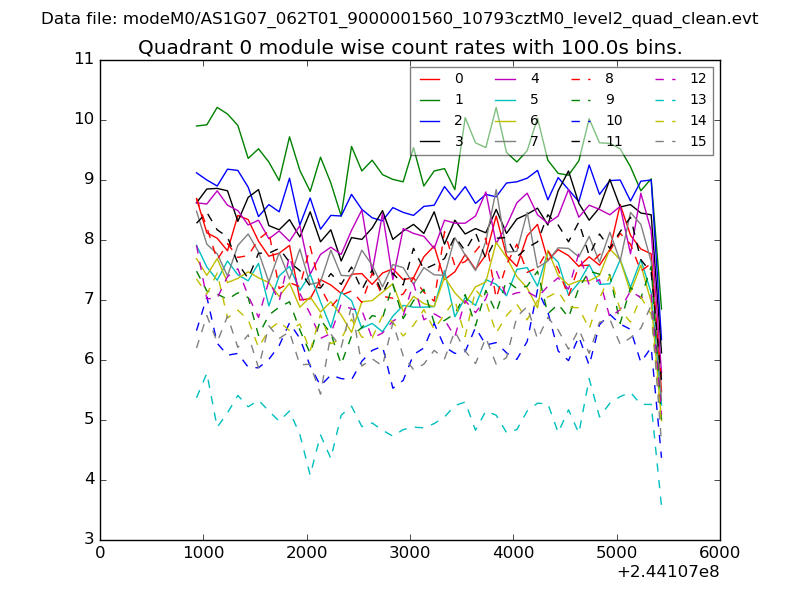 |
 |
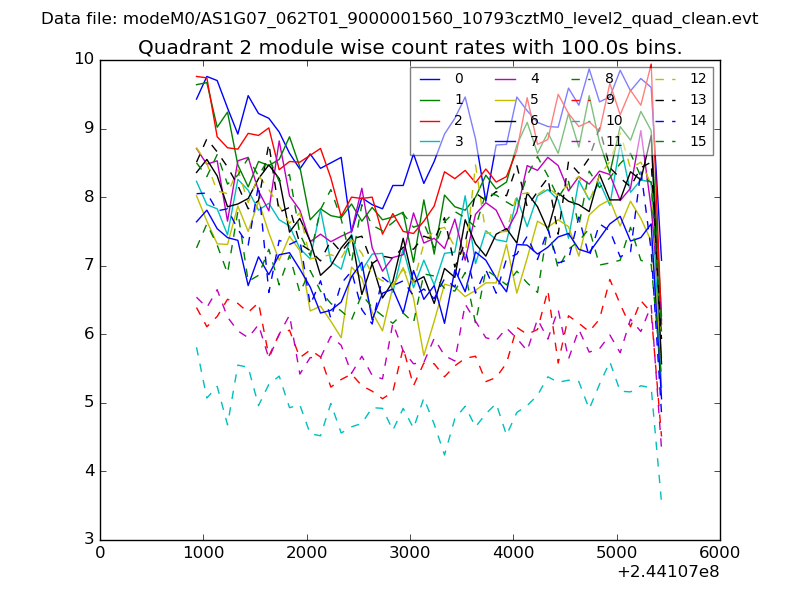
| Module-wise count rates for Quadrant B Data is divided into 100 sec bins |
 |
 |
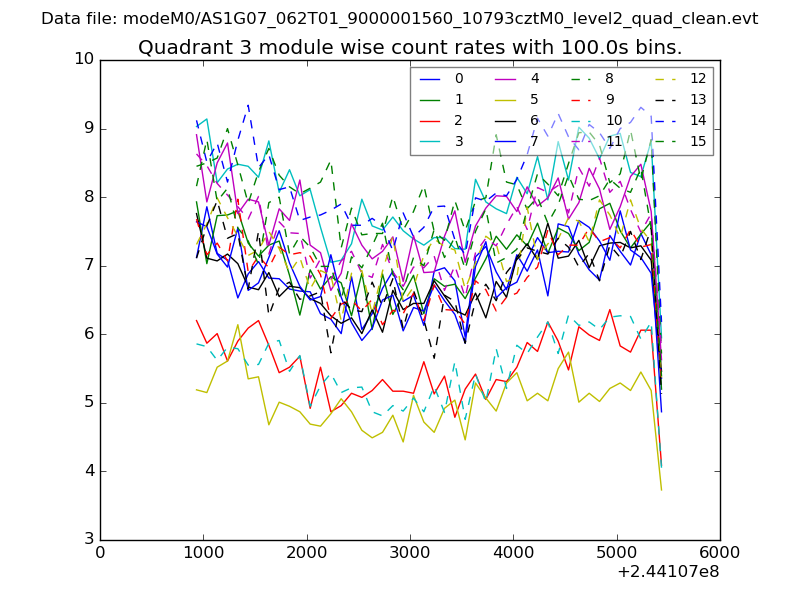
| Module-wise count rates for Quadrant C Data is divided into 100 sec bins |
 |
 |
| Module-wise count rates for Quadrant D Data is divided into 100 sec bins |
 |
 |
| Parameter | Plot |
|---|---|
| CZT HV Monitor | 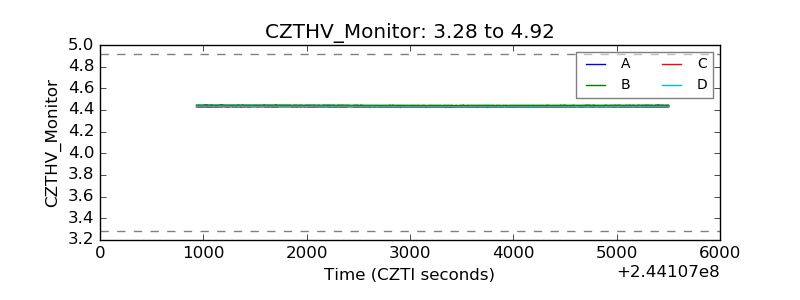 |
| D_VDD | 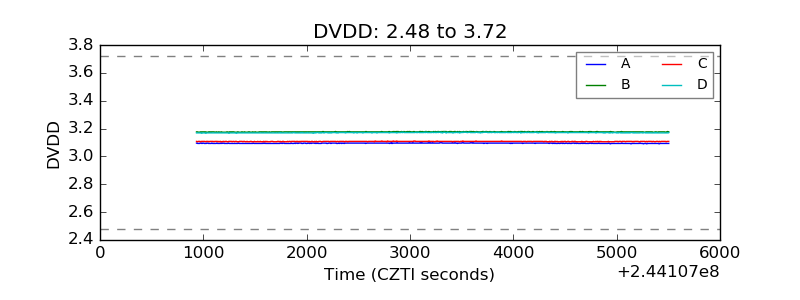 |
| Temperature 1 | 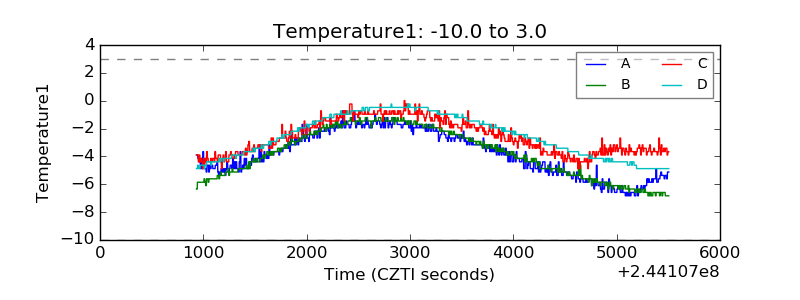 |
| Veto HV Monitor | 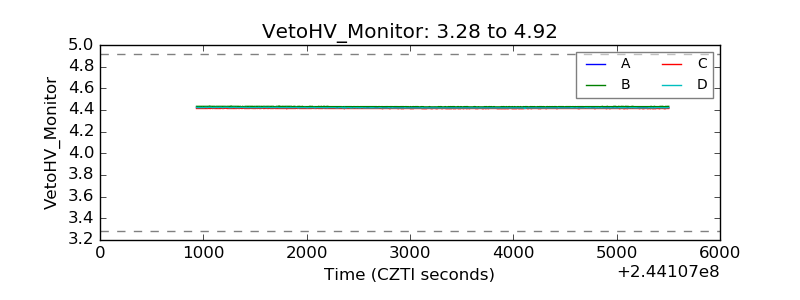 |
| Veto LLD | 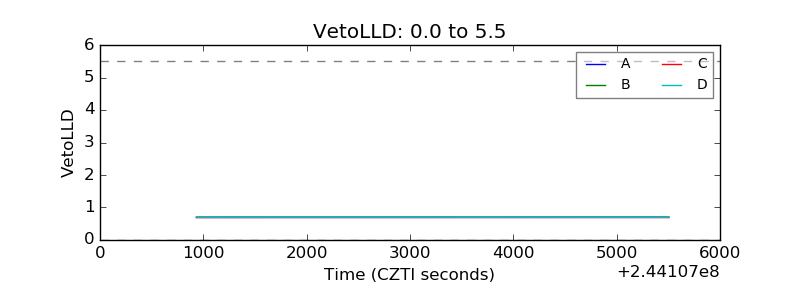 |
| Alpha Counter | 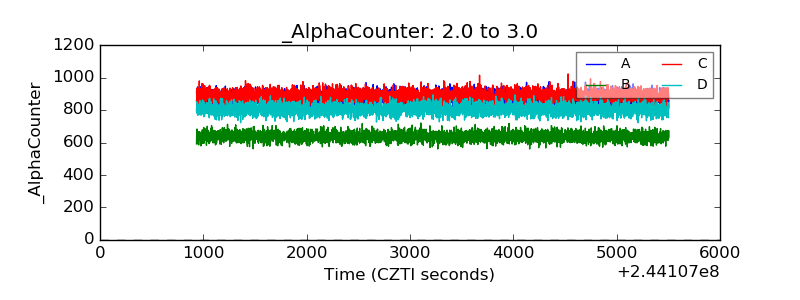 |
| _CPM_Rate | 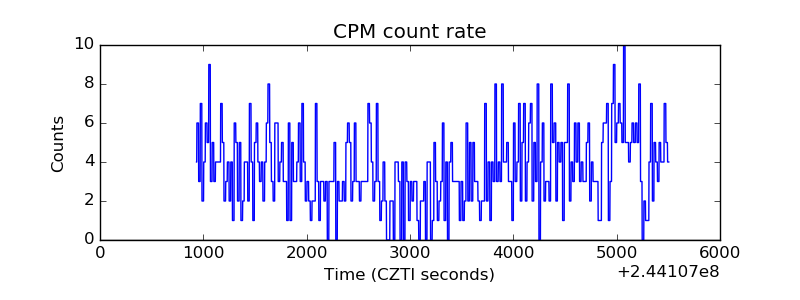 |
| CZT Counter | 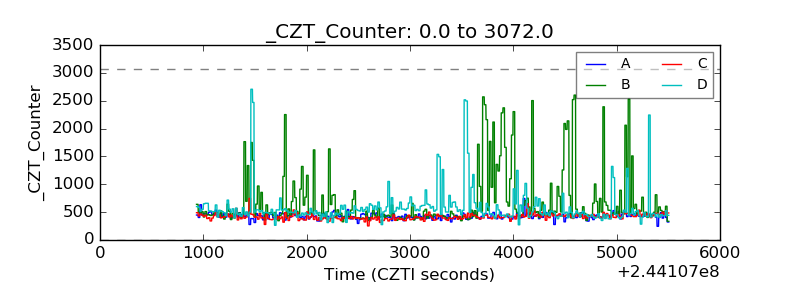 |
| +2.5 Volts monitor |  |
| +5 Volts monitor |  |
| _ROLL_ROT | 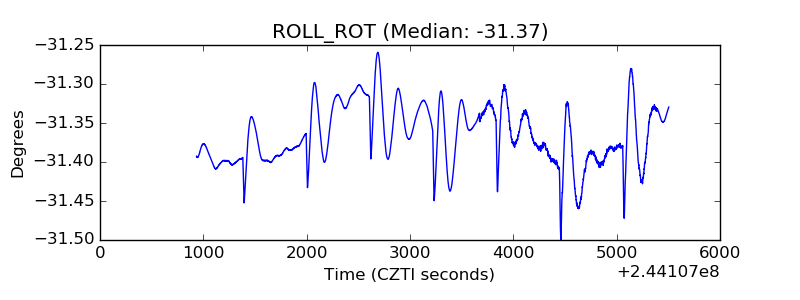 |
| _Roll_DEC | 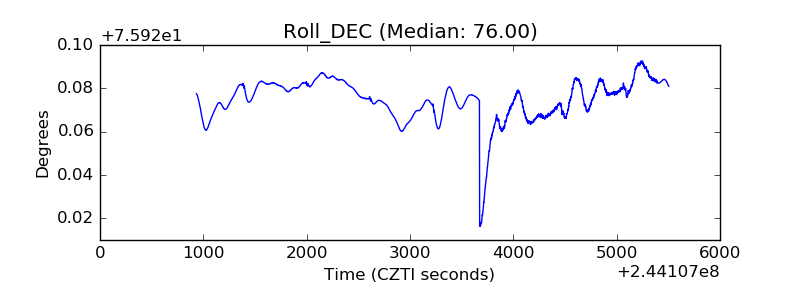 |
| _Roll_RA | 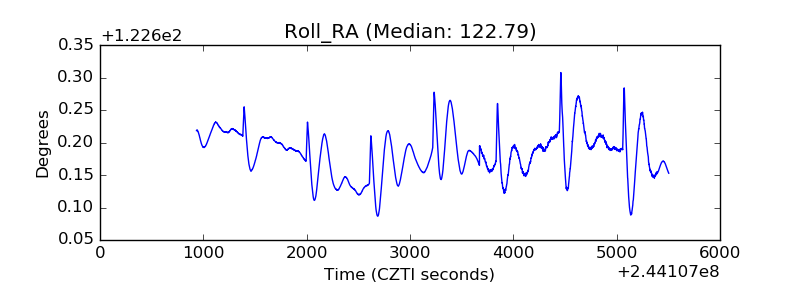 |
| Veto Counter | 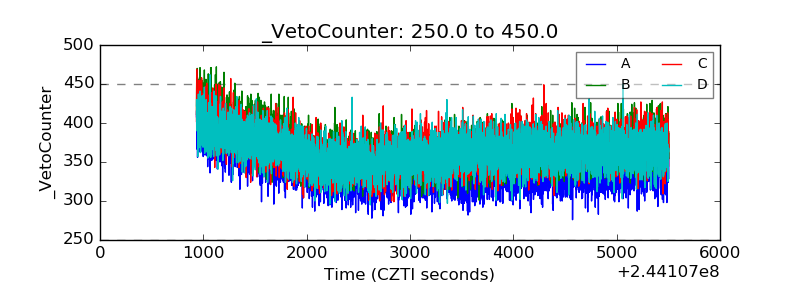 |