| Param | Original file | Final file |
|---|---|---|
| Filename | modeM0/AS1A03_071T01_9000001562cztM0_level2.fits | modeM0/AS1A03_071T01_9000001562cztM0_level2_quad_clean.evt |
| Size (bytes) | 474,747,840 | 449,233,920 |
| Size | 452.8 MB | 428.4 MB |
| Events in quadrant A | 2,852,254 | 2,591,569 |
| Events in quadrant B | 2,674,190 | 2,503,659 |
| Events in quadrant C | 2,929,893 | 2,692,993 |
| Events in quadrant D | 2,503,408 | 2,402,961 |
| Mode M9 | |||
|---|---|---|---|
| Quadrant | BADHDUFLAG | Total packets | Discarded packets |
| A | 0 | 87 | 0 |
| B | 0 | 87 | 0 |
| C | 0 | 87 | 0 |
| D | 0 | 87 | 0 |
| Mode M0 | |||
|---|---|---|---|
| Quadrant | BADHDUFLAG | Total packets | Discarded packets |
| A | 0 | 132994 | 0 |
| B | 0 | 144890 | 0 |
| C | 0 | 103203 | 0 |
| D | 0 | 129430 | 0 |
| Mode SS | |||
|---|---|---|---|
| Quadrant | BADHDUFLAG | Total packets | Discarded packets |
| A | 0 | 1030 | 0 |
| B | 0 | 1048 | 0 |
| C | 0 | 1050 | 0 |
| D | 0 | 1030 | 0 |
| Quadrant | Total seconds | Saturated seconds | Saturation percentage |
|---|---|---|---|
| A | 50172 | 3301 | 6.579367% |
| B | 48756 | 4429 | 9.084010% |
| C | 49684 | 483 | 0.972144% |
| D | 49947 | 1881 | 3.765992% |
Noise dominated data is calculated using 1-second bins in cleaned event files. If a bin has >2000 counts, and if more than 50% of those come from <1% of pixels, then it is considered to be noise-dominated and hence unusable.
| Quadrant | # 1 sec bins | Bins with >0 counts | Bins with >2000 counts | High rate bins dominated by noise | Noise dominated (total time) | Noise dominated (detector-on time) | Marked lightcurve |
|---|---|---|---|---|---|---|---|
| A | 61554 | 51157 | 0 | 0 | 0.00% | 0.00% |  |
| B | 61554 | 49492 | 0 | 0 | 0.00% | 0.00% | 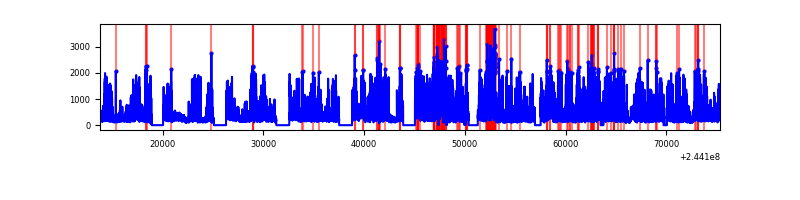 |
| C | 61554 | 50783 | 0 | 0 | 0.00% | 0.00% |  |
| D | 61554 | 51019 | 0 | 0 | 0.00% | 0.00% |  |
Top three noisy pixels from each quadrant. If the there are fewer than three noisy pixels in the level2.evt file, extra rows are filled as -1
| Pixel properties | Quadrant properties | ||||||
|---|---|---|---|---|---|---|---|
| Quadrant | DetID | PixID | Counts | Sigma | Mean | Median | Sigma |
| A | 0 | 29 | 2606 | 10.34 | 742 | 695 | 184.8 |
| A | 7 | 110 | 2325 | 8.82 | 742 | 695 | 184.8 |
| A | 0 | 30 | 2142 | 7.83 | 742 | 695 | 184.8 |
| B | 2 | 9 | 2286 | 11.45 | 705 | 673 | 140.9 |
| B | 5 | 128 | 1796 | 7.97 | 705 | 673 | 140.9 |
| B | 3 | 17 | 1788 | 7.91 | 705 | 673 | 140.9 |
| C | 1 | 80 | 2186 | 7.3 | 773 | 722 | 200.6 |
| C | 1 | 81 | 2109 | 6.91 | 773 | 722 | 200.6 |
| C | 2 | 191 | 1959 | 6.17 | 773 | 722 | 200.6 |
| D | 3 | 14 | 1860 | 6.34 | 714 | 651 | 190.6 |
| D | 6 | 231 | 1826 | 6.17 | 714 | 651 | 190.6 |
| D | 7 | 3 | 1806 | 6.06 | 714 | 651 | 190.6 |
Histogram calculated using DETX and DETY for each event in the final _common_clean file
| Quadrant A |  |
 |
Quadrant B |
|---|---|---|---|
| Quadrant D |  |
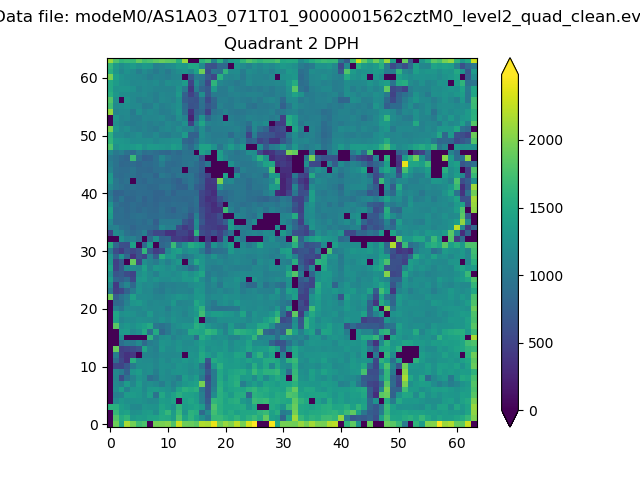 |
Quadrant C |
| Plot type | Count rate plots | Images |
|---|---|---|
| Comparison with Poisson distribution Blue bars denote a histogram of data divided into 1 sec bins. Red curve is a Poisson curve with rate = median count rate of data. |
 |
 |
| Quadrant-wise count rates Data is divided into 100 sec bins |
 |
|
| Module-wise count rates for Quadrant A Data is divided into 100 sec bins |
 |
 |
| Module-wise count rates for Quadrant B Data is divided into 100 sec bins |
 |
 |
| Module-wise count rates for Quadrant C Data is divided into 100 sec bins |
 |
 |
| Module-wise count rates for Quadrant D Data is divided into 100 sec bins |
 |
 |
| Parameter | Plot |
|---|---|
| CZT HV Monitor |  |
| D_VDD |  |
| Temperature 1 |  |
| Veto HV Monitor |  |
| Veto LLD | 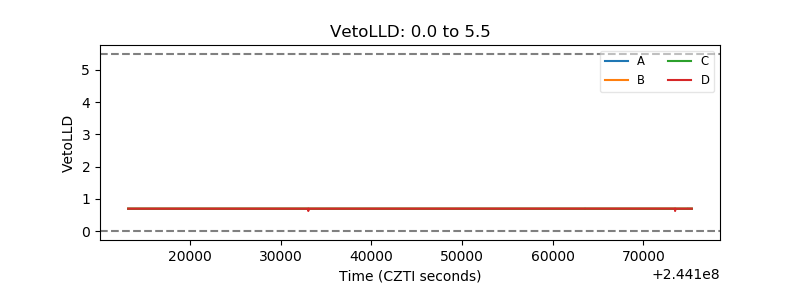 |
| Alpha Counter | 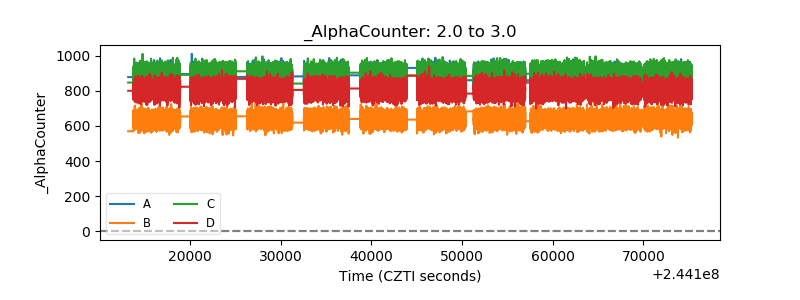 |
| _CPM_Rate |  |
| CZT Counter |  |
| +2.5 Volts monitor |  |
| +5 Volts monitor |  |
| _ROLL_ROT | 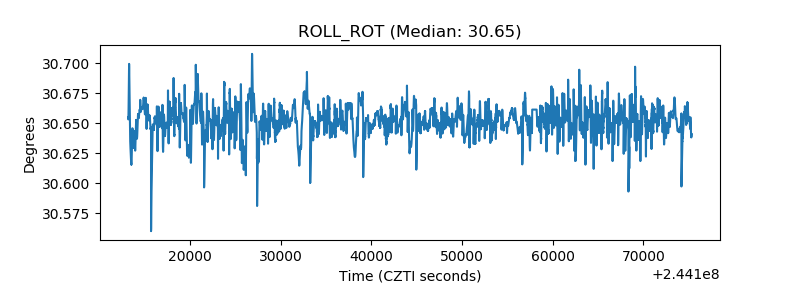 |
| _Roll_DEC | 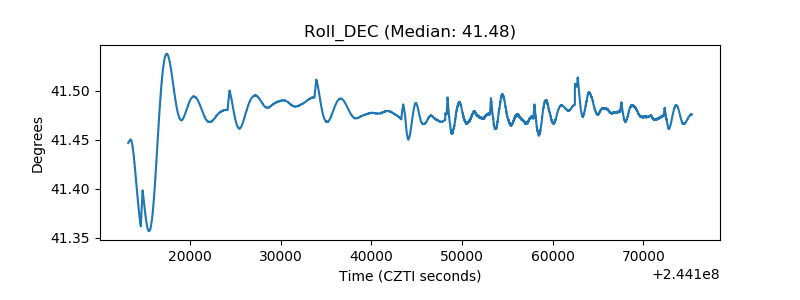 |
| _Roll_RA |  |
| Veto Counter |  |