| Param | Original file | Final file |
|---|---|---|
| Filename | modeM0/AS1A03_071T01_9000001562_10793cztM0_level2.evt | modeM0/AS1A03_071T01_9000001562_10793cztM0_level2_quad_clean.evt |
| Size (bytes) | 106,848,000 | 13,014,720 |
| Size | 101.9 MB | 12.4 MB |
| Events in quadrant A | 714,675 | 72,621 |
| Events in quadrant B | 974,259 | 73,787 |
| Events in quadrant C | 680,515 | 73,844 |
| Events in quadrant D | 770,656 | 70,893 |
| Mode M9 | |||
|---|---|---|---|
| Quadrant | BADHDUFLAG | Total packets | Discarded packets |
| A | 0 | 6 | 0 |
| B | 0 | 6 | 0 |
| C | 0 | 6 | 0 |
| D | 0 | 6 | 0 |
| Mode M0 | |||
|---|---|---|---|
| Quadrant | BADHDUFLAG | Total packets | Discarded packets |
| A | 0 | 2892 | 2 |
| B | 0 | 3772 | 1 |
| C | 0 | 2820 | 1 |
| D | 0 | 3083 | 1 |
| Mode SS | |||
|---|---|---|---|
| Quadrant | BADHDUFLAG | Total packets | Discarded packets |
| A | 0 | 28 | 0 |
| B | 0 | 28 | 0 |
| C | 0 | 28 | 0 |
| D | 0 | 28 | 0 |
| Quadrant | Total seconds | Saturated seconds | Saturation percentage |
|---|---|---|---|
| A | 1366 | 4 | 0.292826% |
| B | 1366 | 76 | 5.563690% |
| C | 1366 | 4 | 0.292826% |
| D | 1366 | 6 | 0.439239% |
Noise dominated data is calculated using 1-second bins in cleaned event files. If a bin has >2000 counts, and if more than 50% of those come from <1% of pixels, then it is considered to be noise-dominated and hence unusable.
| Quadrant | # 1 sec bins | Bins with >0 counts | Bins with >2000 counts | High rate bins dominated by noise | Noise dominated (total time) | Noise dominated (detector-on time) | Marked lightcurve |
|---|---|---|---|---|---|---|---|
| A | 1366 | 1366 | 0 | 0 | 0.00% | 0.00% | 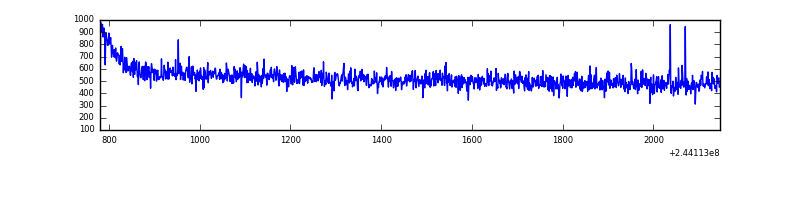 |
| B | 1366 | 1366 | 39 | 39 | 2.86% | 2.86% | 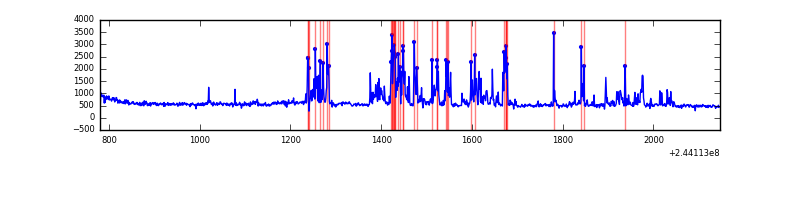 |
| C | 1366 | 1366 | 0 | 0 | 0.00% | 0.00% | 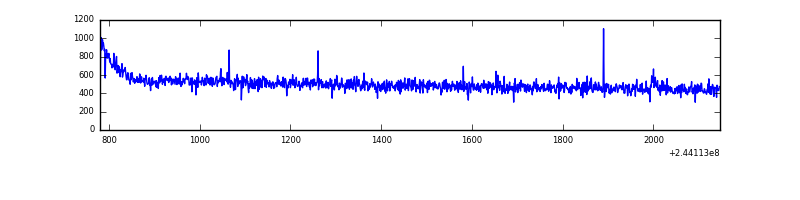 |
| D | 1366 | 1366 | 2 | 2 | 0.15% | 0.15% |  |
Top three noisy pixels from each quadrant. If the there are fewer than three noisy pixels in the level2.evt file, extra rows are filled as -1
| Pixel properties | Quadrant properties | ||||||
|---|---|---|---|---|---|---|---|
| Quadrant | DetID | PixID | Counts | Sigma | Mean | Median | Sigma |
| A | 8 | 15 | 3547 | 86.3 | 184 | 181 | 39.0 |
| A | 0 | 226 | 1724 | 39.56 | 184 | 181 | 39.0 |
| A | 12 | 194 | 1485 | 33.43 | 184 | 181 | 39.0 |
| B | 4 | 239 | 218706 | 6061.09 | 179 | 175 | 36.1 |
| B | 0 | 187 | 36588 | 1009.94 | 179 | 175 | 36.1 |
| B | 0 | 219 | 12681 | 346.86 | 179 | 175 | 36.1 |
| C | 14 | 234 | 2123 | 47.21 | 173 | 174 | 41.3 |
| C | 12 | 4 | 1850 | 40.59 | 173 | 174 | 41.3 |
| C | 13 | 61 | 1286 | 26.93 | 173 | 174 | 41.3 |
| D | 8 | 195 | 58328 | 1335.39 | 175 | 170 | 43.6 |
| D | 12 | 233 | 17966 | 408.62 | 175 | 170 | 43.6 |
| D | 1 | 52 | 15057 | 341.83 | 175 | 170 | 43.6 |
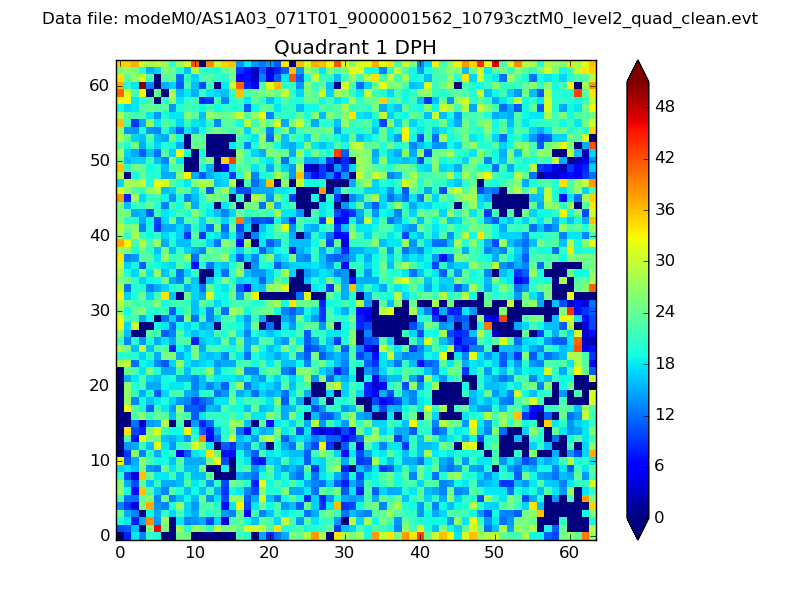
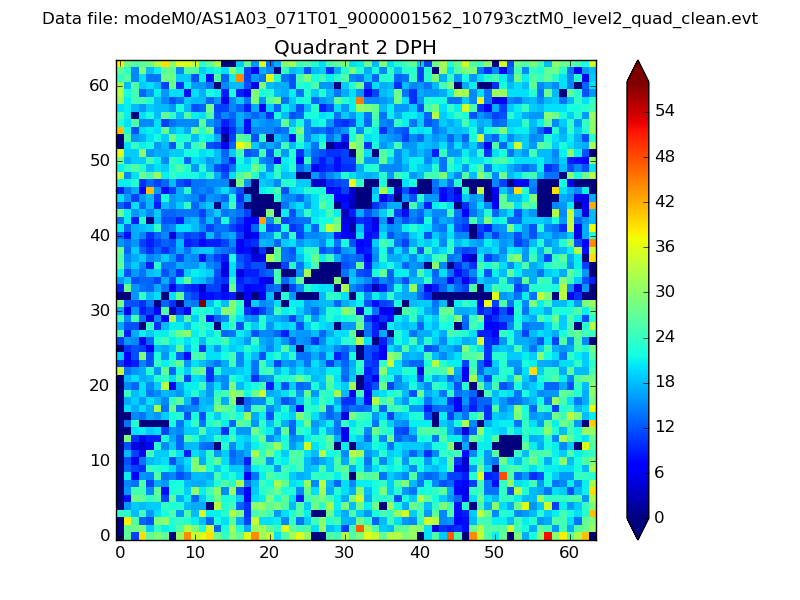
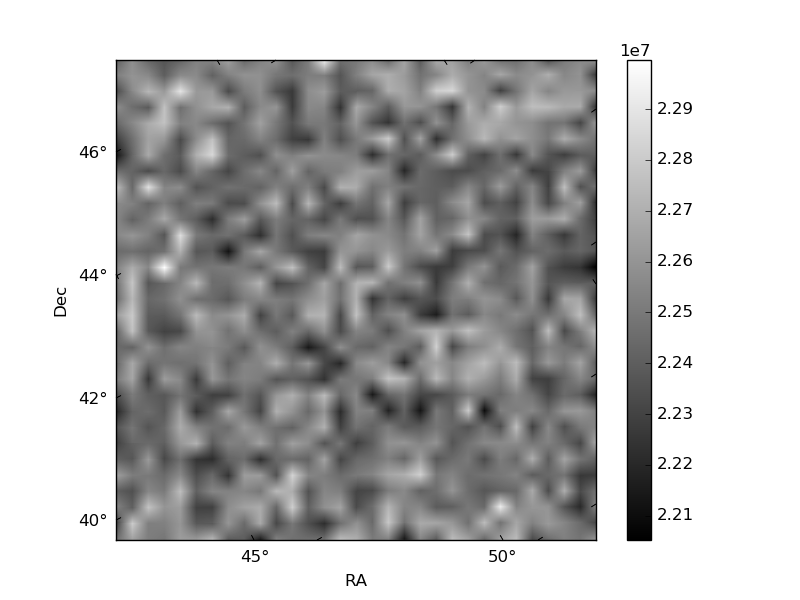
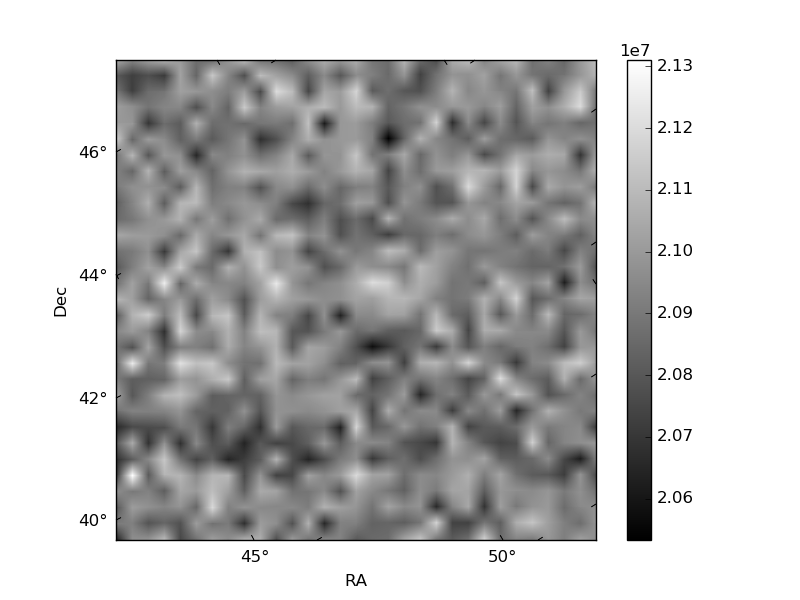
Histogram calculated using DETX and DETY for each event in the final _common_clean file
| Quadrant A | 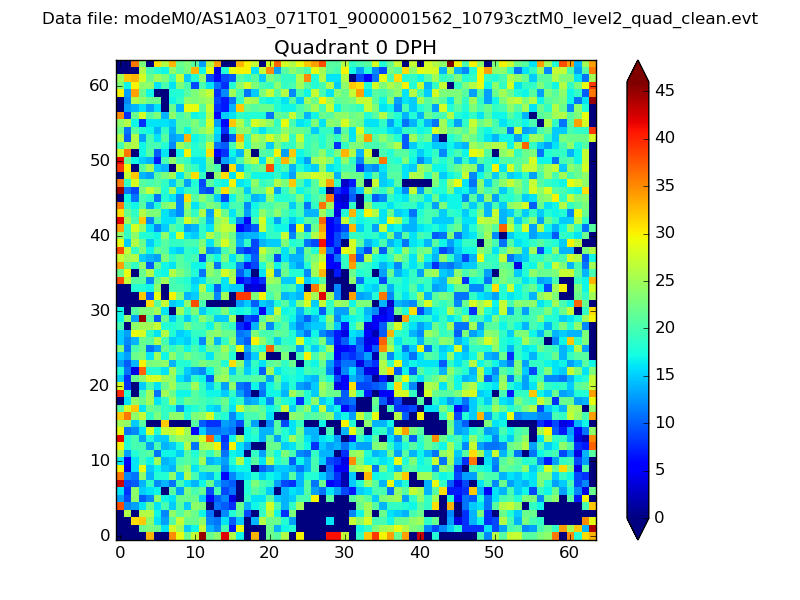 |
 |
Quadrant B |
|---|---|---|---|
| Quadrant D | 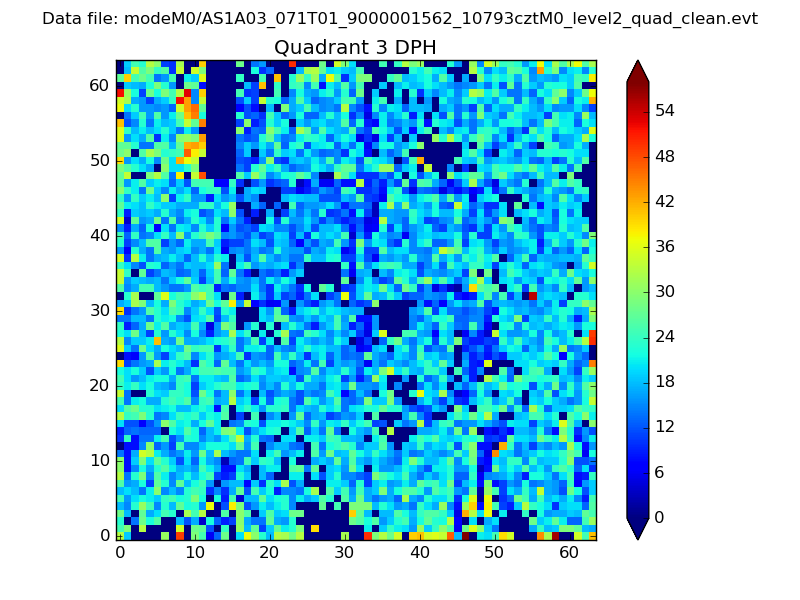 |
 |
Quadrant C |
| Plot type | Count rate plots | Images |
|---|---|---|
| Comparison with Poisson distribution Blue bars denote a histogram of data divided into 1 sec bins. Red curve is a Poisson curve with rate = median count rate of data. |
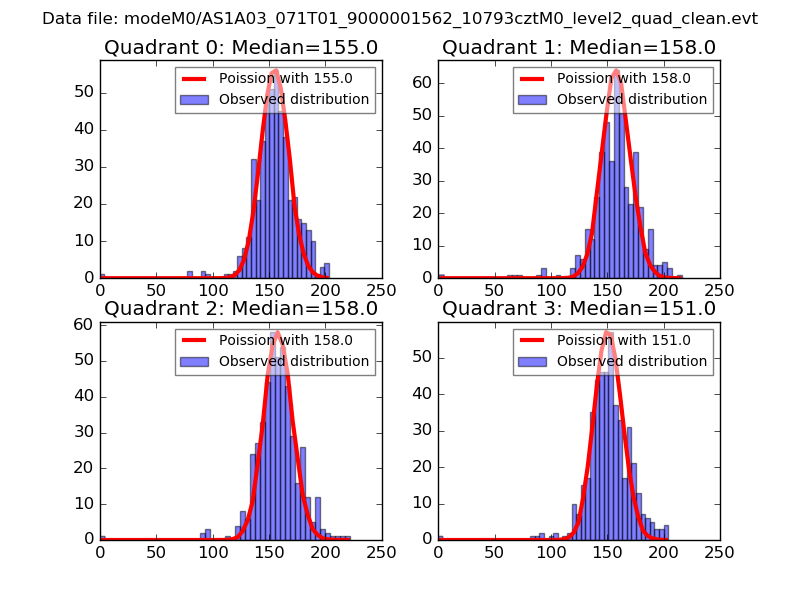 |
 |
| Quadrant-wise count rates Data is divided into 100 sec bins |
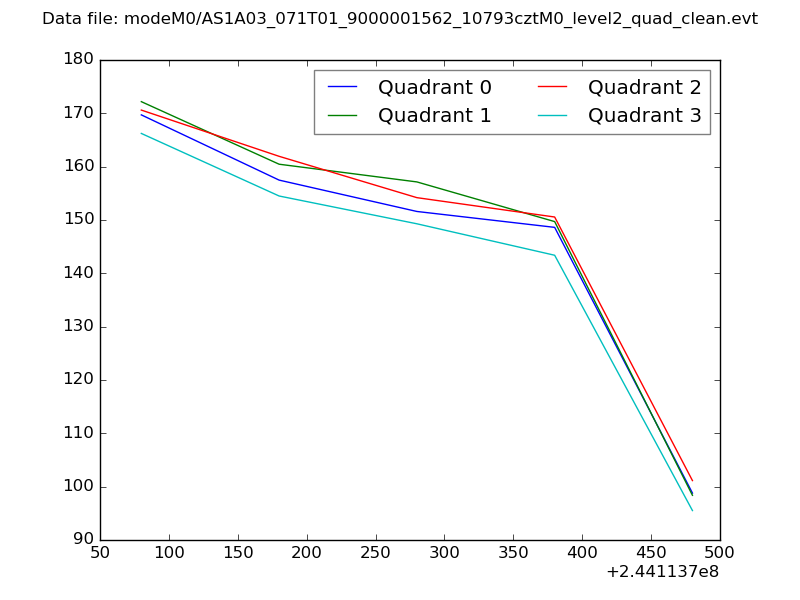 |
|
| Module-wise count rates for Quadrant A Data is divided into 100 sec bins |
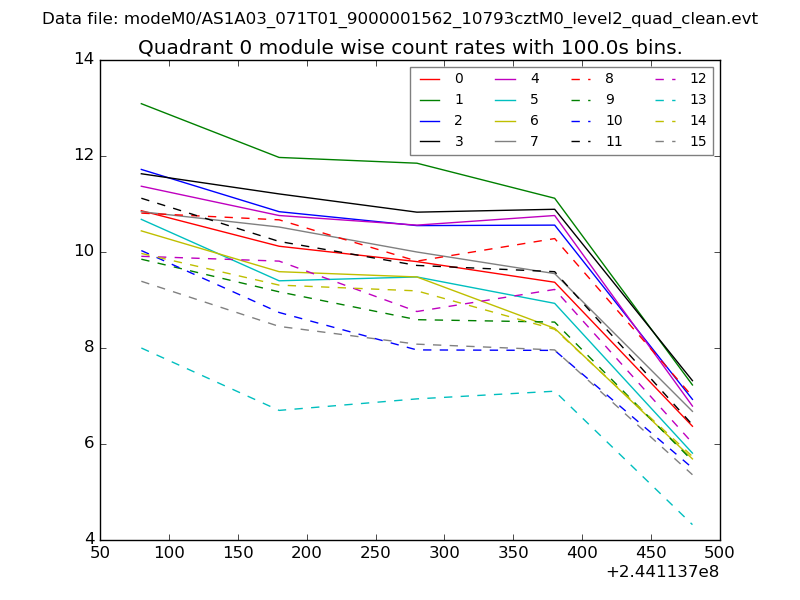 |
 |
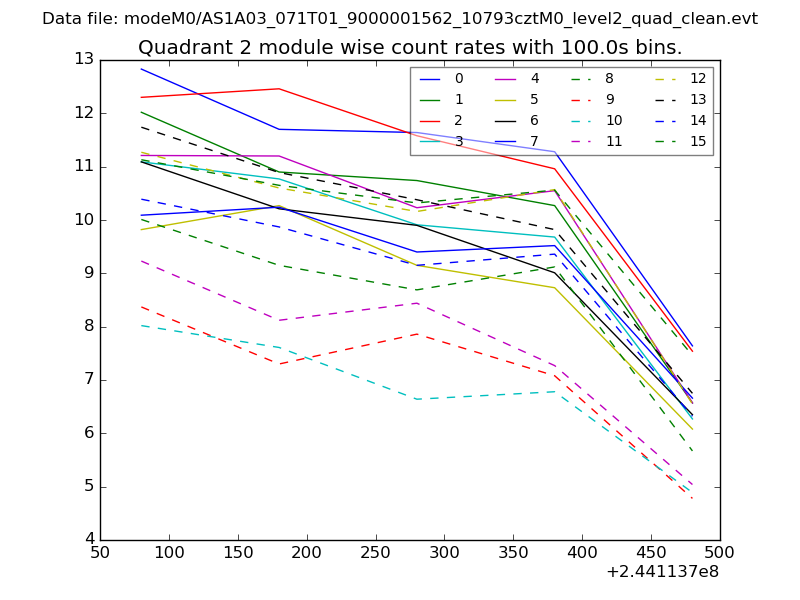
| Module-wise count rates for Quadrant B Data is divided into 100 sec bins |
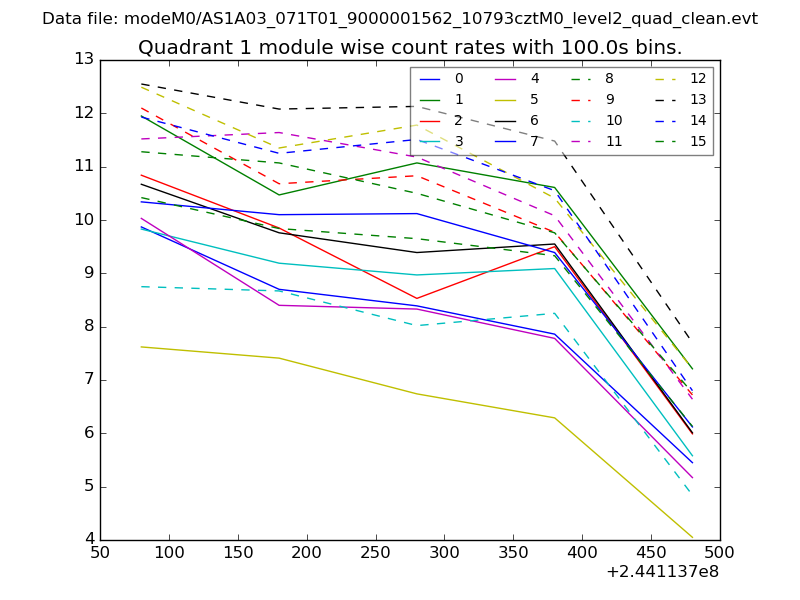 |
 |
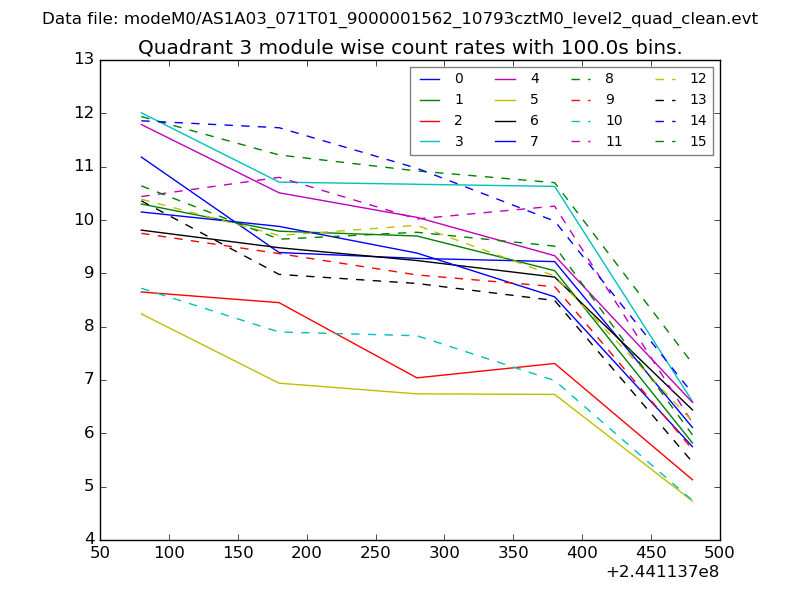
| Module-wise count rates for Quadrant C Data is divided into 100 sec bins |
 |
 |
| Module-wise count rates for Quadrant D Data is divided into 100 sec bins |
 |
 |
| Parameter | Plot |
|---|---|
| CZT HV Monitor | 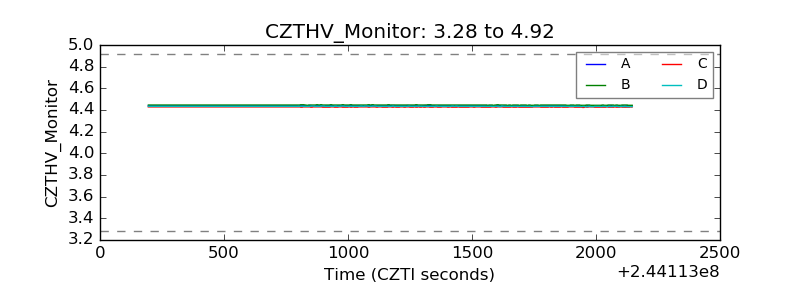 |
| D_VDD |  |
| Temperature 1 | 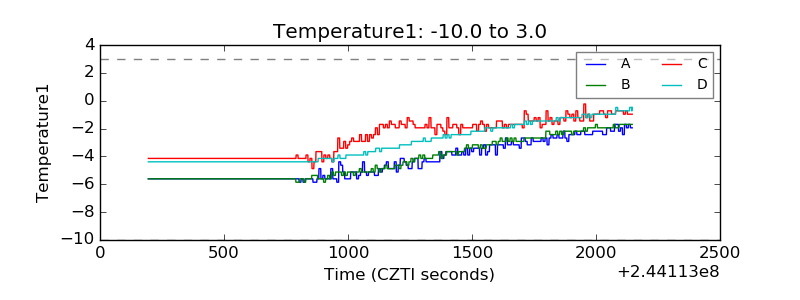 |
| Veto HV Monitor | 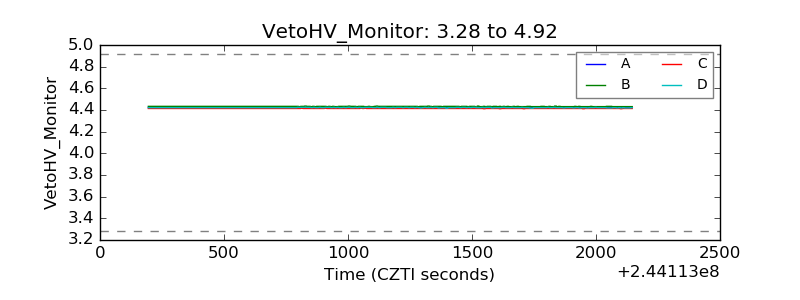 |
| Veto LLD | 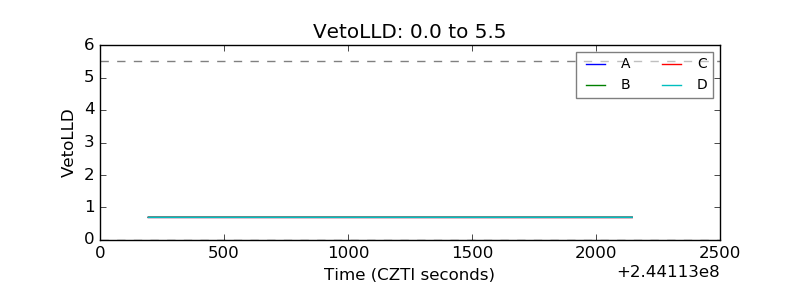 |
| Alpha Counter | 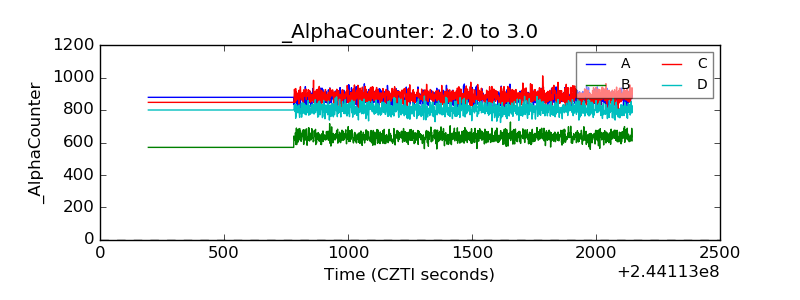 |
| _CPM_Rate | 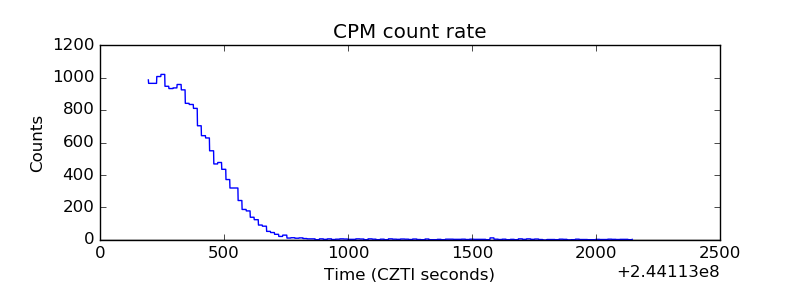 |
| CZT Counter | 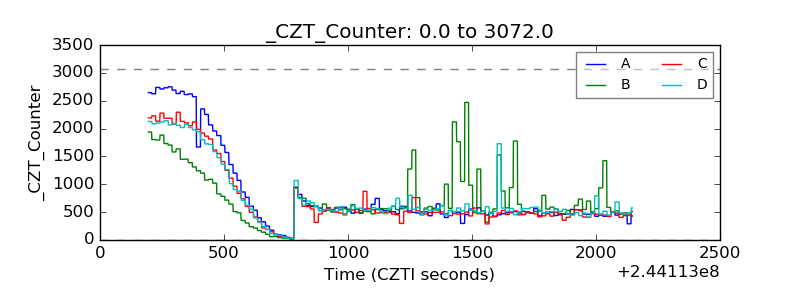 |
| +2.5 Volts monitor |  |
| +5 Volts monitor |  |
| _ROLL_ROT | 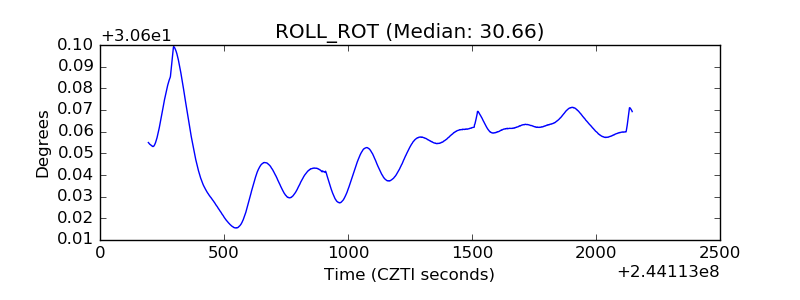 |
| _Roll_DEC | 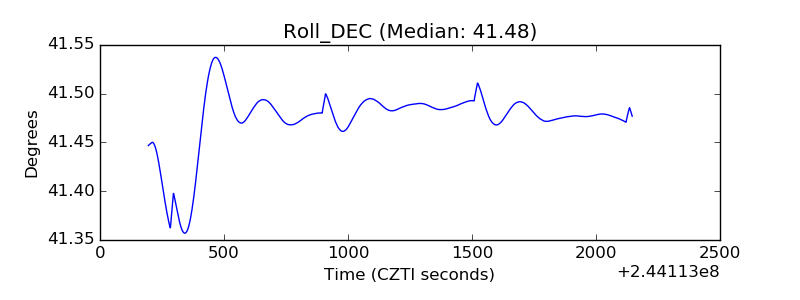 |
| _Roll_RA | 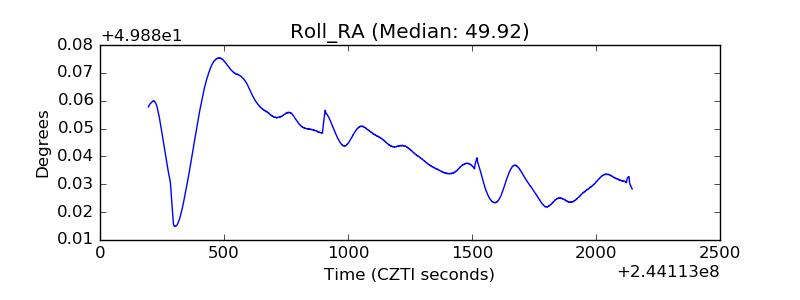 |
| Veto Counter | 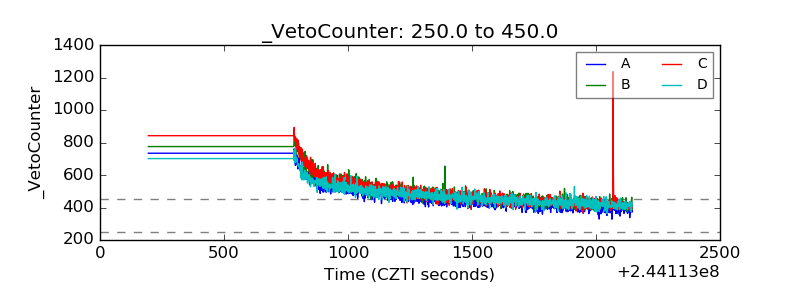 |