| Param | Original file | Final file |
|---|---|---|
| Filename | modeM0/AS1A03_071T01_9000001562_10795cztM0_level2.evt | modeM0/AS1A03_071T01_9000001562_10795cztM0_level2_quad_clean.evt |
| Size (bytes) | 508,144,320 | 67,956,480 |
| Size | 484.6 MB | 64.8 MB |
| Events in quadrant A | 3,242,964 | 402,273 |
| Events in quadrant B | 4,375,520 | 402,361 |
| Events in quadrant C | 3,115,199 | 409,338 |
| Events in quadrant D | 4,211,490 | 387,003 |
| Mode M9 | |||
|---|---|---|---|
| Quadrant | BADHDUFLAG | Total packets | Discarded packets |
| A | 0 | 17 | 0 |
| B | 0 | 17 | 0 |
| C | 0 | 17 | 0 |
| D | 0 | 17 | 0 |
| Mode M0 | |||
|---|---|---|---|
| Quadrant | BADHDUFLAG | Total packets | Discarded packets |
| A | 0 | 13849 | 3 |
| B | 0 | 17347 | 2 |
| C | 0 | 13508 | 2 |
| D | 0 | 16814 | 2 |
| Mode SS | |||
|---|---|---|---|
| Quadrant | BADHDUFLAG | Total packets | Discarded packets |
| A | 0 | 134 | 0 |
| B | 0 | 134 | 0 |
| C | 0 | 134 | 0 |
| D | 0 | 134 | 0 |
| Quadrant | Total seconds | Saturated seconds | Saturation percentage |
|---|---|---|---|
| A | 6540 | 84 | 1.284404% |
| B | 6540 | 339 | 5.183486% |
| C | 6540 | 67 | 1.024465% |
| D | 6540 | 169 | 2.584098% |
Noise dominated data is calculated using 1-second bins in cleaned event files. If a bin has >2000 counts, and if more than 50% of those come from <1% of pixels, then it is considered to be noise-dominated and hence unusable.
| Quadrant | # 1 sec bins | Bins with >0 counts | Bins with >2000 counts | High rate bins dominated by noise | Noise dominated (total time) | Noise dominated (detector-on time) | Marked lightcurve |
|---|---|---|---|---|---|---|---|
| A | 7665 | 6540 | 2 | 2 | 0.03% | 0.03% | 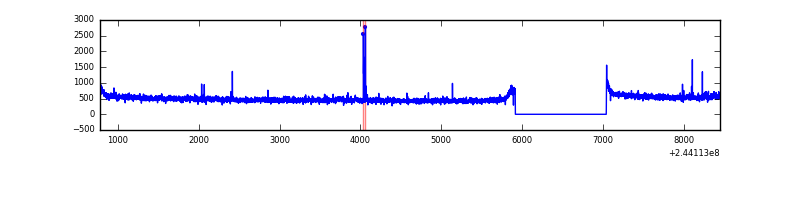 |
| B | 7665 | 6540 | 147 | 147 | 1.92% | 2.25% | 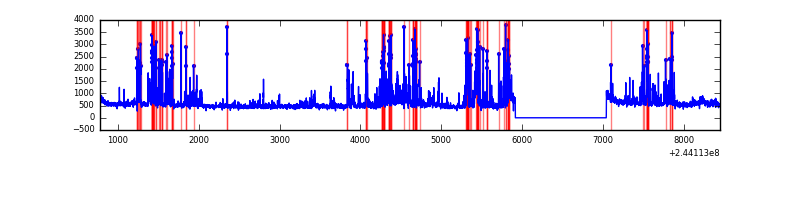 |
| C | 7665 | 6541 | 1 | 1 | 0.01% | 0.02% | 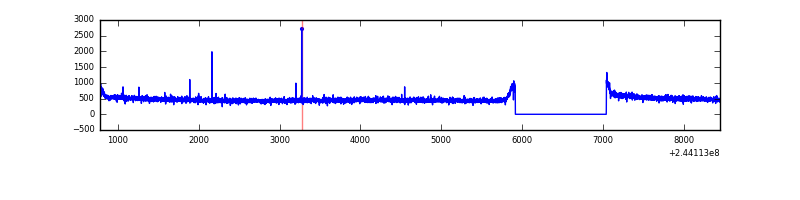 |
| D | 7665 | 6540 | 80 | 80 | 1.04% | 1.22% | 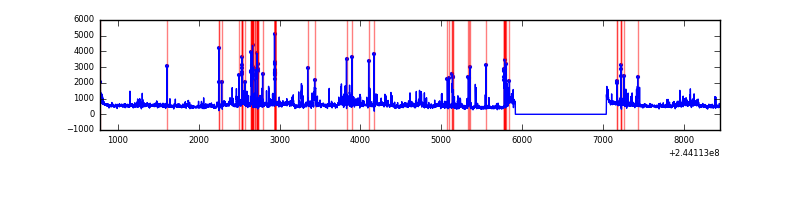 |
Top three noisy pixels from each quadrant. If the there are fewer than three noisy pixels in the level2.evt file, extra rows are filled as -1
| Pixel properties | Quadrant properties | ||||||
|---|---|---|---|---|---|---|---|
| Quadrant | DetID | PixID | Counts | Sigma | Mean | Median | Sigma |
| A | 8 | 15 | 26273 | 154.38 | 824 | 808 | 164.9 |
| A | 13 | 248 | 17987 | 104.15 | 824 | 808 | 164.9 |
| A | 15 | 174 | 10551 | 59.06 | 824 | 808 | 164.9 |
| B | 4 | 239 | 979459 | 6426.51 | 810 | 792 | 152.3 |
| B | 0 | 219 | 111379 | 726.18 | 810 | 792 | 152.3 |
| B | 0 | 214 | 41351 | 266.33 | 810 | 792 | 152.3 |
| C | 14 | 234 | 9463 | 47.65 | 794 | 799 | 181.8 |
| C | 13 | 61 | 5905 | 28.08 | 794 | 799 | 181.8 |
| C | 8 | 222 | 3139 | 12.87 | 794 | 799 | 181.8 |
| D | 8 | 195 | 415374 | 2197.78 | 789 | 767 | 188.6 |
| D | 13 | 138 | 263825 | 1394.44 | 789 | 767 | 188.6 |
| D | 10 | 253 | 183193 | 967.02 | 789 | 767 | 188.6 |
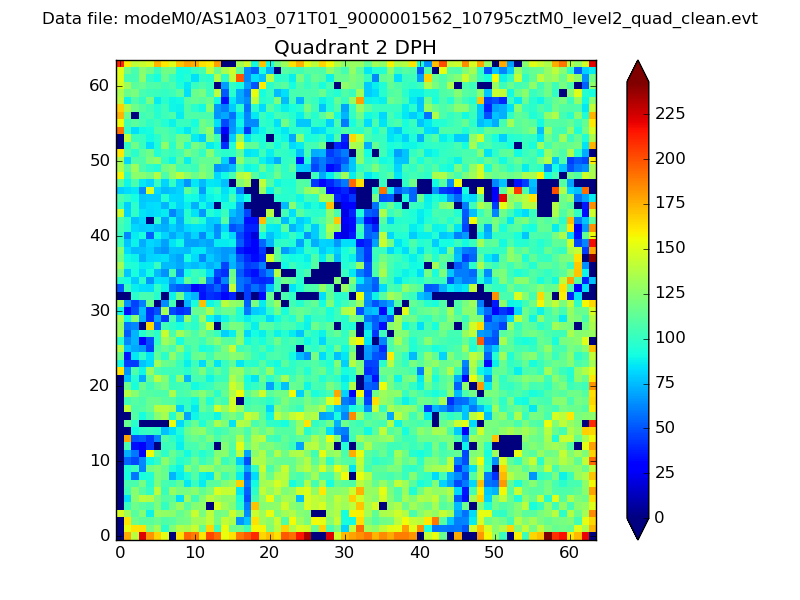
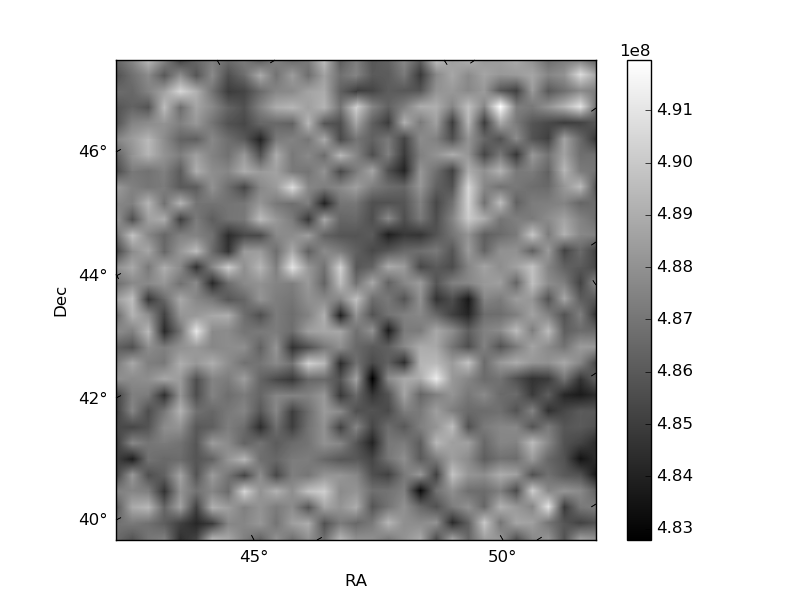
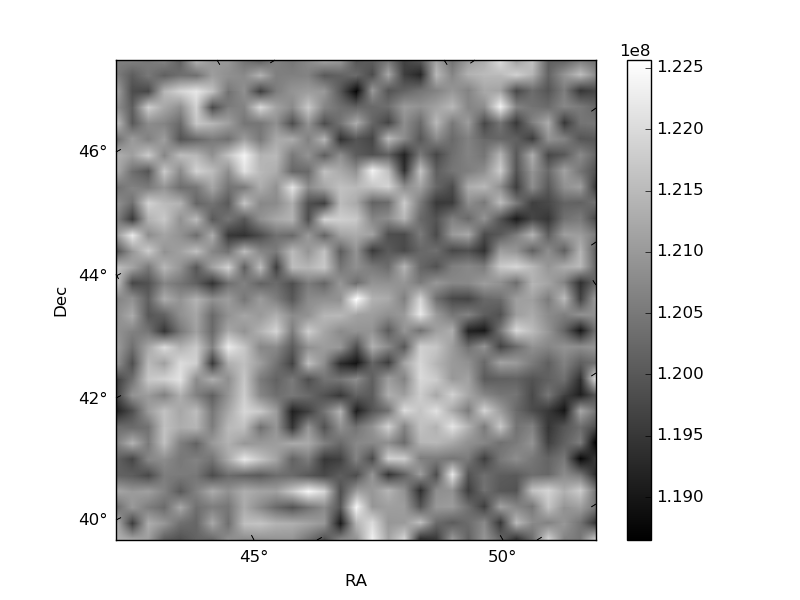
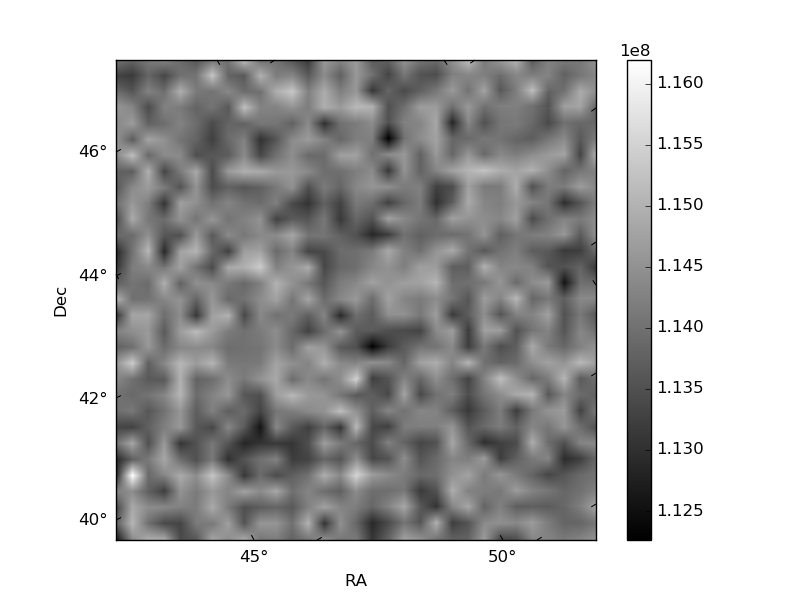
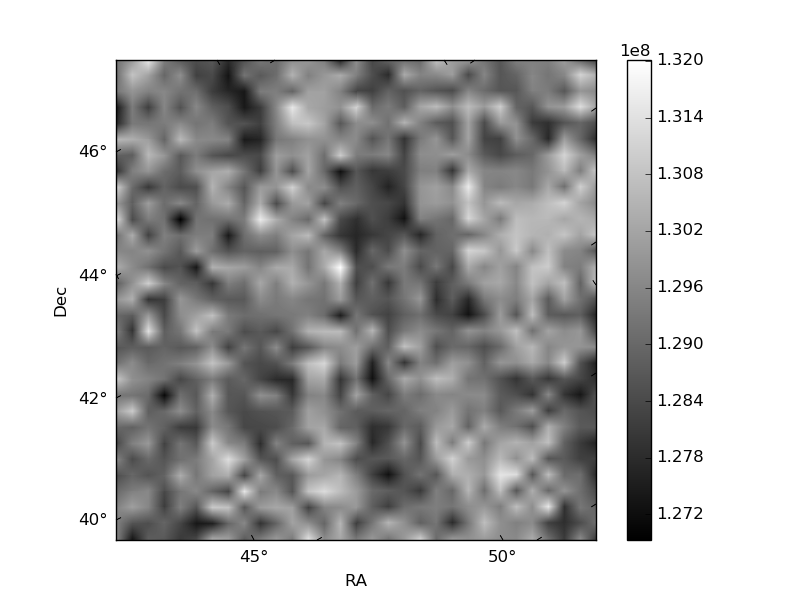
Histogram calculated using DETX and DETY for each event in the final _common_clean file
| Quadrant A | 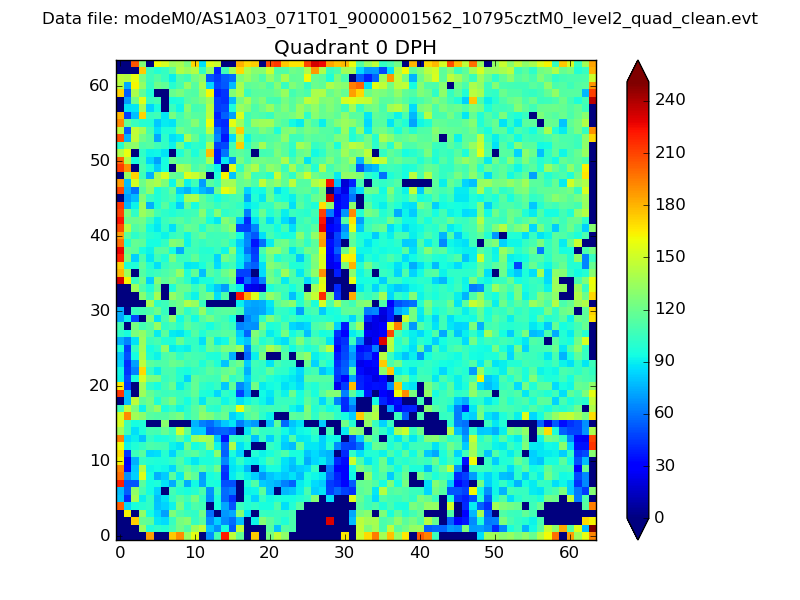 |
 |
Quadrant B |
|---|---|---|---|
| Quadrant D | 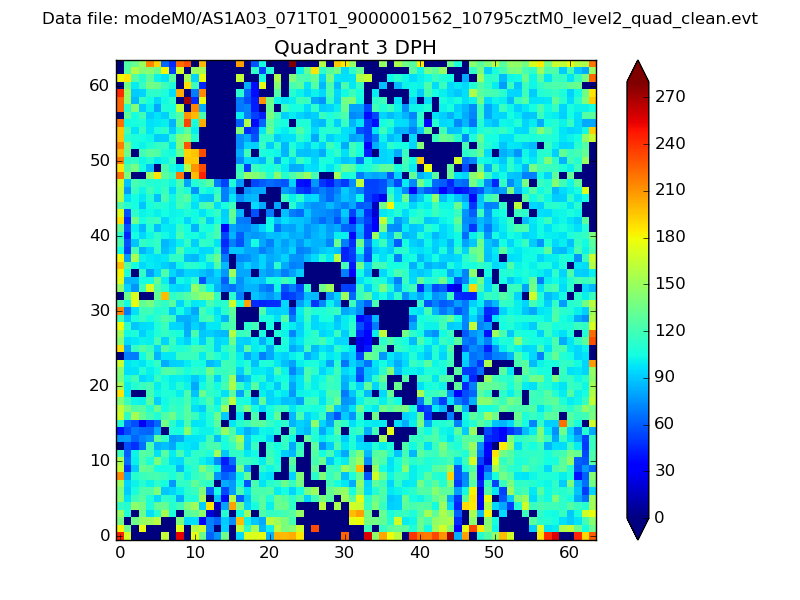 |
 |
Quadrant C |
| Plot type | Count rate plots | Images |
|---|---|---|
| Comparison with Poisson distribution Blue bars denote a histogram of data divided into 1 sec bins. Red curve is a Poisson curve with rate = median count rate of data. |
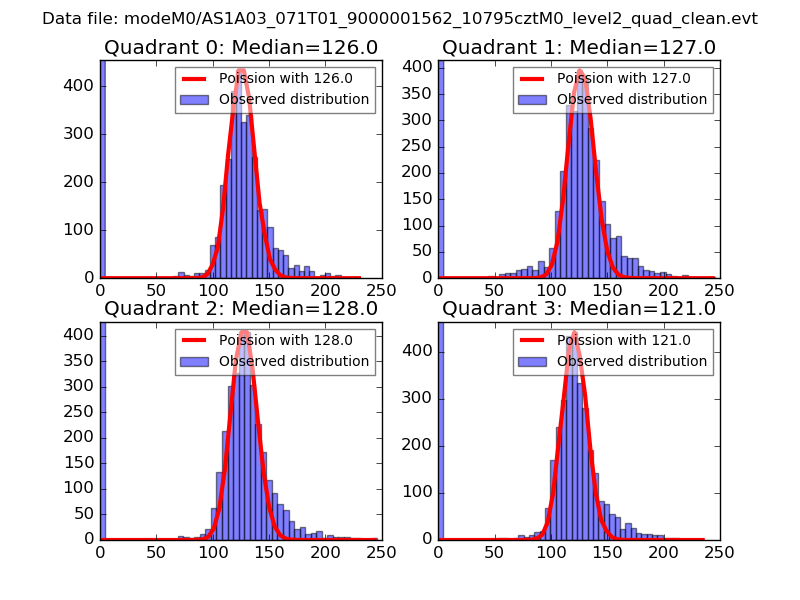 |
 |
| Quadrant-wise count rates Data is divided into 100 sec bins |
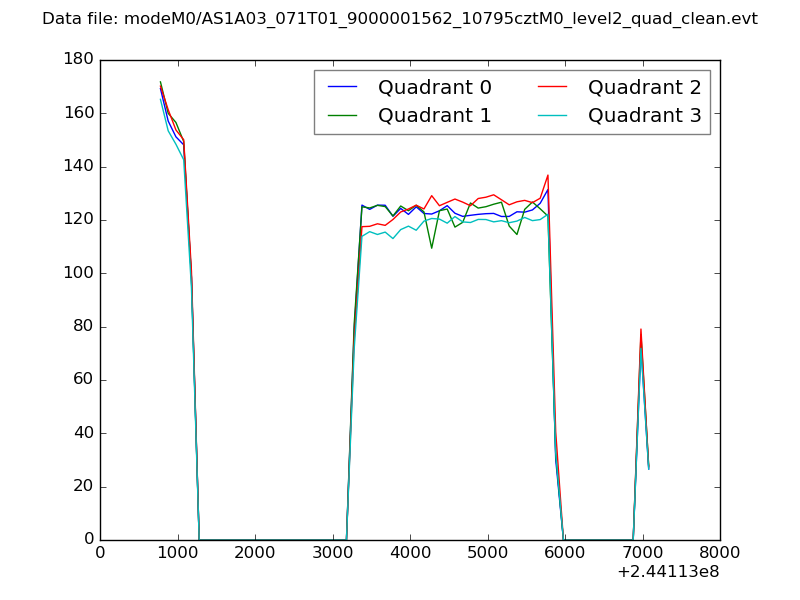 |
|
| Module-wise count rates for Quadrant A Data is divided into 100 sec bins |
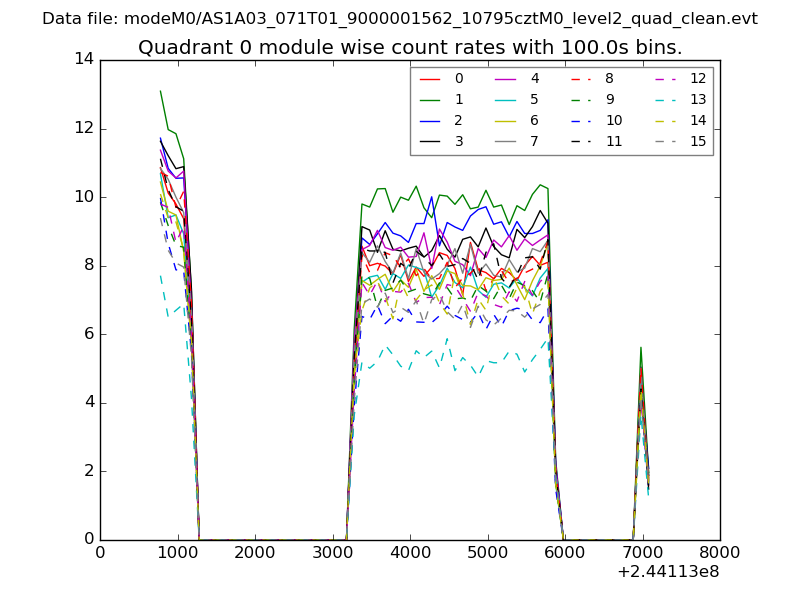 |
 |
| Module-wise count rates for Quadrant B Data is divided into 100 sec bins |
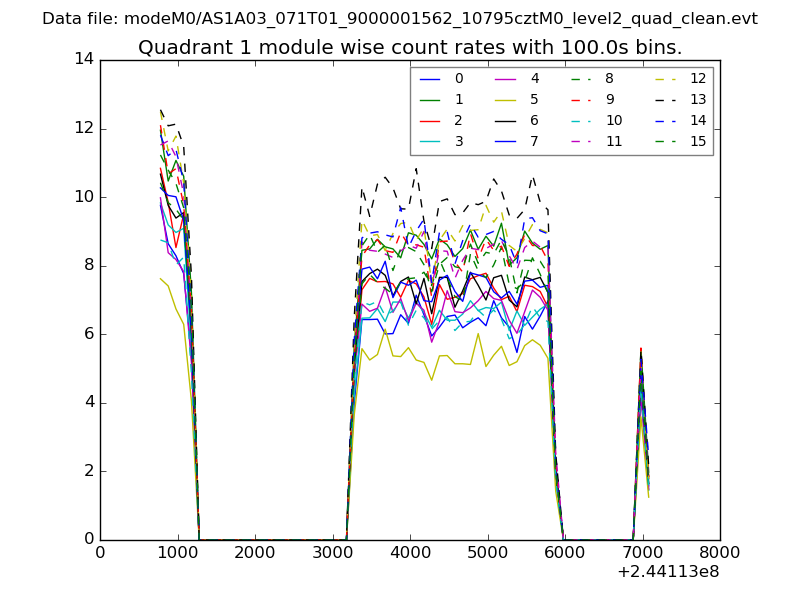 |
 |
| Module-wise count rates for Quadrant C Data is divided into 100 sec bins |
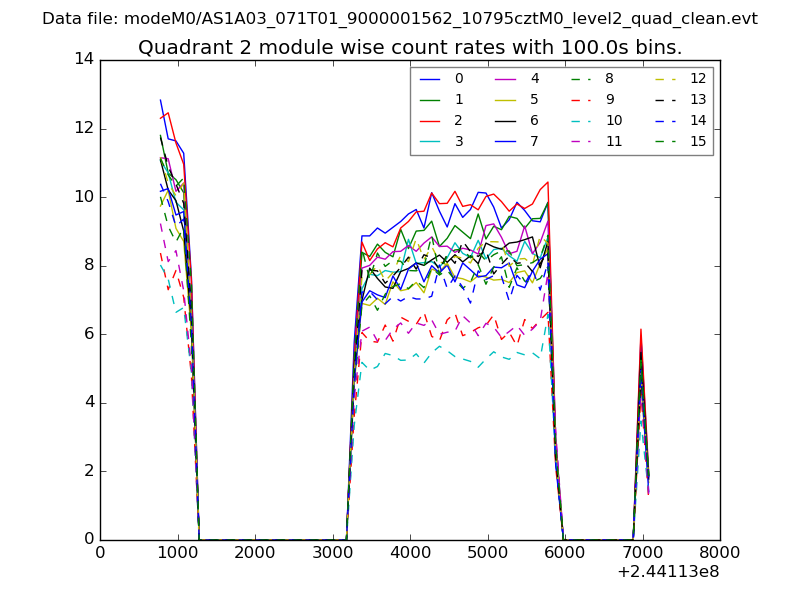 |
 |
| Module-wise count rates for Quadrant D Data is divided into 100 sec bins |
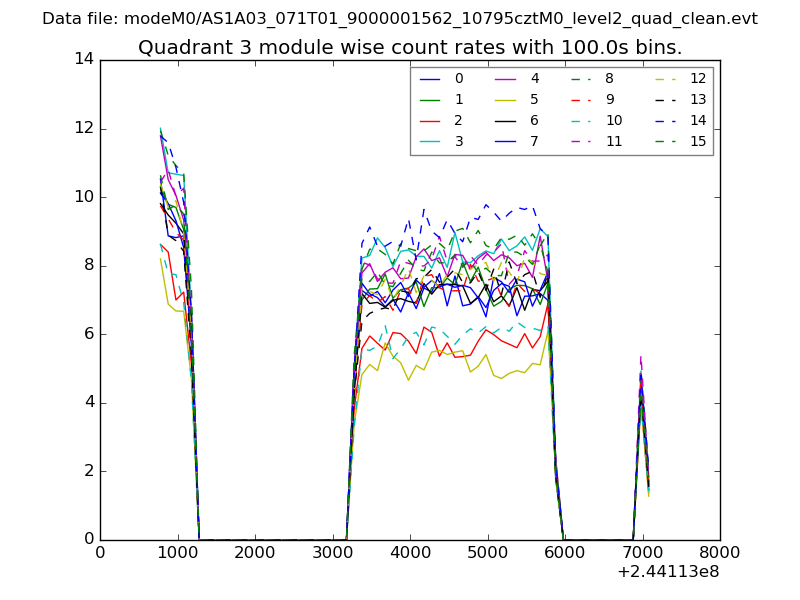 |
 |
| Parameter | Plot |
|---|---|
| CZT HV Monitor | 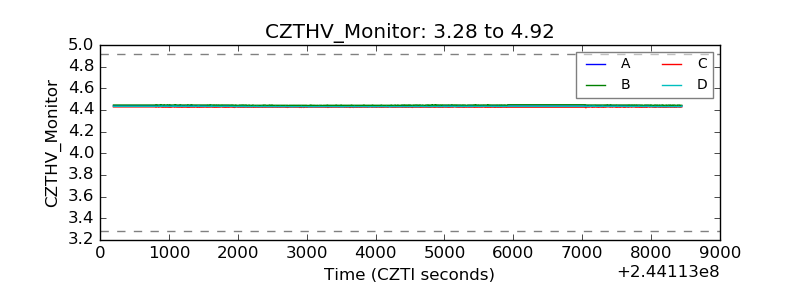 |
| D_VDD | 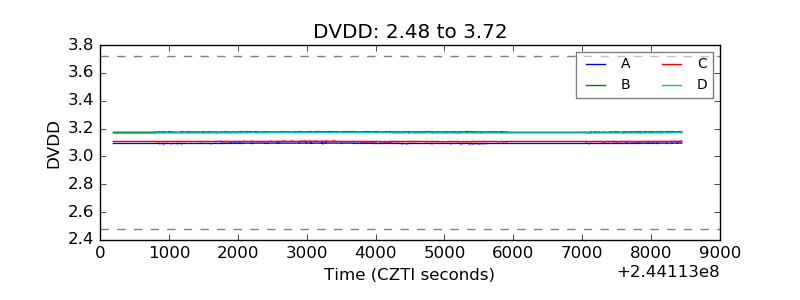 |
| Temperature 1 | 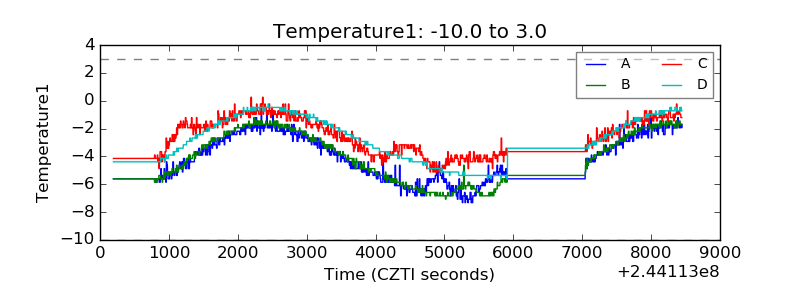 |
| Veto HV Monitor | 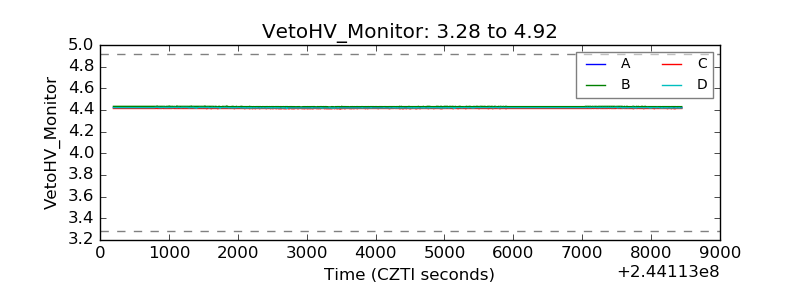 |
| Veto LLD | 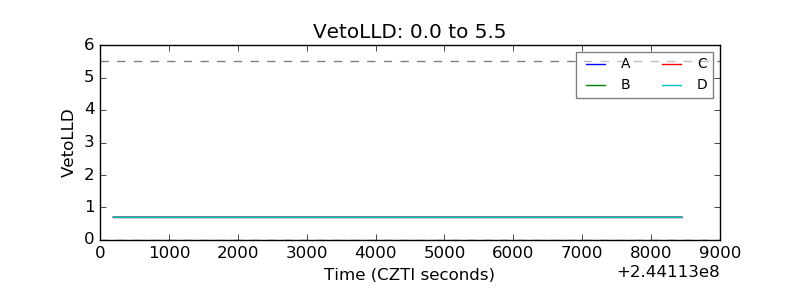 |
| Alpha Counter | 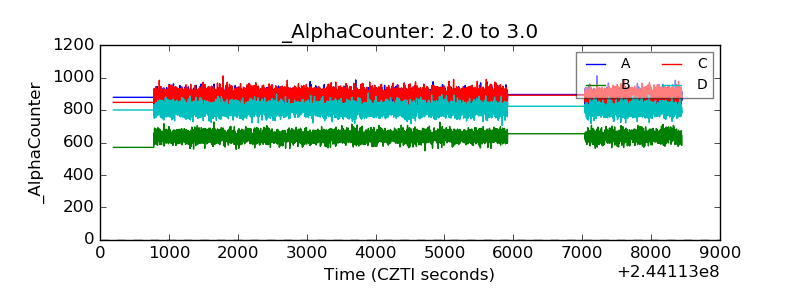 |
| _CPM_Rate | 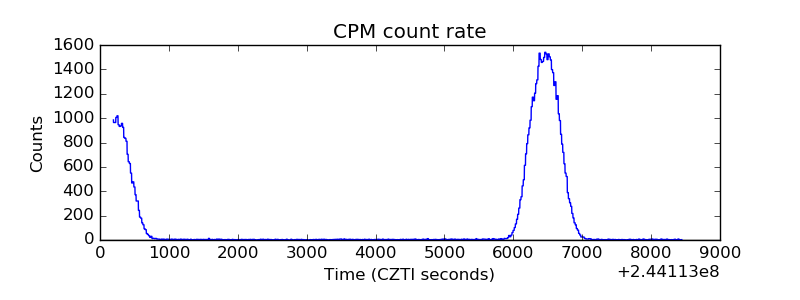 |
| CZT Counter | 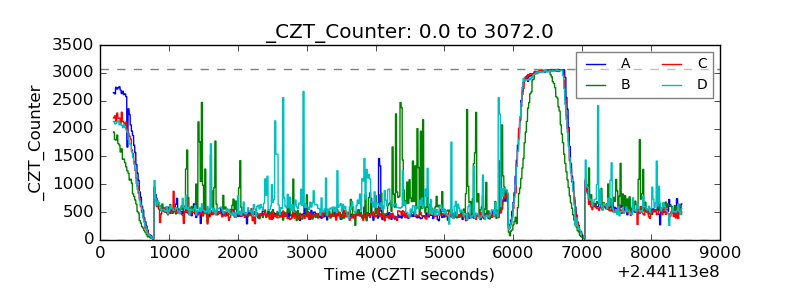 |
| +2.5 Volts monitor |  |
| +5 Volts monitor |  |
| _ROLL_ROT | 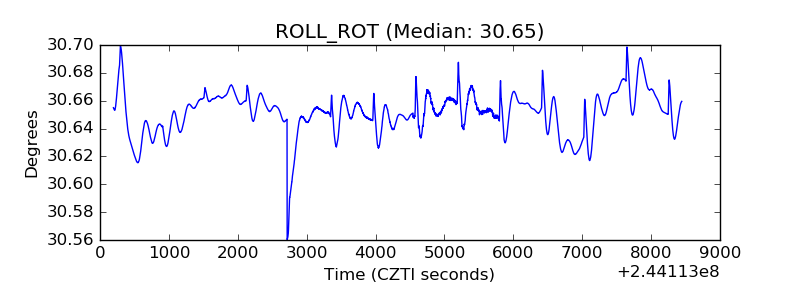 |
| _Roll_DEC | 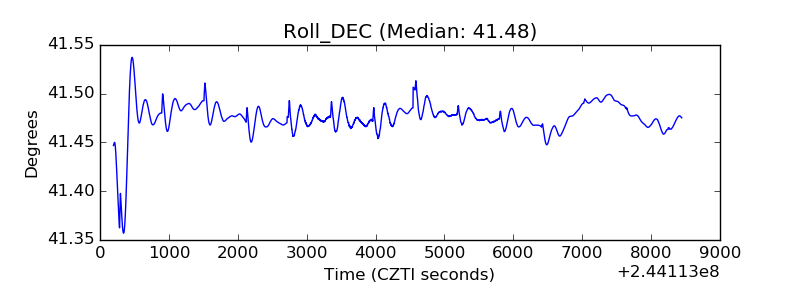 |
| _Roll_RA | 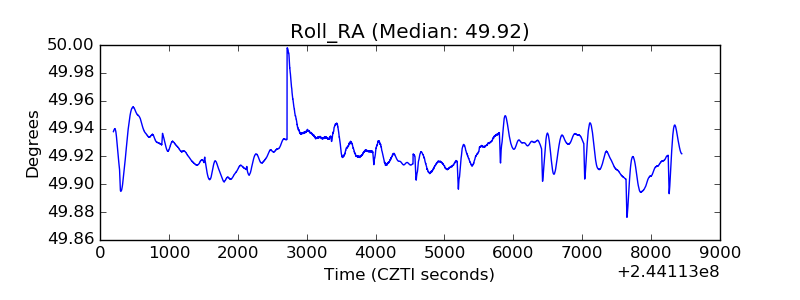 |
| Veto Counter | 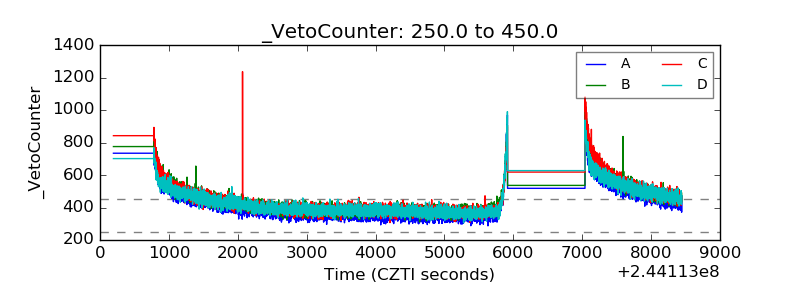 |