| Param | Original file | Final file |
|---|---|---|
| Filename | modeM0/AS1A03_071T01_9000001562_10796cztM0_level2.evt | modeM0/AS1A03_071T01_9000001562_10796cztM0_level2_quad_clean.evt |
| Size (bytes) | 513,967,680 | 65,724,480 |
| Size | 490.2 MB | 62.7 MB |
| Events in quadrant A | 3,435,073 | 384,278 |
| Events in quadrant B | 4,413,364 | 385,539 |
| Events in quadrant C | 3,257,564 | 391,777 |
| Events in quadrant D | 4,015,142 | 371,355 |
| Mode M9 | |||
|---|---|---|---|
| Quadrant | BADHDUFLAG | Total packets | Discarded packets |
| A | 0 | 17 | 0 |
| B | 0 | 17 | 0 |
| C | 0 | 17 | 0 |
| D | 0 | 18 | 0 |
| Mode M0 | |||
|---|---|---|---|
| Quadrant | BADHDUFLAG | Total packets | Discarded packets |
| A | 0 | 14393 | 3 |
| B | 0 | 17446 | 2 |
| C | 0 | 13807 | 2 |
| D | 0 | 16220 | 2 |
| Mode SS | |||
|---|---|---|---|
| Quadrant | BADHDUFLAG | Total packets | Discarded packets |
| A | 0 | 132 | 0 |
| B | 0 | 132 | 0 |
| C | 0 | 132 | 0 |
| D | 0 | 132 | 0 |
| Quadrant | Total seconds | Saturated seconds | Saturation percentage |
|---|---|---|---|
| A | 6553 | 118 | 1.800702% |
| B | 6553 | 321 | 4.898520% |
| C | 6553 | 76 | 1.159774% |
| D | 6553 | 153 | 2.334808% |
Noise dominated data is calculated using 1-second bins in cleaned event files. If a bin has >2000 counts, and if more than 50% of those come from <1% of pixels, then it is considered to be noise-dominated and hence unusable.
| Quadrant | # 1 sec bins | Bins with >0 counts | Bins with >2000 counts | High rate bins dominated by noise | Noise dominated (total time) | Noise dominated (detector-on time) | Marked lightcurve |
|---|---|---|---|---|---|---|---|
| A | 7768 | 6553 | 4 | 4 | 0.05% | 0.06% | 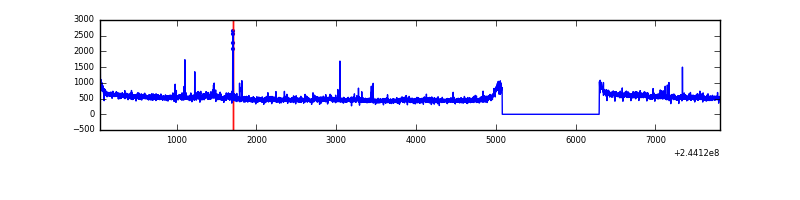 |
| B | 7768 | 6553 | 127 | 127 | 1.63% | 1.94% | 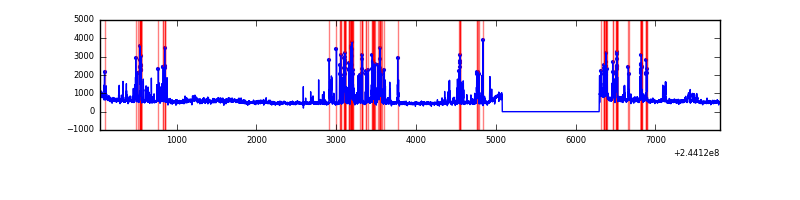 |
| C | 7768 | 6554 | 0 | 0 | 0.00% | 0.00% | 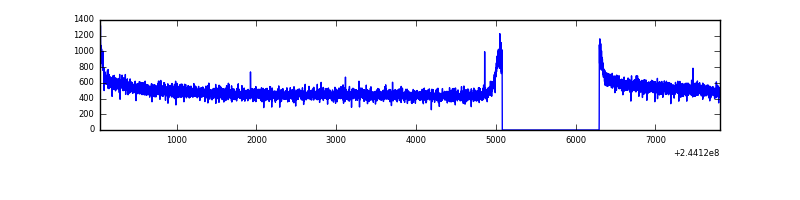 |
| D | 7768 | 6554 | 46 | 46 | 0.59% | 0.70% | 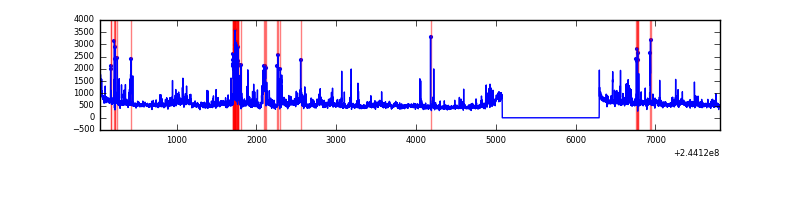 |
Top three noisy pixels from each quadrant. If the there are fewer than three noisy pixels in the level2.evt file, extra rows are filled as -1
| Pixel properties | Quadrant properties | ||||||
|---|---|---|---|---|---|---|---|
| Quadrant | DetID | PixID | Counts | Sigma | Mean | Median | Sigma |
| A | 8 | 15 | 67708 | 390.78 | 859 | 843 | 171.1 |
| A | 15 | 174 | 27183 | 153.94 | 859 | 843 | 171.1 |
| A | 14 | 254 | 16384 | 90.83 | 859 | 843 | 171.1 |
| B | 4 | 239 | 914951 | 5742.9 | 848 | 830 | 159.2 |
| B | 0 | 219 | 82426 | 512.62 | 848 | 830 | 159.2 |
| B | 0 | 214 | 65347 | 405.32 | 848 | 830 | 159.2 |
| C | 13 | 61 | 6294 | 28.48 | 834 | 841 | 191.5 |
| C | 5 | 207 | 2551 | 8.93 | 834 | 841 | 191.5 |
| C | 8 | 222 | 2306 | 7.65 | 834 | 841 | 191.5 |
| D | 13 | 138 | 224601 | 1133.87 | 830 | 808 | 197.4 |
| D | 13 | 104 | 198109 | 999.65 | 830 | 808 | 197.4 |
| D | 8 | 195 | 182952 | 922.85 | 830 | 808 | 197.4 |
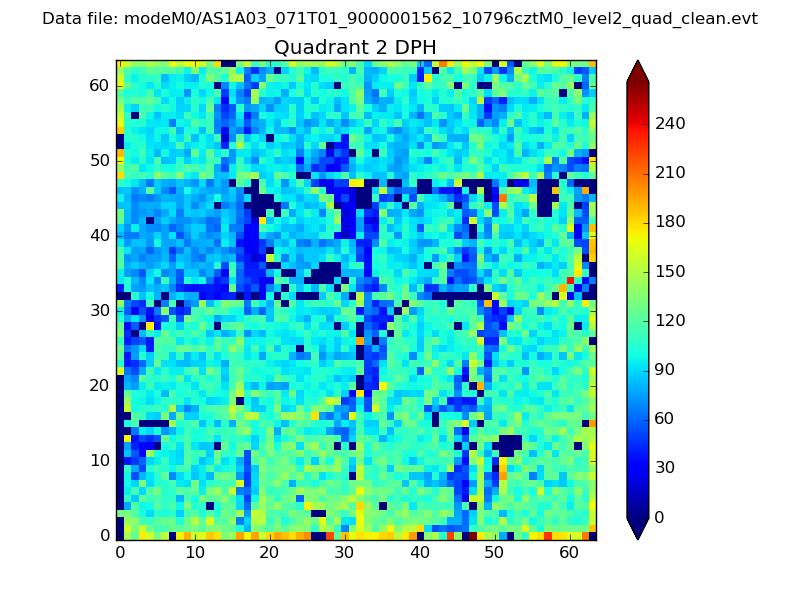
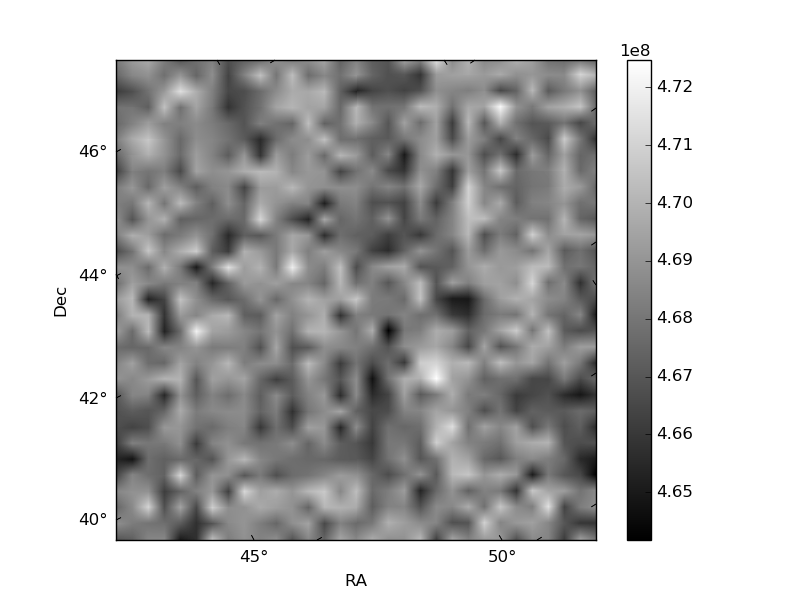
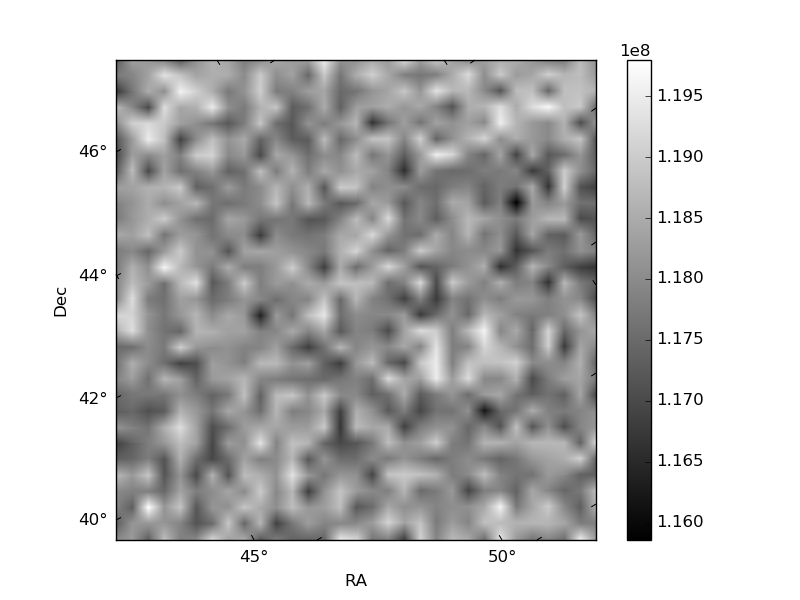
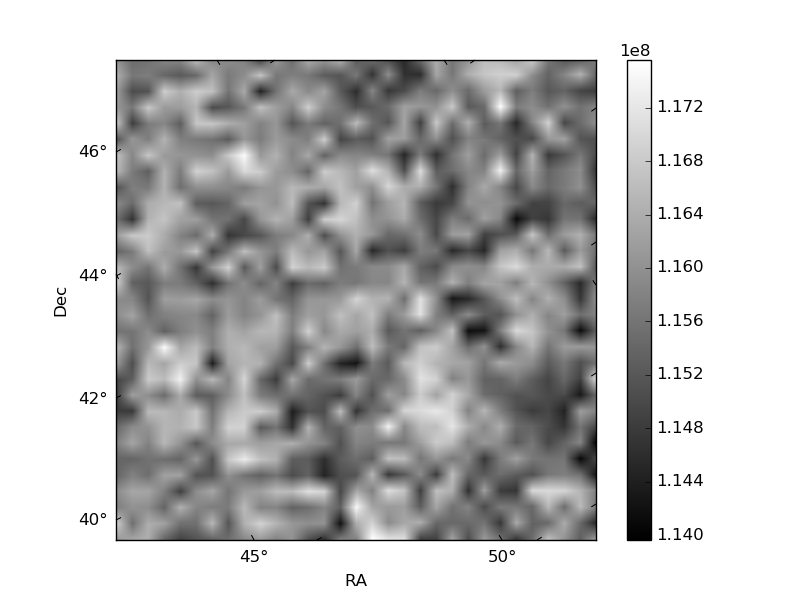
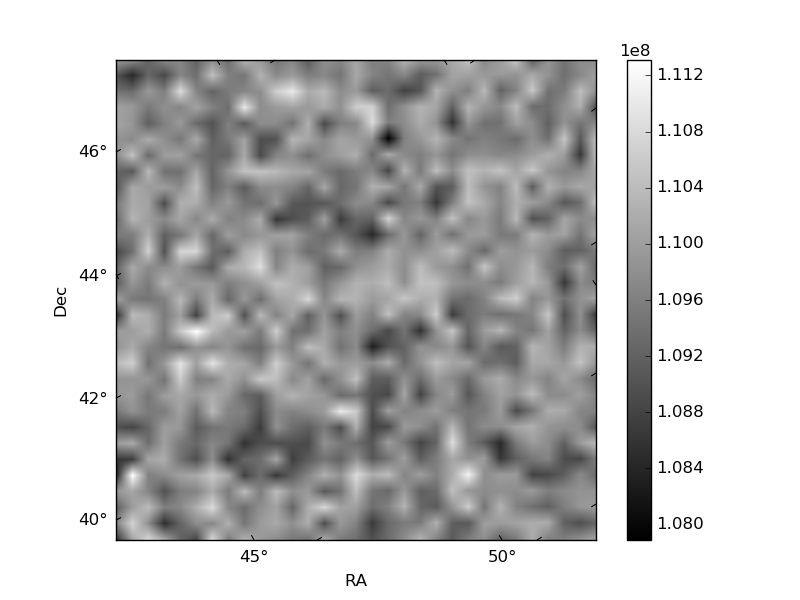
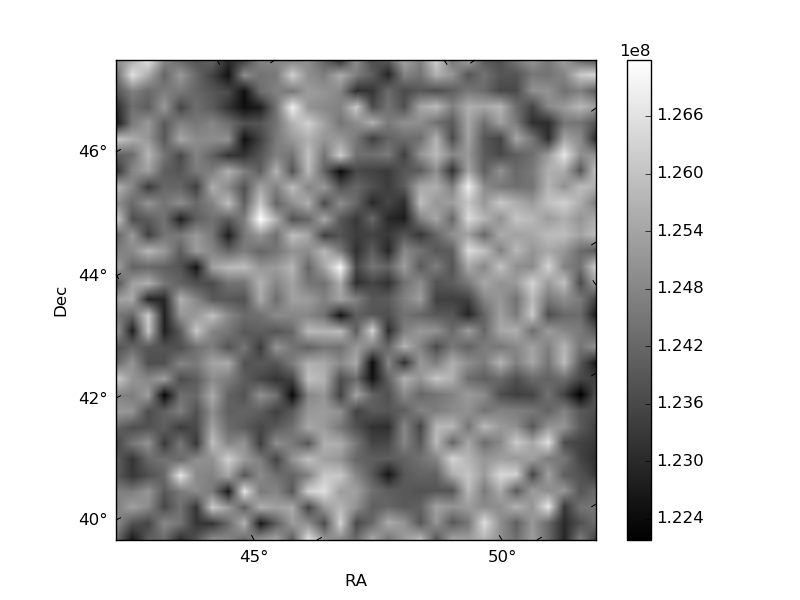
Histogram calculated using DETX and DETY for each event in the final _common_clean file
| Quadrant A | 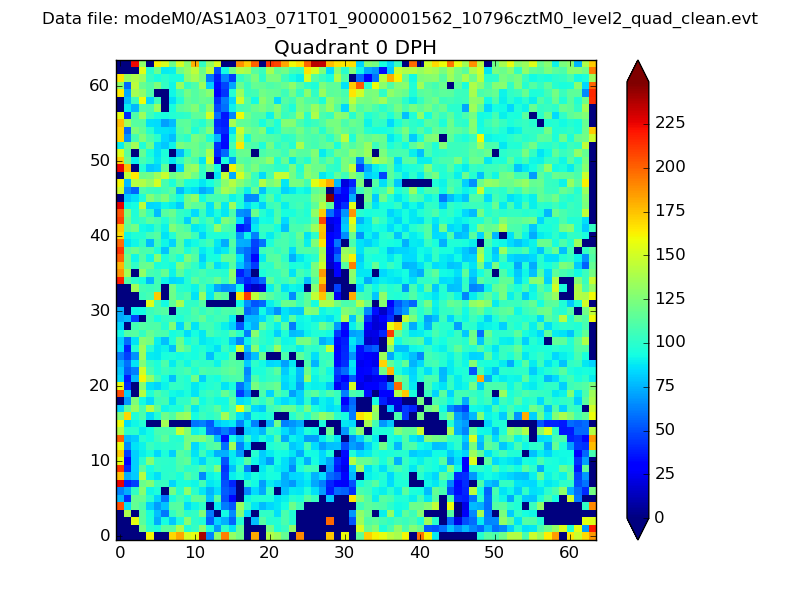 |
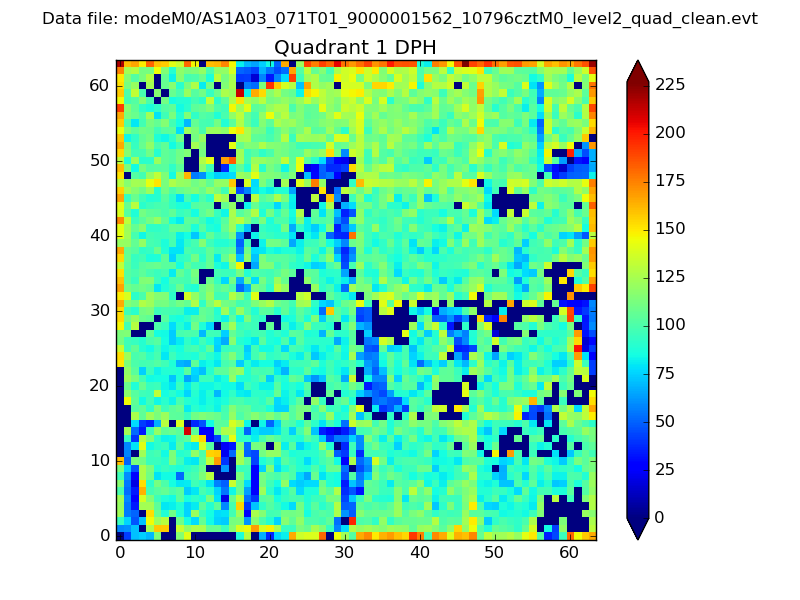 |
Quadrant B |
|---|---|---|---|
| Quadrant D | 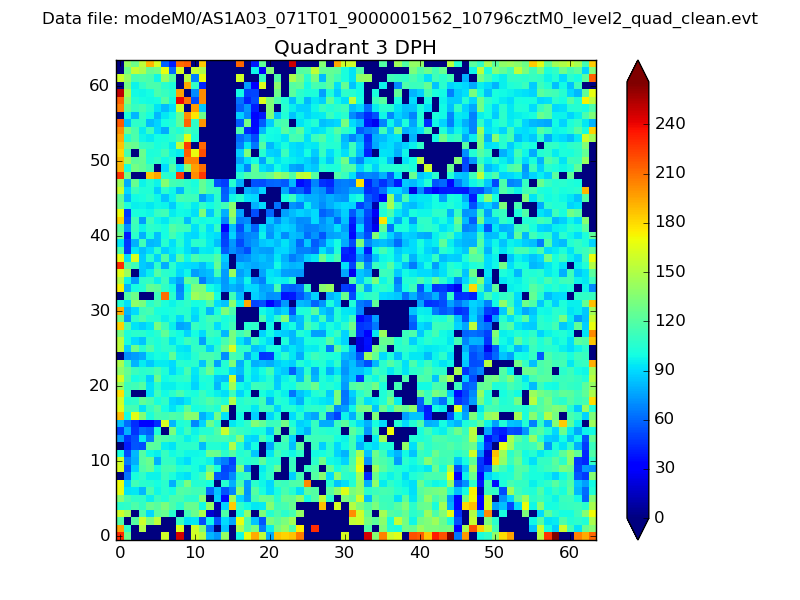 |
 |
Quadrant C |
| Plot type | Count rate plots | Images |
|---|---|---|
| Comparison with Poisson distribution Blue bars denote a histogram of data divided into 1 sec bins. Red curve is a Poisson curve with rate = median count rate of data. |
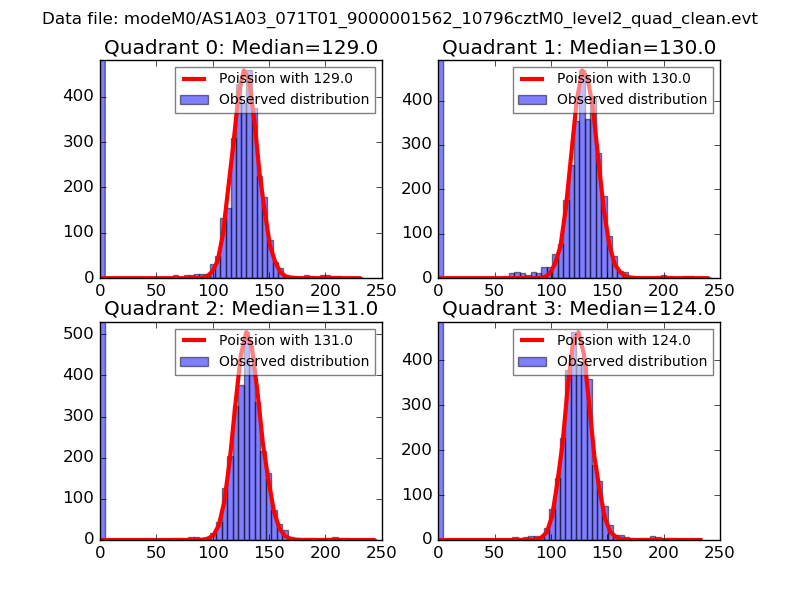 |
 |
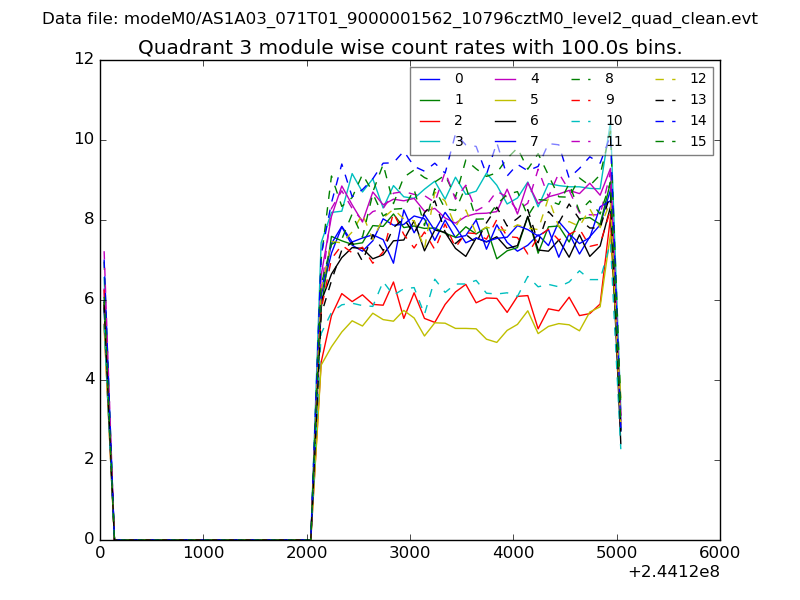
| Quadrant-wise count rates Data is divided into 100 sec bins |
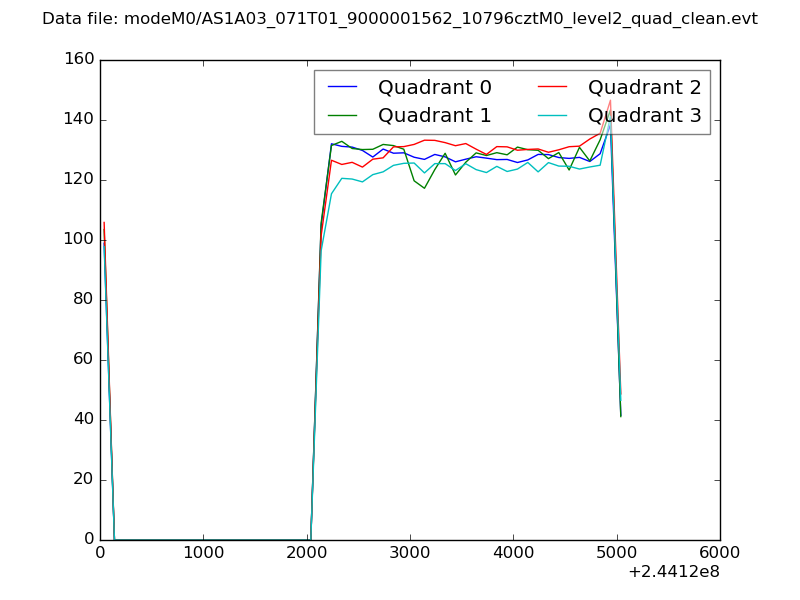 |
|
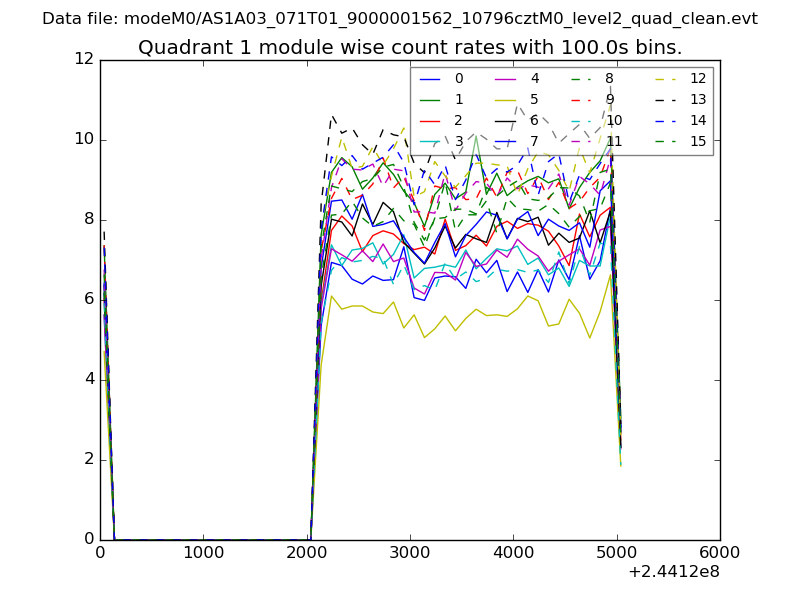
| Module-wise count rates for Quadrant A Data is divided into 100 sec bins |
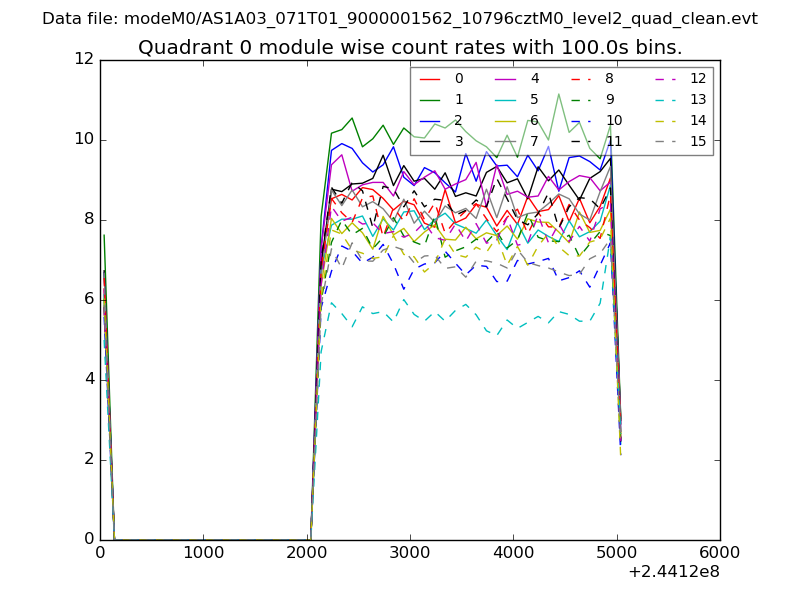 |
 |
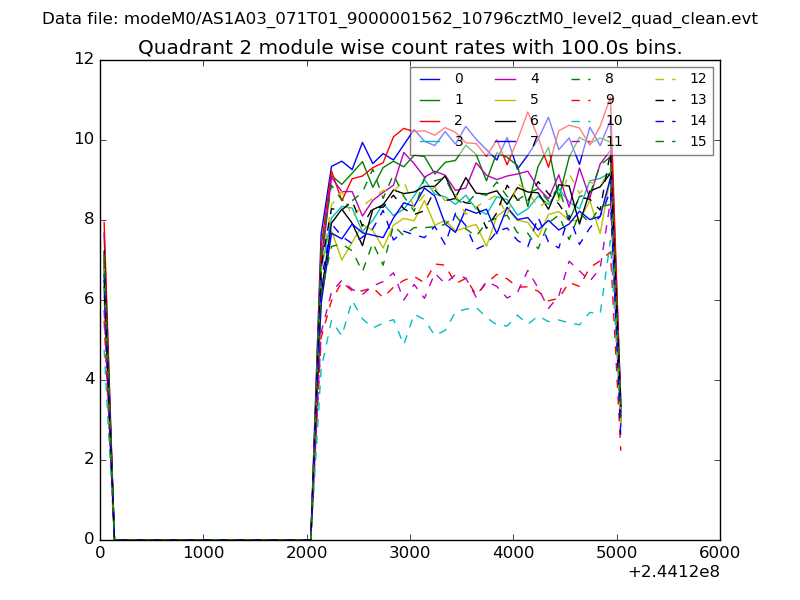
| Module-wise count rates for Quadrant B Data is divided into 100 sec bins |
 |
 |
| Module-wise count rates for Quadrant C Data is divided into 100 sec bins |
 |
 |
| Module-wise count rates for Quadrant D Data is divided into 100 sec bins |
 |
 |
| Parameter | Plot |
|---|---|
| CZT HV Monitor | 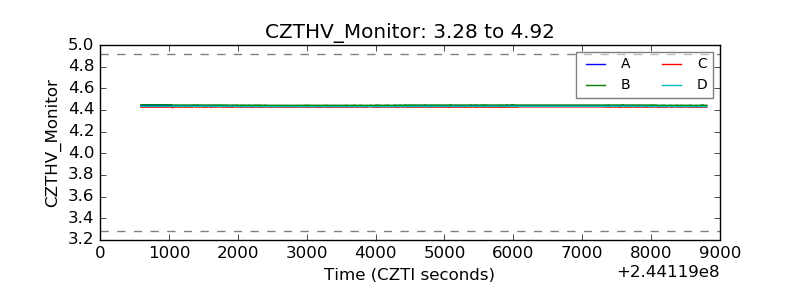 |
| D_VDD |  |
| Temperature 1 | 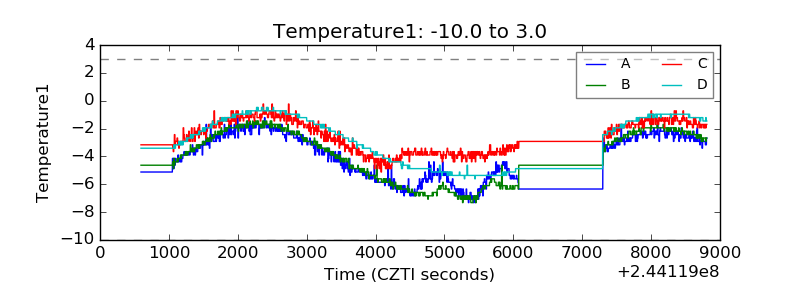 |
| Veto HV Monitor |  |
| Veto LLD | 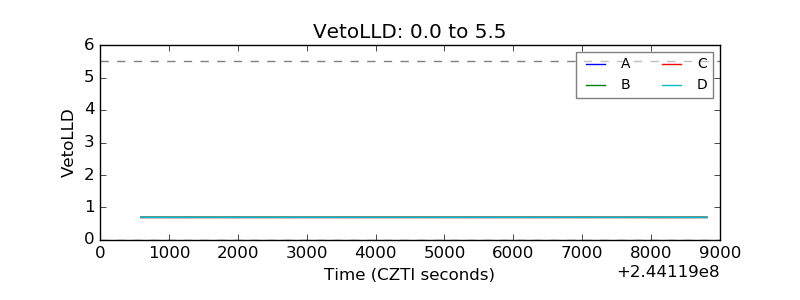 |
| Alpha Counter | 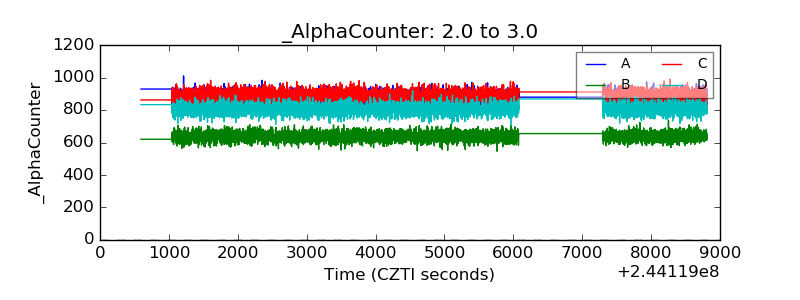 |
| _CPM_Rate | 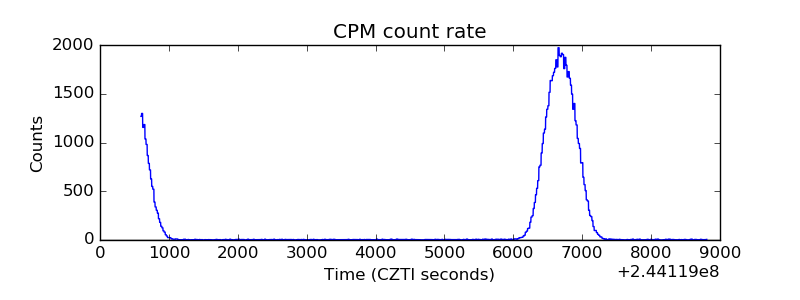 |
| CZT Counter | 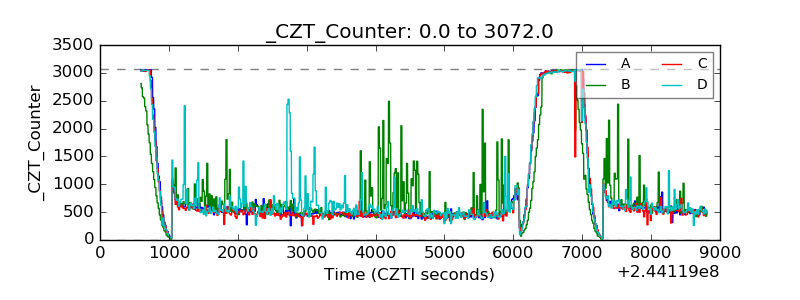 |
| +2.5 Volts monitor |  |
| +5 Volts monitor |  |
| _ROLL_ROT | 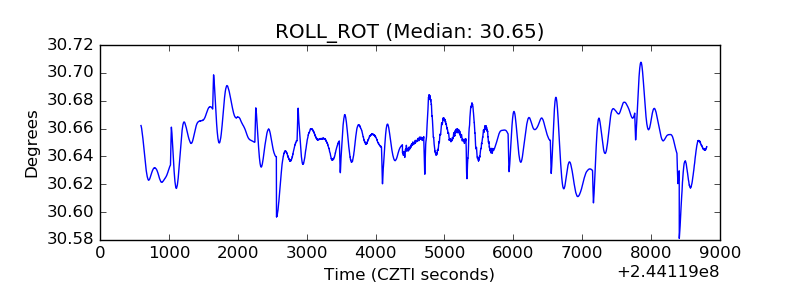 |
| _Roll_DEC |  |
| _Roll_RA | 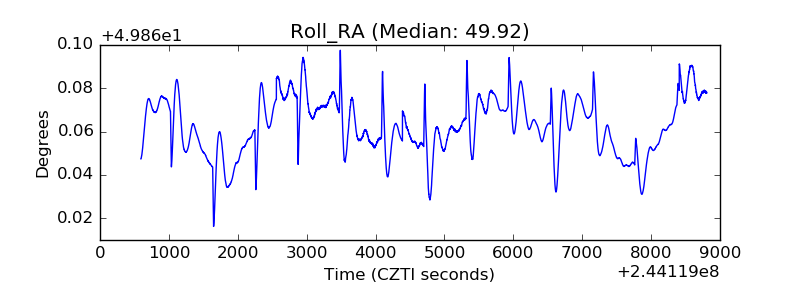 |
| Veto Counter | 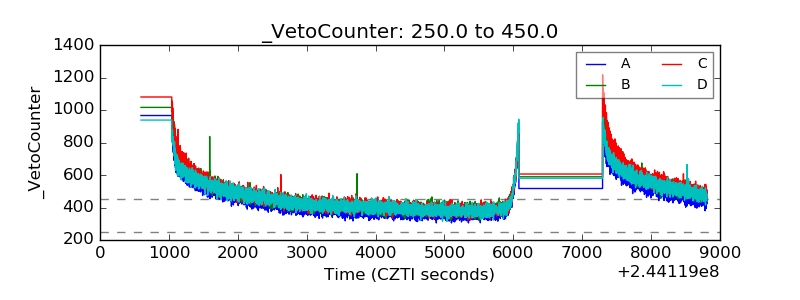 |