| Param | Original file | Final file |
|---|---|---|
| Filename | modeM0/AS1A03_071T01_9000001562_10797cztM0_level2.evt | modeM0/AS1A03_071T01_9000001562_10797cztM0_level2_quad_clean.evt |
| Size (bytes) | 506,661,120 | 73,751,040 |
| Size | 483.2 MB | 70.3 MB |
| Events in quadrant A | 3,267,815 | 449,536 |
| Events in quadrant B | 4,511,609 | 448,969 |
| Events in quadrant C | 3,206,322 | 461,146 |
| Events in quadrant D | 3,929,408 | 432,029 |
| Mode M9 | |||
|---|---|---|---|
| Quadrant | BADHDUFLAG | Total packets | Discarded packets |
| A | 0 | 13 | 0 |
| B | 0 | 13 | 0 |
| C | 0 | 13 | 0 |
| D | 0 | 13 | 0 |
| Mode M0 | |||
|---|---|---|---|
| Quadrant | BADHDUFLAG | Total packets | Discarded packets |
| A | 0 | 13777 | 3 |
| B | 0 | 17682 | 2 |
| C | 0 | 13467 | 2 |
| D | 0 | 15984 | 2 |
| Mode SS | |||
|---|---|---|---|
| Quadrant | BADHDUFLAG | Total packets | Discarded packets |
| A | 0 | 128 | 0 |
| B | 0 | 128 | 0 |
| C | 0 | 128 | 0 |
| D | 0 | 128 | 0 |
| Quadrant | Total seconds | Saturated seconds | Saturation percentage |
|---|---|---|---|
| A | 6325 | 93 | 1.470356% |
| B | 6325 | 346 | 5.470356% |
| C | 6325 | 71 | 1.122530% |
| D | 6325 | 233 | 3.683794% |
Noise dominated data is calculated using 1-second bins in cleaned event files. If a bin has >2000 counts, and if more than 50% of those come from <1% of pixels, then it is considered to be noise-dominated and hence unusable.
| Quadrant | # 1 sec bins | Bins with >0 counts | Bins with >2000 counts | High rate bins dominated by noise | Noise dominated (total time) | Noise dominated (detector-on time) | Marked lightcurve |
|---|---|---|---|---|---|---|---|
| A | 7615 | 6326 | 0 | 0 | 0.00% | 0.00% | 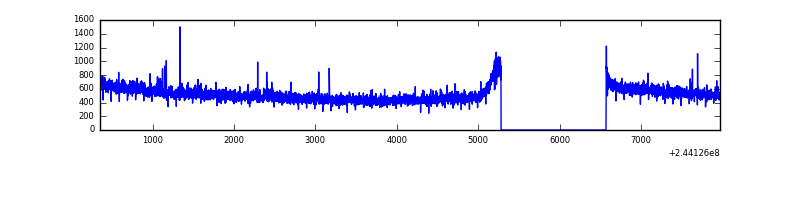 |
| B | 7615 | 6325 | 163 | 163 | 2.14% | 2.58% |  |
| C | 7615 | 6326 | 1 | 1 | 0.01% | 0.02% | 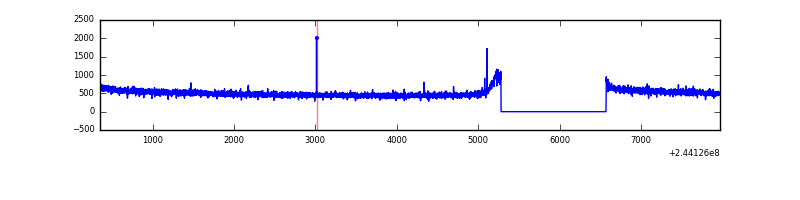 |
| D | 7615 | 6326 | 103 | 103 | 1.35% | 1.63% | 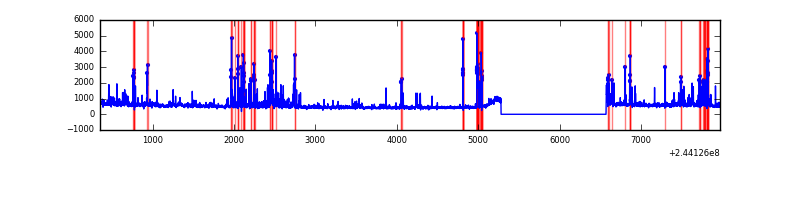 |
Top three noisy pixels from each quadrant. If the there are fewer than three noisy pixels in the level2.evt file, extra rows are filled as -1
| Pixel properties | Quadrant properties | ||||||
|---|---|---|---|---|---|---|---|
| Quadrant | DetID | PixID | Counts | Sigma | Mean | Median | Sigma |
| A | 8 | 15 | 33360 | 194.7 | 834 | 820 | 167.1 |
| A | 14 | 254 | 8011 | 43.03 | 834 | 820 | 167.1 |
| A | 0 | 226 | 7808 | 41.81 | 834 | 820 | 167.1 |
| B | 4 | 239 | 810436 | 5234.23 | 828 | 810 | 154.7 |
| B | 15 | 204 | 212675 | 1369.71 | 828 | 810 | 154.7 |
| B | 0 | 85 | 171530 | 1103.7 | 828 | 810 | 154.7 |
| C | 13 | 61 | 6043 | 28.06 | 819 | 825 | 186.0 |
| C | 14 | 234 | 4967 | 22.27 | 819 | 825 | 186.0 |
| C | 14 | 67 | 4113 | 17.68 | 819 | 825 | 186.0 |
| D | 13 | 138 | 256800 | 1321.6 | 809 | 788 | 193.7 |
| D | 13 | 104 | 222706 | 1145.59 | 809 | 788 | 193.7 |
| D | 1 | 52 | 210413 | 1082.13 | 809 | 788 | 193.7 |
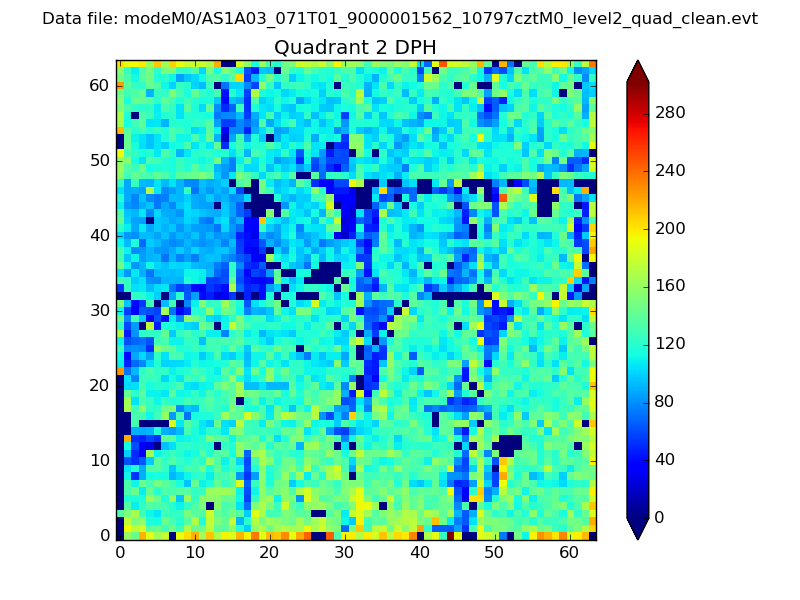
Histogram calculated using DETX and DETY for each event in the final _common_clean file
| Quadrant A |  |
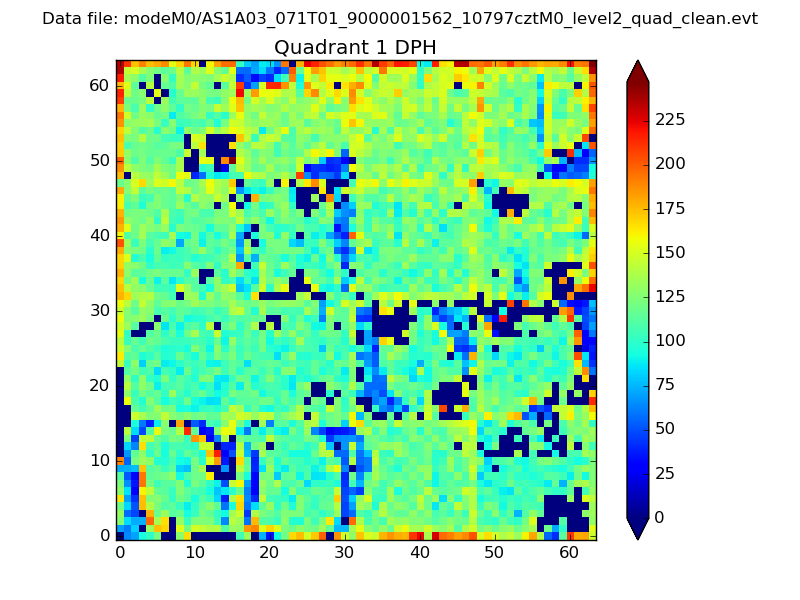 |
Quadrant B |
|---|---|---|---|
| Quadrant D | 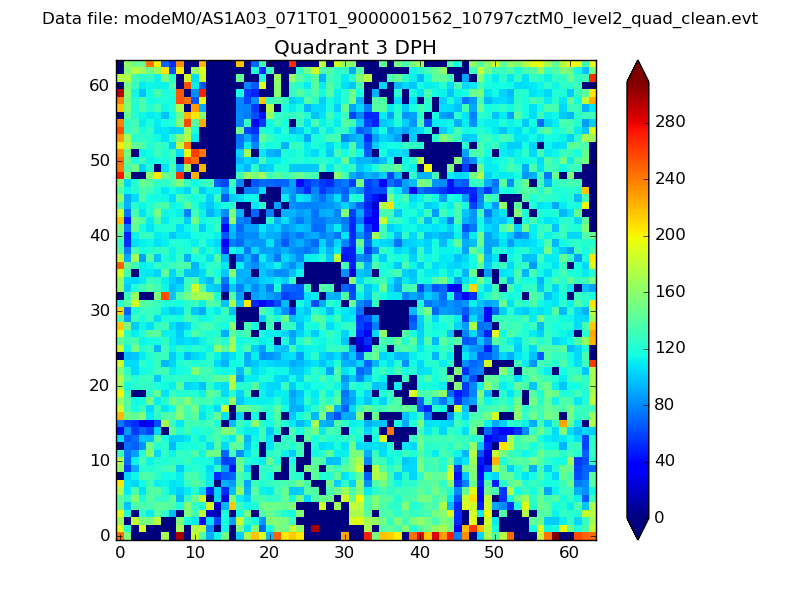 |
 |
Quadrant C |
| Plot type | Count rate plots | Images |
|---|---|---|
| Comparison with Poisson distribution Blue bars denote a histogram of data divided into 1 sec bins. Red curve is a Poisson curve with rate = median count rate of data. |
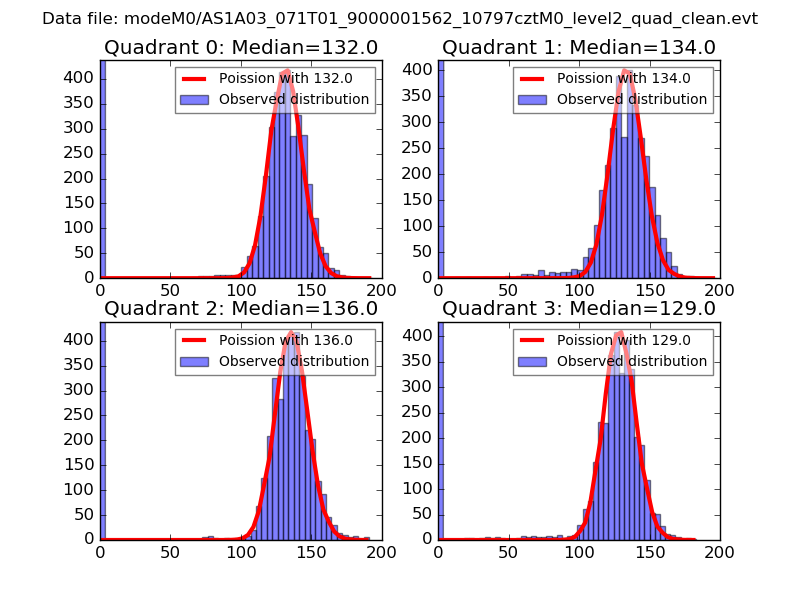 |
 |
| Quadrant-wise count rates Data is divided into 100 sec bins |
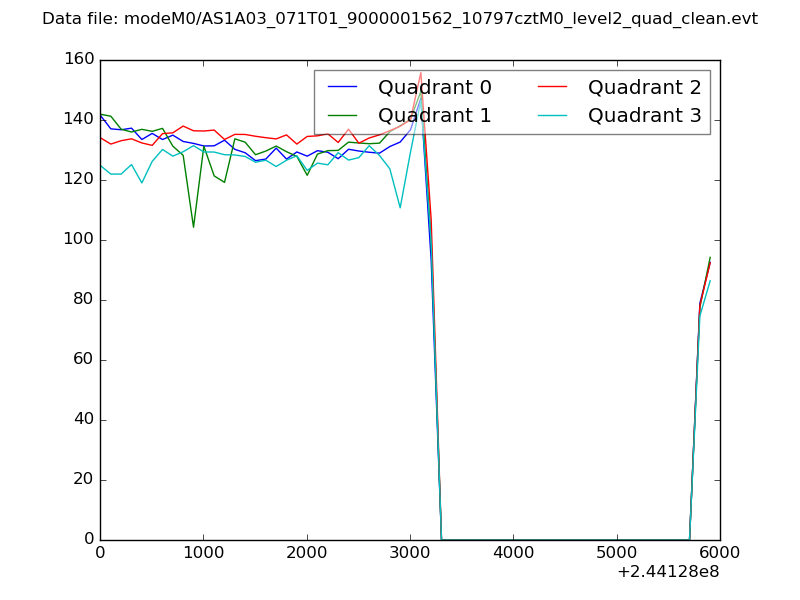 |
|
| Module-wise count rates for Quadrant A Data is divided into 100 sec bins |
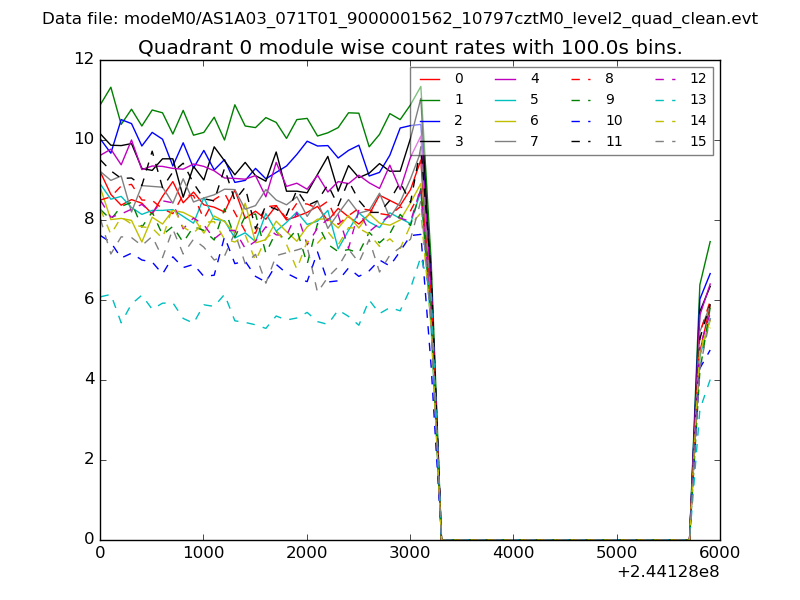 |
 |
| Module-wise count rates for Quadrant B Data is divided into 100 sec bins |
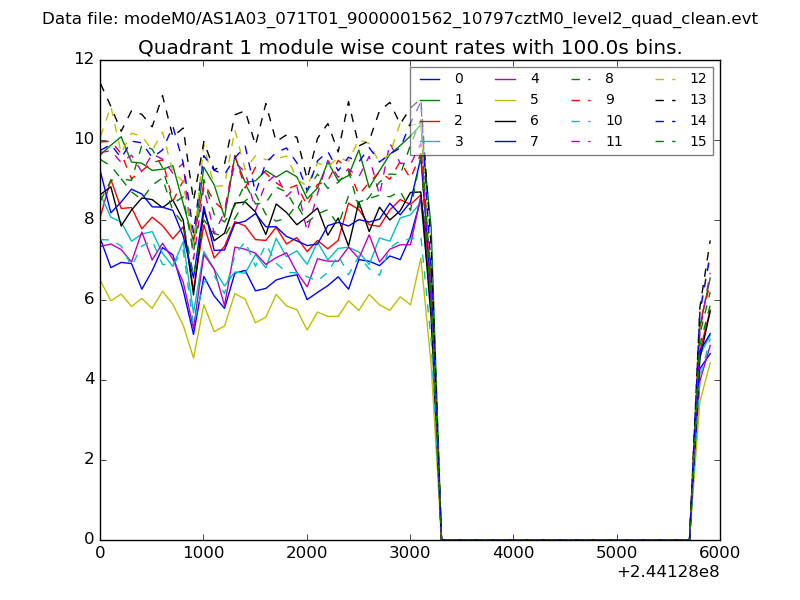 |
 |
| Module-wise count rates for Quadrant C Data is divided into 100 sec bins |
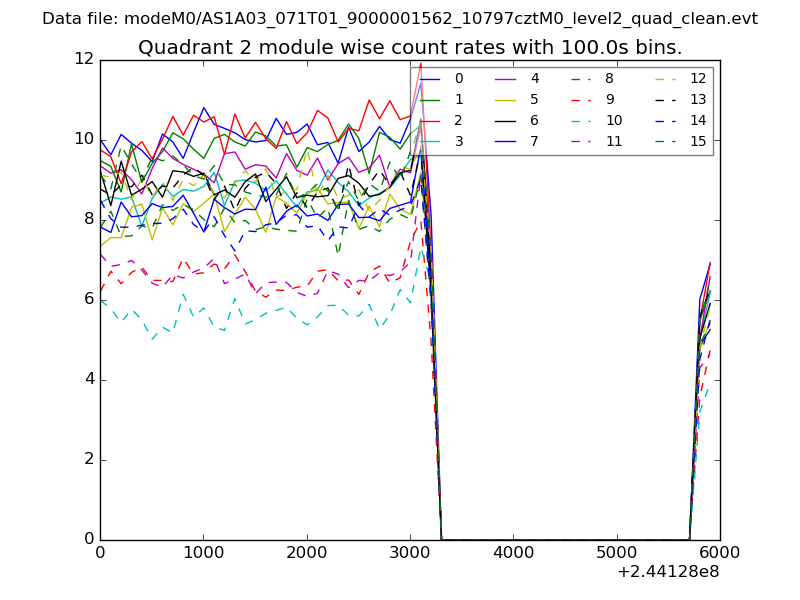 |
 |
| Module-wise count rates for Quadrant D Data is divided into 100 sec bins |
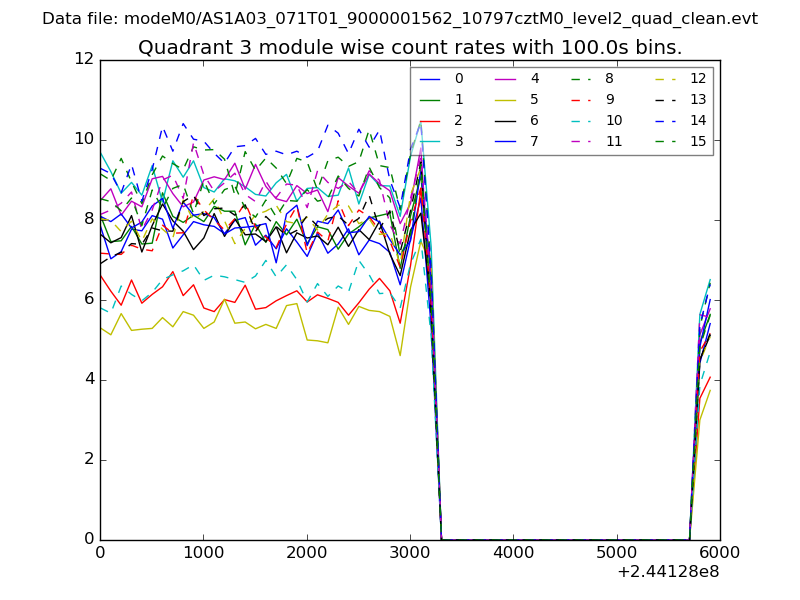 |
 |
| Parameter | Plot |
|---|---|
| CZT HV Monitor | 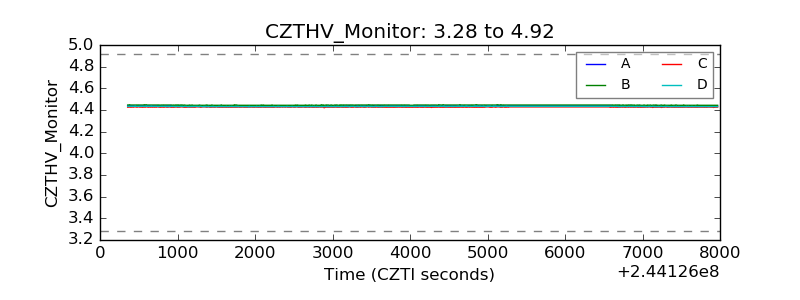 |
| D_VDD | 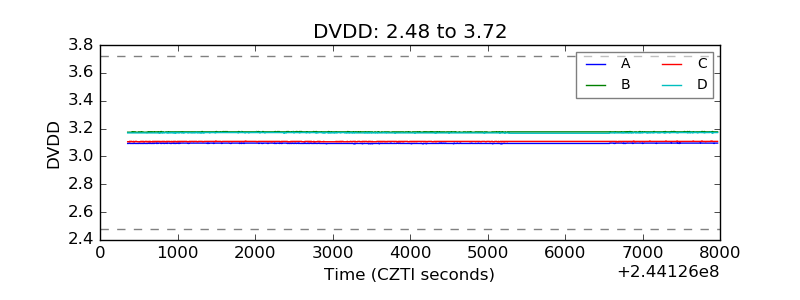 |
| Temperature 1 | 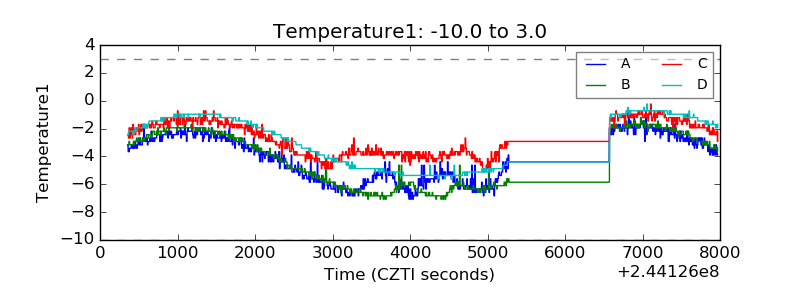 |
| Veto HV Monitor | 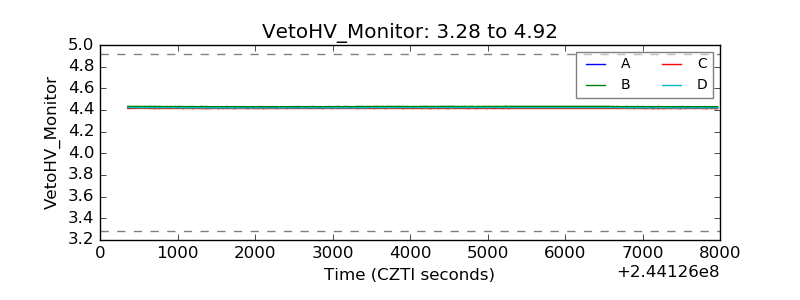 |
| Veto LLD | 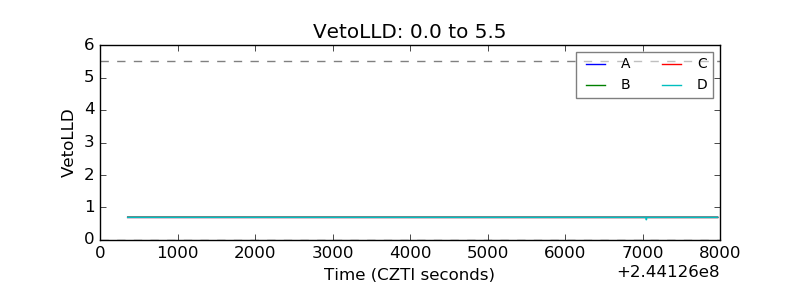 |
| Alpha Counter | 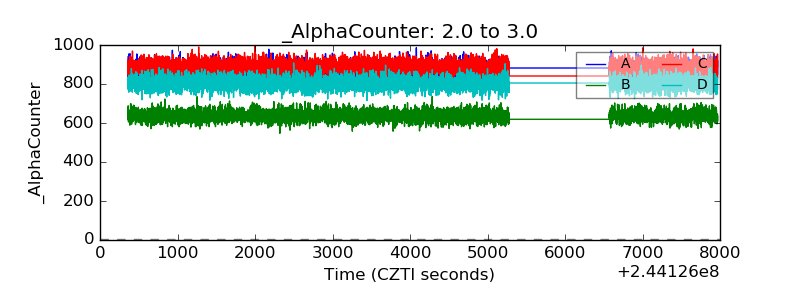 |
| _CPM_Rate | 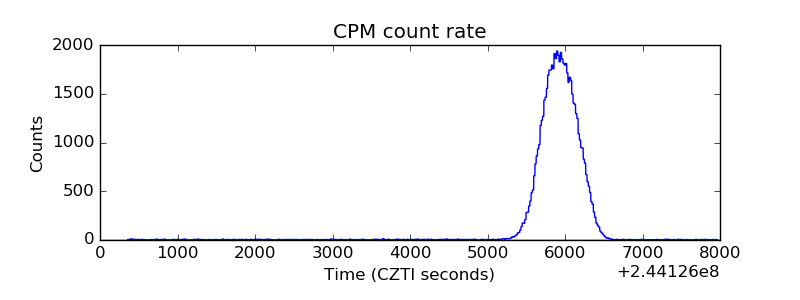 |
| CZT Counter | 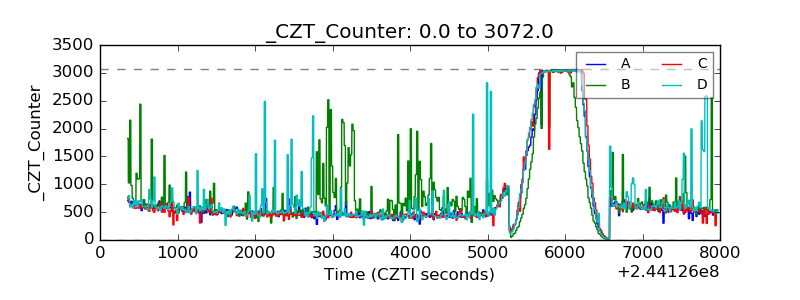 |
| +2.5 Volts monitor |  |
| +5 Volts monitor |  |
| _ROLL_ROT | 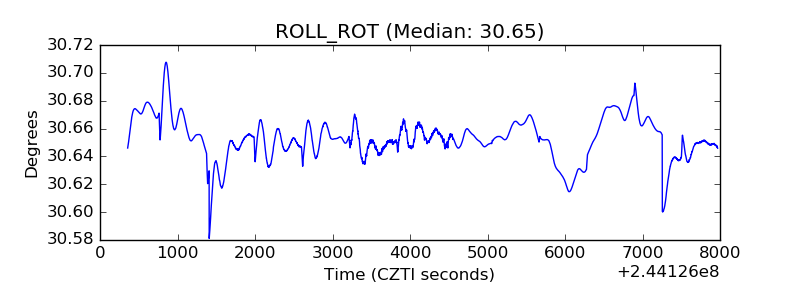 |
| _Roll_DEC | 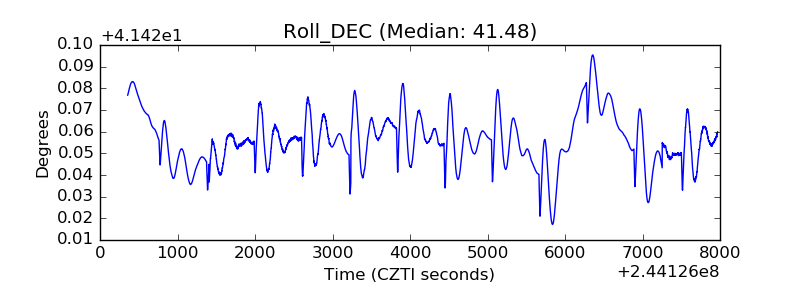 |
| _Roll_RA | 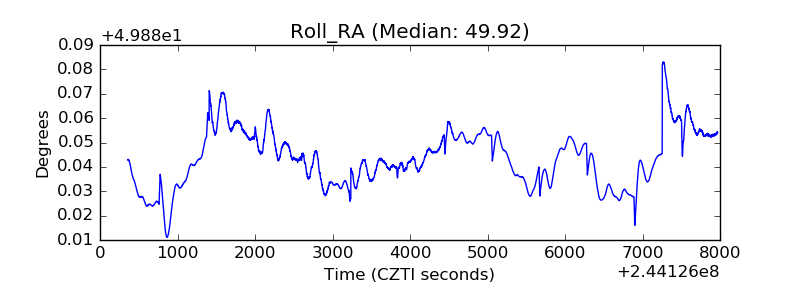 |
| Veto Counter | 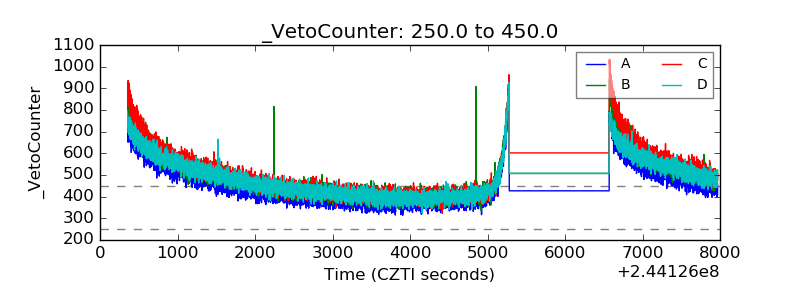 |