| Param | Original file | Final file |
|---|---|---|
| Filename | modeM0/AS1A03_071T01_9000001562_10798cztM0_level2.evt | modeM0/AS1A03_071T01_9000001562_10798cztM0_level2_quad_clean.evt |
| Size (bytes) | 546,742,080 | 84,625,920 |
| Size | 521.4 MB | 80.7 MB |
| Events in quadrant A | 3,182,954 | 536,659 |
| Events in quadrant B | 4,657,675 | 534,786 |
| Events in quadrant C | 3,150,157 | 556,795 |
| Events in quadrant D | 5,147,228 | 501,432 |
| Mode M9 | |||
|---|---|---|---|
| Quadrant | BADHDUFLAG | Total packets | Discarded packets |
| A | 0 | 22 | 0 |
| B | 0 | 22 | 0 |
| C | 0 | 22 | 0 |
| D | 0 | 23 | 0 |
| Mode M0 | |||
|---|---|---|---|
| Quadrant | BADHDUFLAG | Total packets | Discarded packets |
| A | 0 | 13452 | 3 |
| B | 0 | 18177 | 2 |
| C | 0 | 13267 | 2 |
| D | 0 | 19367 | 2 |
| Mode SS | |||
|---|---|---|---|
| Quadrant | BADHDUFLAG | Total packets | Discarded packets |
| A | 0 | 126 | 0 |
| B | 0 | 126 | 0 |
| C | 0 | 126 | 0 |
| D | 0 | 126 | 0 |
| Quadrant | Total seconds | Saturated seconds | Saturation percentage |
|---|---|---|---|
| A | 6199 | 103 | 1.661558% |
| B | 6199 | 440 | 7.097919% |
| C | 6199 | 77 | 1.242136% |
| D | 6199 | 499 | 8.049685% |
Noise dominated data is calculated using 1-second bins in cleaned event files. If a bin has >2000 counts, and if more than 50% of those come from <1% of pixels, then it is considered to be noise-dominated and hence unusable.
| Quadrant | # 1 sec bins | Bins with >0 counts | Bins with >2000 counts | High rate bins dominated by noise | Noise dominated (total time) | Noise dominated (detector-on time) | Marked lightcurve |
|---|---|---|---|---|---|---|---|
| A | 7484 | 6200 | 3 | 3 | 0.04% | 0.05% |  |
| B | 7484 | 6200 | 202 | 202 | 2.70% | 3.26% | 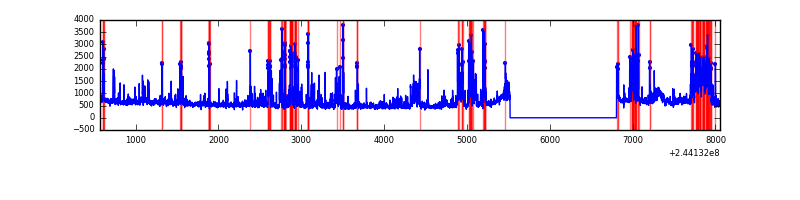 |
| C | 7484 | 6200 | 2 | 2 | 0.03% | 0.03% | 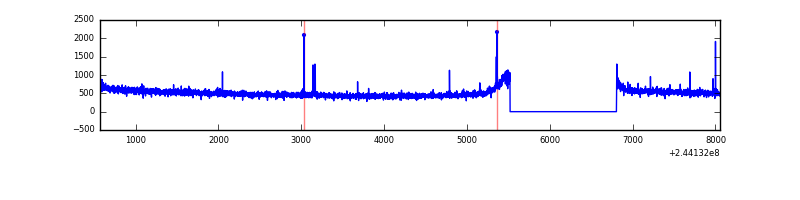 |
| D | 7484 | 6200 | 388 | 388 | 5.18% | 6.26% |  |
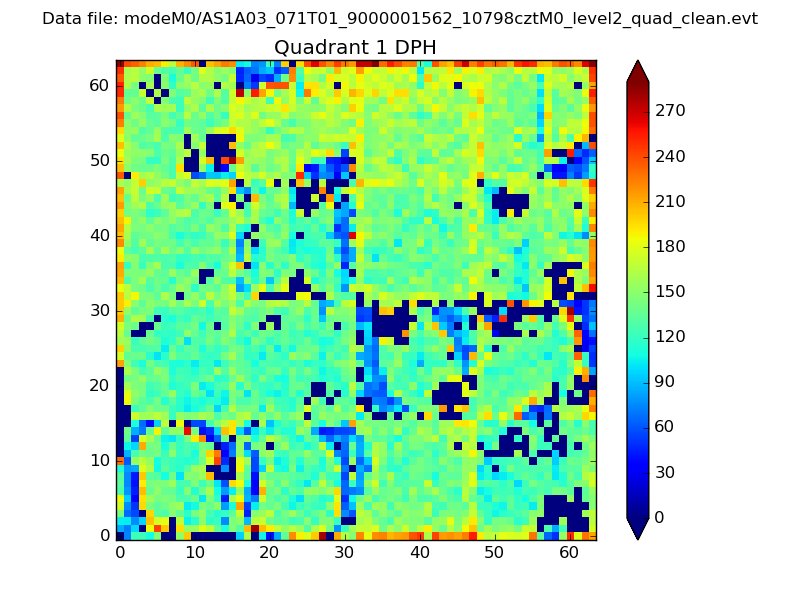
Top three noisy pixels from each quadrant. If the there are fewer than three noisy pixels in the level2.evt file, extra rows are filled as -1
| Pixel properties | Quadrant properties | ||||||
|---|---|---|---|---|---|---|---|
| Quadrant | DetID | PixID | Counts | Sigma | Mean | Median | Sigma |
| A | 15 | 174 | 34030 | 204.35 | 806 | 791 | 162.7 |
| A | 8 | 15 | 27637 | 165.05 | 806 | 791 | 162.7 |
| A | 4 | 2 | 7582 | 41.75 | 806 | 791 | 162.7 |
| B | 4 | 239 | 952643 | 6444.25 | 798 | 781 | 147.7 |
| B | 15 | 204 | 209274 | 1411.53 | 798 | 781 | 147.7 |
| B | 0 | 85 | 197066 | 1328.88 | 798 | 781 | 147.7 |
| C | 14 | 234 | 26728 | 142.72 | 798 | 805 | 181.6 |
| C | 13 | 61 | 5971 | 28.44 | 798 | 805 | 181.6 |
| C | 14 | 67 | 5515 | 25.93 | 798 | 805 | 181.6 |
| D | 13 | 138 | 874371 | 4732.82 | 774 | 754 | 184.6 |
| D | 1 | 52 | 606677 | 3282.58 | 774 | 754 | 184.6 |
| D | 10 | 253 | 221747 | 1197.23 | 774 | 754 | 184.6 |
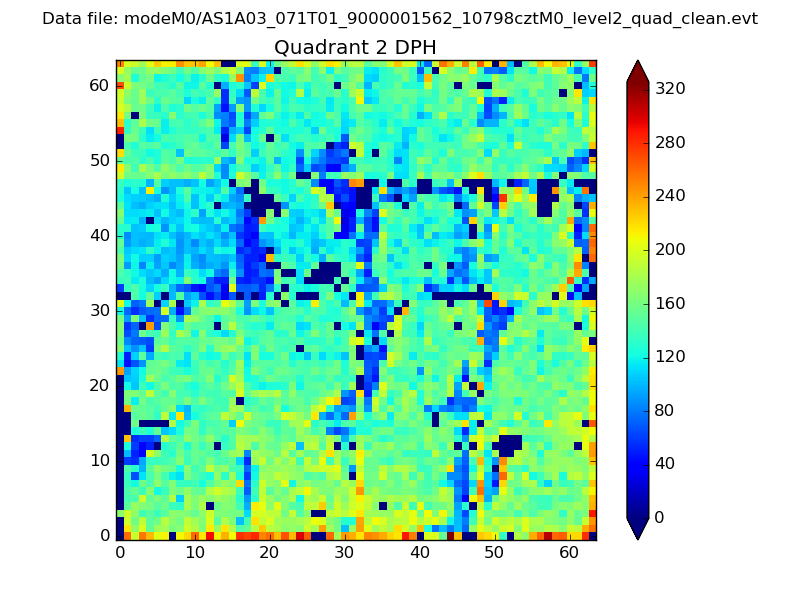
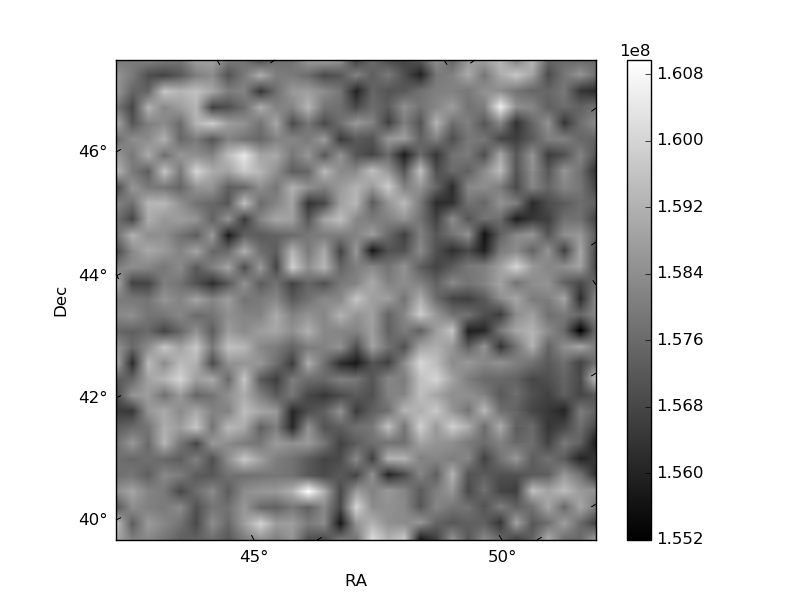
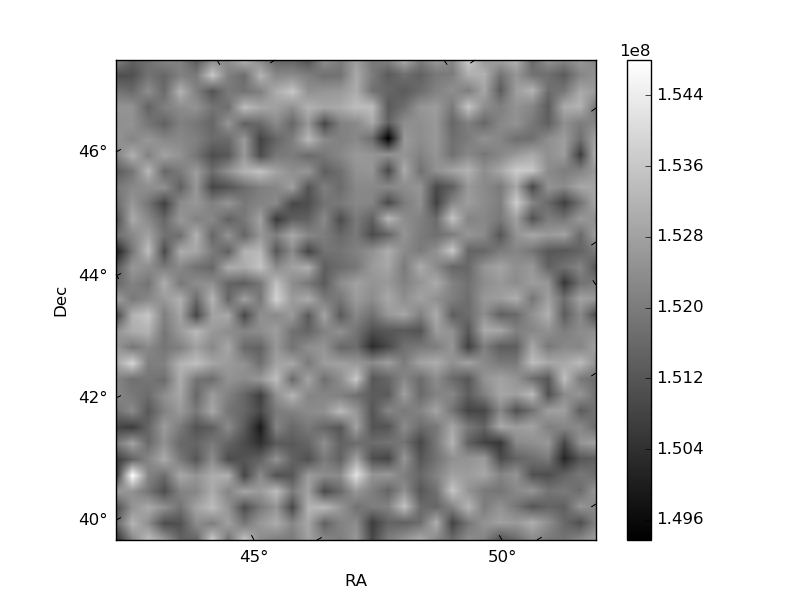
Histogram calculated using DETX and DETY for each event in the final _common_clean file
| Quadrant A | 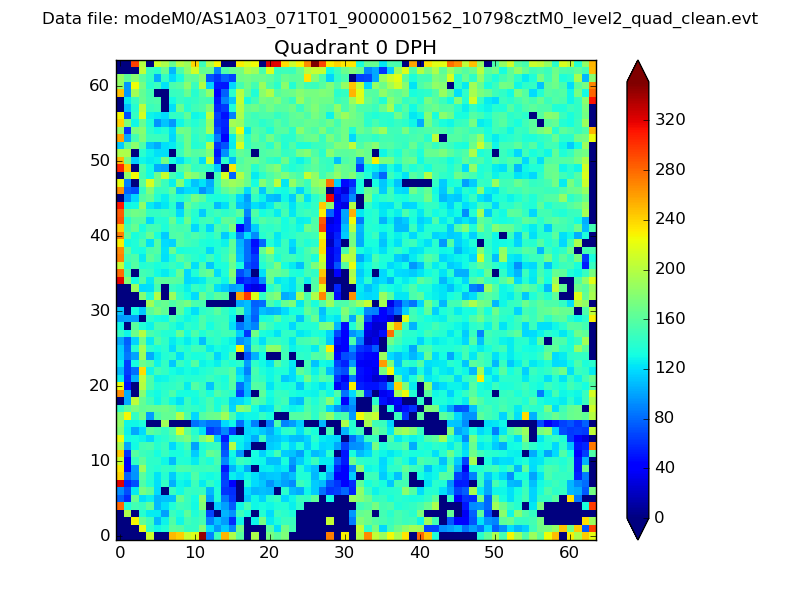 |
 |
Quadrant B |
|---|---|---|---|
| Quadrant D | 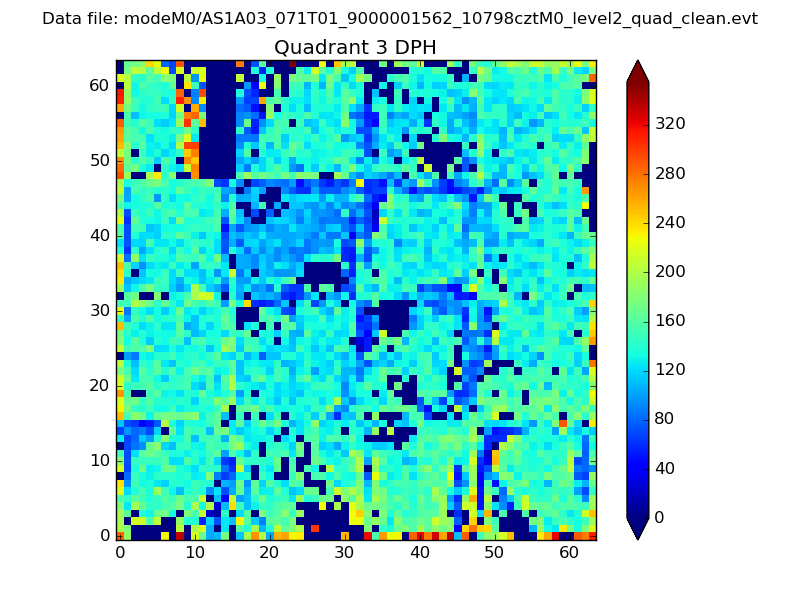 |
 |
Quadrant C |
| Plot type | Count rate plots | Images |
|---|---|---|
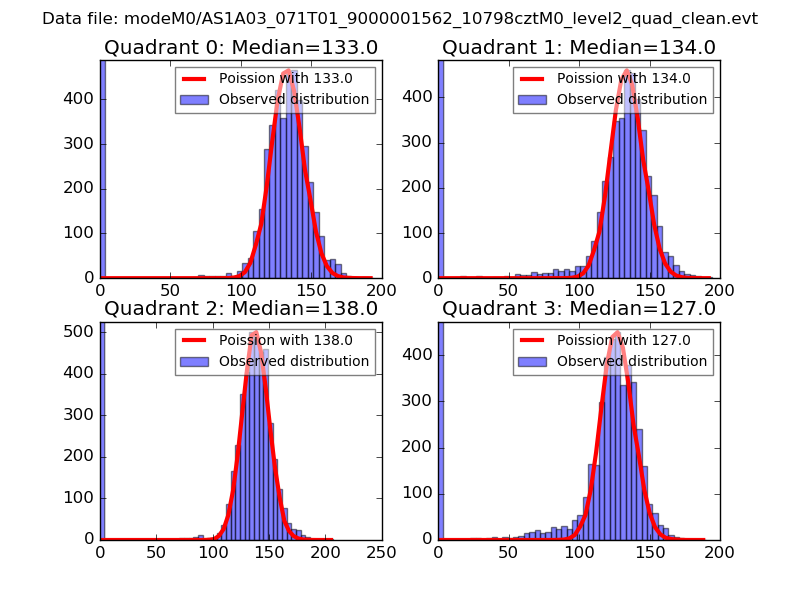
| Comparison with Poisson distribution Blue bars denote a histogram of data divided into 1 sec bins. Red curve is a Poisson curve with rate = median count rate of data. |
 |
 |
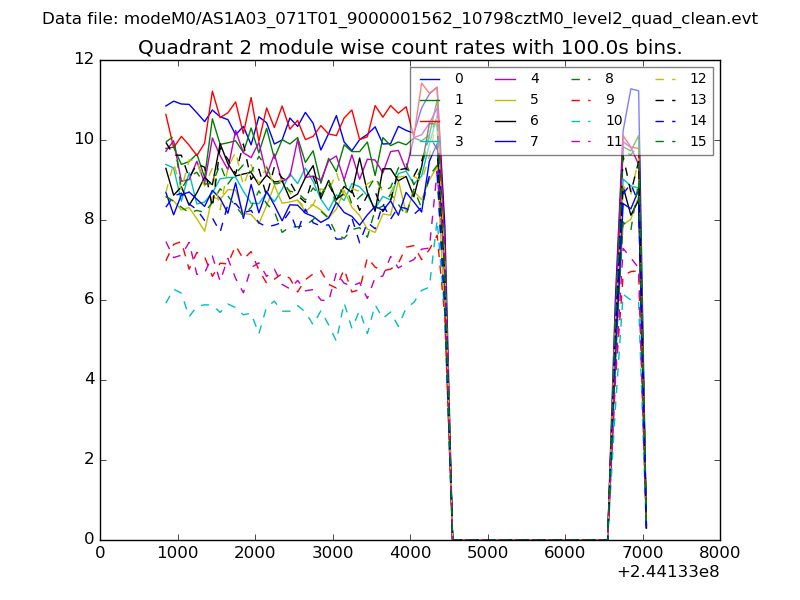
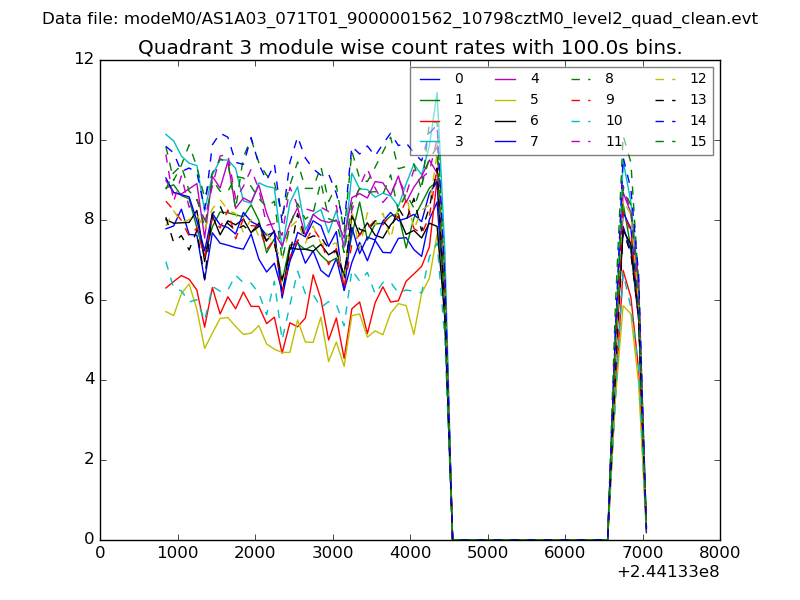
| Quadrant-wise count rates Data is divided into 100 sec bins |
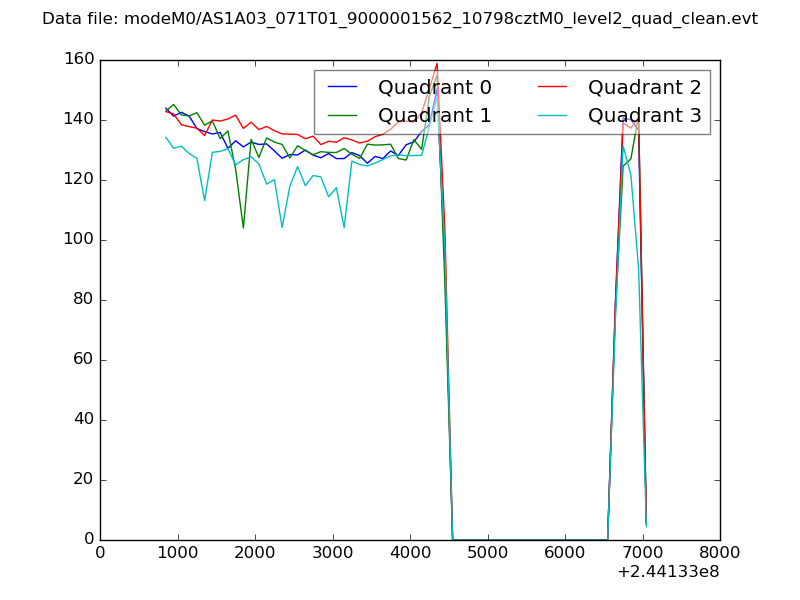 |
|
| Module-wise count rates for Quadrant A Data is divided into 100 sec bins |
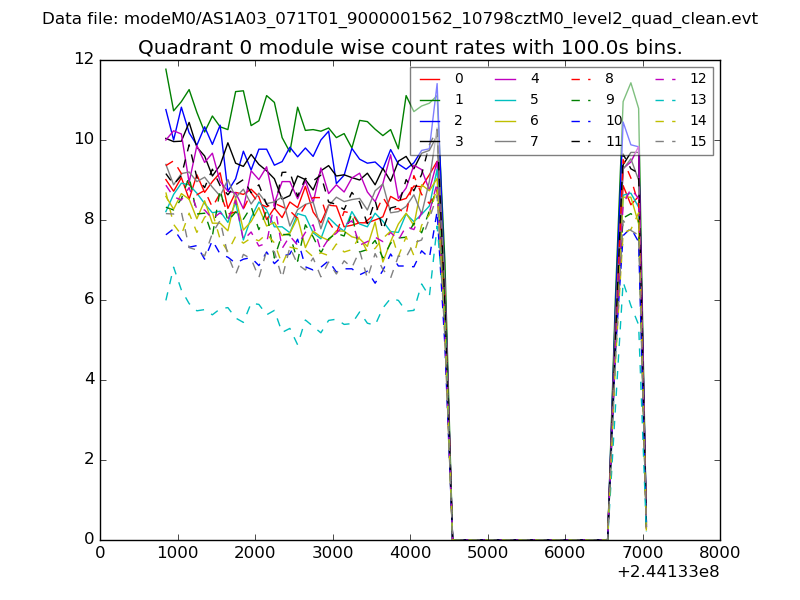 |
 |
| Module-wise count rates for Quadrant B Data is divided into 100 sec bins |
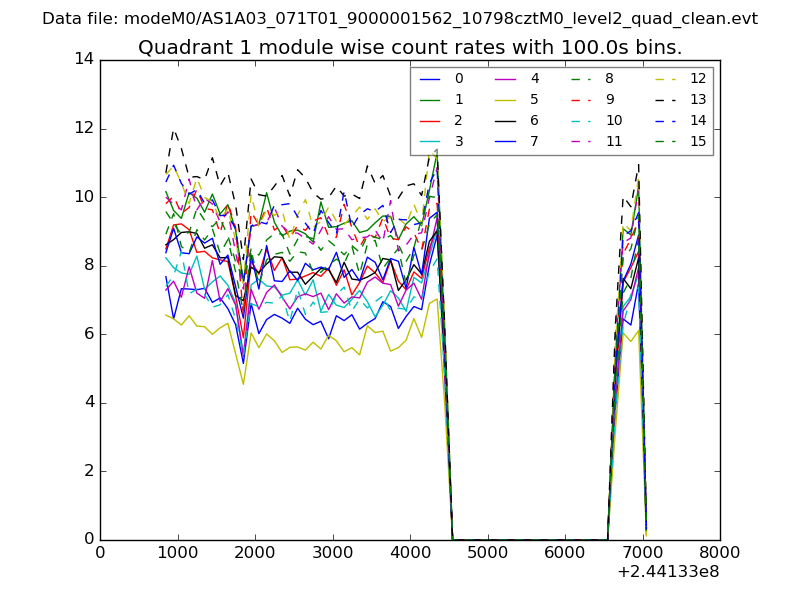 |
 |
| Module-wise count rates for Quadrant C Data is divided into 100 sec bins |
 |
 |
| Module-wise count rates for Quadrant D Data is divided into 100 sec bins |
 |
 |
| Parameter | Plot |
|---|---|
| CZT HV Monitor | 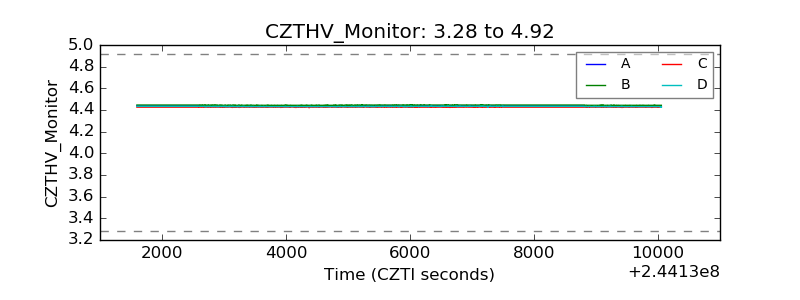 |
| D_VDD | 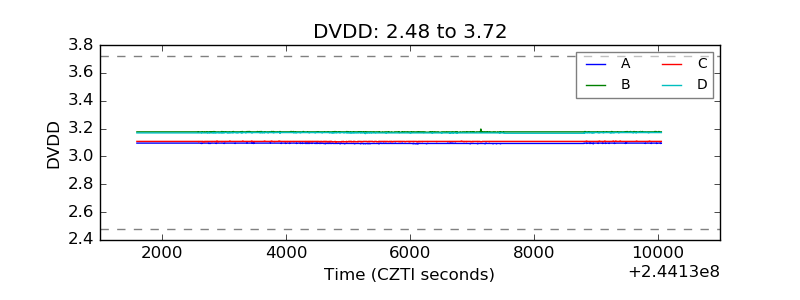 |
| Temperature 1 | 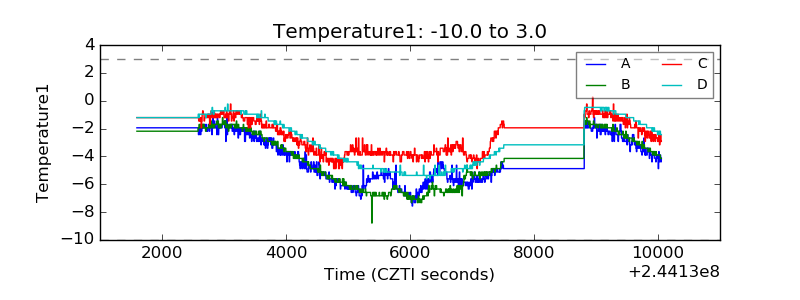 |
| Veto HV Monitor |  |
| Veto LLD | 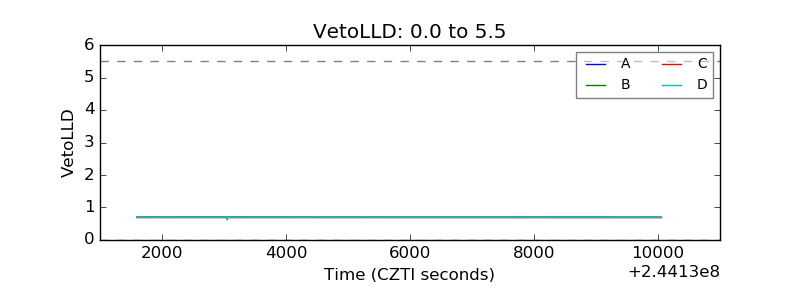 |
| Alpha Counter | 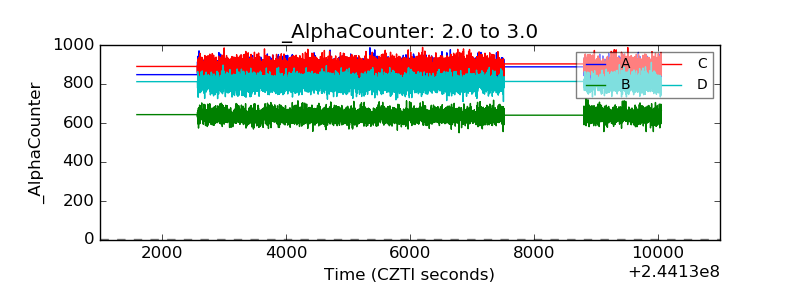 |
| _CPM_Rate | 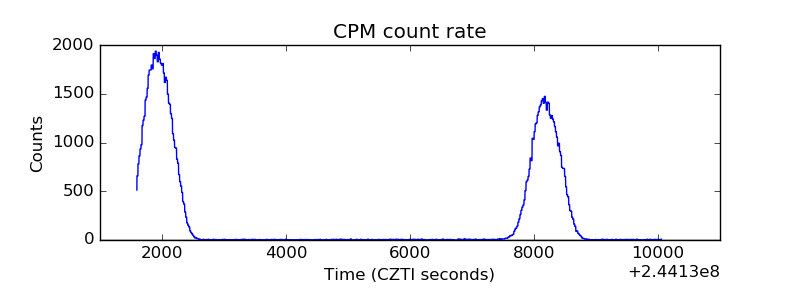 |
| CZT Counter | 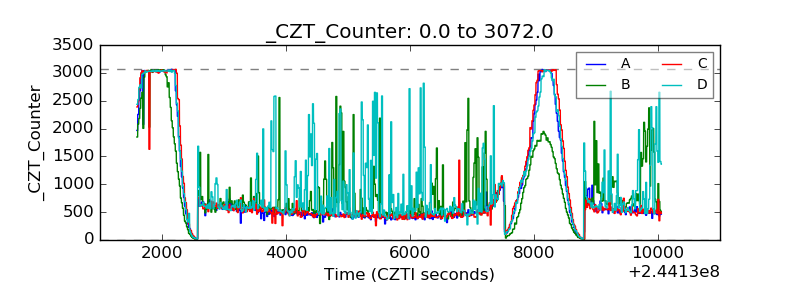 |
| +2.5 Volts monitor |  |
| +5 Volts monitor |  |
| _ROLL_ROT | 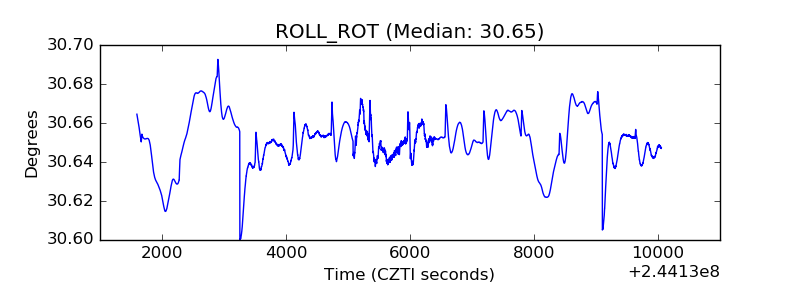 |
| _Roll_DEC | 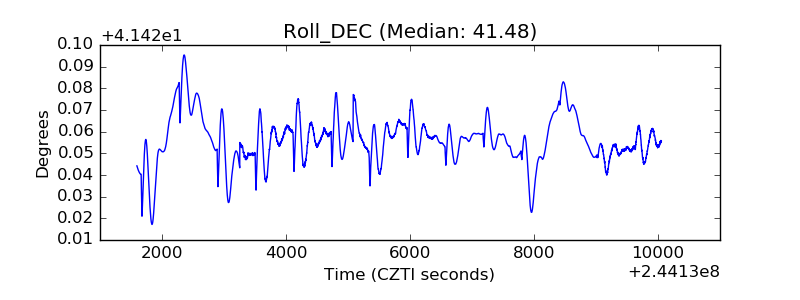 |
| _Roll_RA | 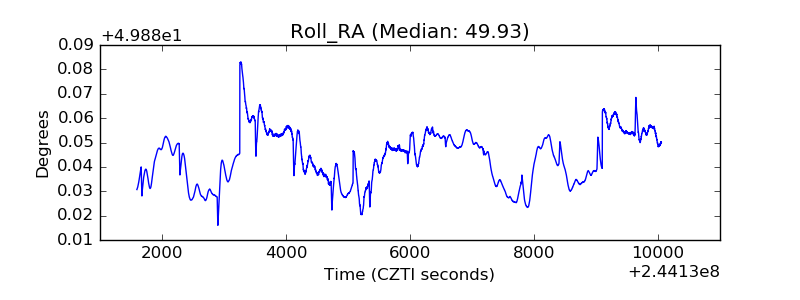 |
| Veto Counter | 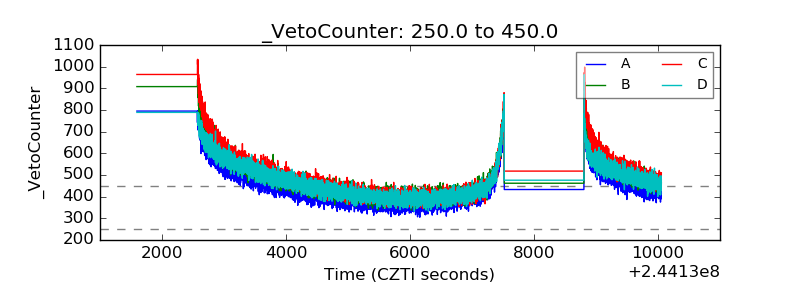 |