| Param | Original file | Final file |
|---|---|---|
| Filename | modeM0/AS1A03_071T01_9000001562_10799cztM0_level2.evt | modeM0/AS1A03_071T01_9000001562_10799cztM0_level2_quad_clean.evt |
| Size (bytes) | 571,011,840 | 93,689,280 |
| Size | 544.6 MB | 89.3 MB |
| Events in quadrant A | 3,116,833 | 602,792 |
| Events in quadrant B | 5,695,055 | 597,243 |
| Events in quadrant C | 3,090,629 | 626,891 |
| Events in quadrant D | 4,955,947 | 562,573 |
| Mode M9 | |||
|---|---|---|---|
| Quadrant | BADHDUFLAG | Total packets | Discarded packets |
| A | 0 | 12 | 0 |
| B | 0 | 12 | 0 |
| C | 0 | 12 | 0 |
| D | 0 | 12 | 0 |
| Mode M0 | |||
|---|---|---|---|
| Quadrant | BADHDUFLAG | Total packets | Discarded packets |
| A | 0 | 13532 | 3 |
| B | 0 | 21349 | 2 |
| C | 0 | 13295 | 2 |
| D | 0 | 19193 | 2 |
| Mode SS | |||
|---|---|---|---|
| Quadrant | BADHDUFLAG | Total packets | Discarded packets |
| A | 0 | 130 | 0 |
| B | 0 | 130 | 0 |
| C | 0 | 130 | 0 |
| D | 0 | 130 | 0 |
| Quadrant | Total seconds | Saturated seconds | Saturation percentage |
|---|---|---|---|
| A | 6414 | 73 | 1.138135% |
| B | 6414 | 799 | 12.457125% |
| C | 6414 | 66 | 1.028999% |
| D | 6414 | 566 | 8.824447% |
Noise dominated data is calculated using 1-second bins in cleaned event files. If a bin has >2000 counts, and if more than 50% of those come from <1% of pixels, then it is considered to be noise-dominated and hence unusable.
| Quadrant | # 1 sec bins | Bins with >0 counts | Bins with >2000 counts | High rate bins dominated by noise | Noise dominated (total time) | Noise dominated (detector-on time) | Marked lightcurve |
|---|---|---|---|---|---|---|---|
| A | 7584 | 6415 | 2 | 2 | 0.03% | 0.03% | 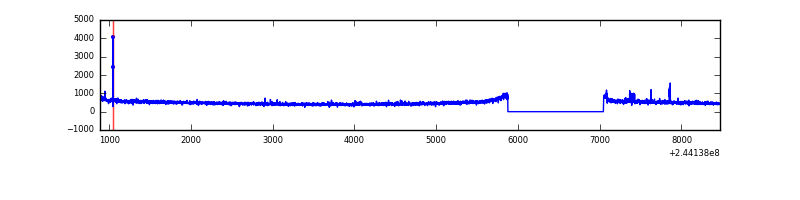 |
| B | 7584 | 6415 | 431 | 431 | 5.68% | 6.72% | 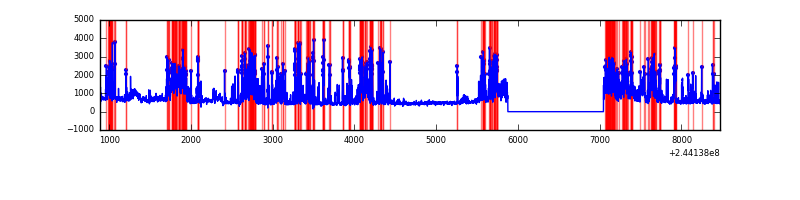 |
| C | 7584 | 6415 | 0 | 0 | 0.00% | 0.00% | 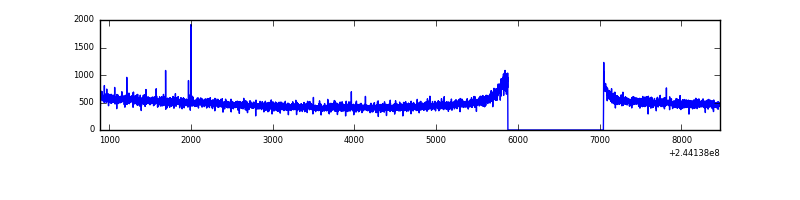 |
| D | 7584 | 6415 | 459 | 459 | 6.05% | 7.16% | 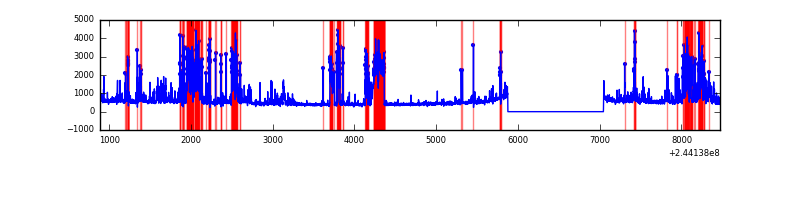 |
Top three noisy pixels from each quadrant. If the there are fewer than three noisy pixels in the level2.evt file, extra rows are filled as -1
| Pixel properties | Quadrant properties | ||||||
|---|---|---|---|---|---|---|---|
| Quadrant | DetID | PixID | Counts | Sigma | Mean | Median | Sigma |
| A | 15 | 174 | 38576 | 235.88 | 792 | 776 | 160.2 |
| A | 14 | 254 | 12461 | 72.92 | 792 | 776 | 160.2 |
| A | 8 | 15 | 11443 | 66.57 | 792 | 776 | 160.2 |
| B | 4 | 239 | 1884836 | 13052.99 | 768 | 750 | 144.3 |
| B | 0 | 85 | 400800 | 2771.55 | 768 | 750 | 144.3 |
| B | 15 | 204 | 235836 | 1628.68 | 768 | 750 | 144.3 |
| C | 13 | 61 | 5779 | 27.48 | 790 | 794 | 181.4 |
| C | 14 | 234 | 5667 | 26.86 | 790 | 794 | 181.4 |
| C | 14 | 67 | 2909 | 11.66 | 790 | 794 | 181.4 |
| D | 9 | 85 | 590143 | 3265.0 | 755 | 737 | 180.5 |
| D | 13 | 138 | 439531 | 2430.69 | 755 | 737 | 180.5 |
| D | 10 | 253 | 362016 | 2001.29 | 755 | 737 | 180.5 |
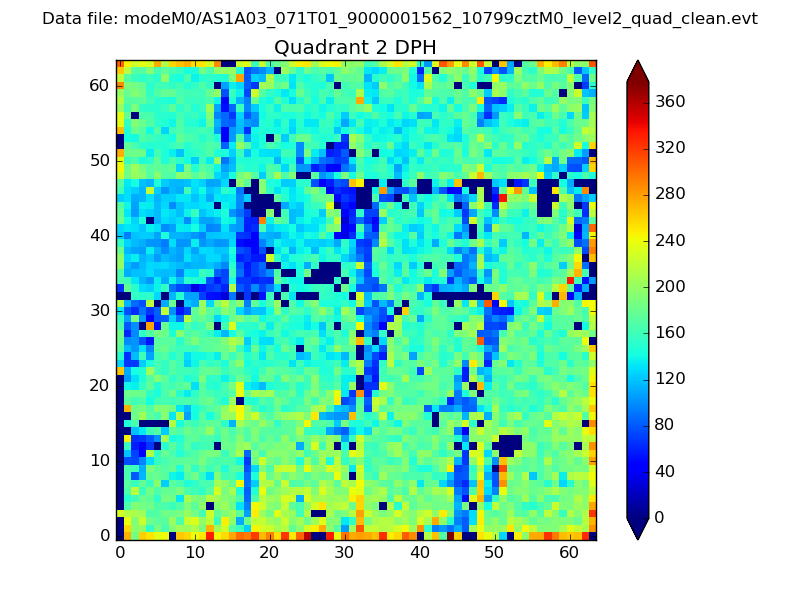
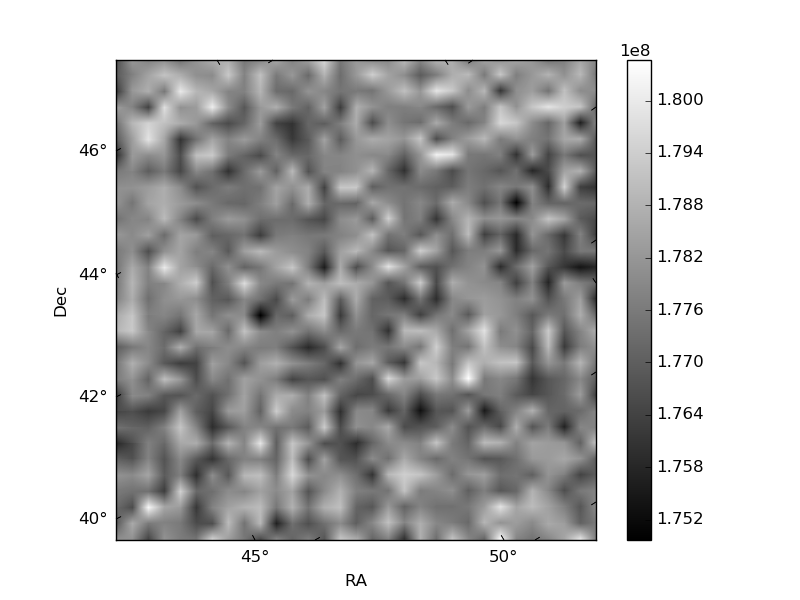
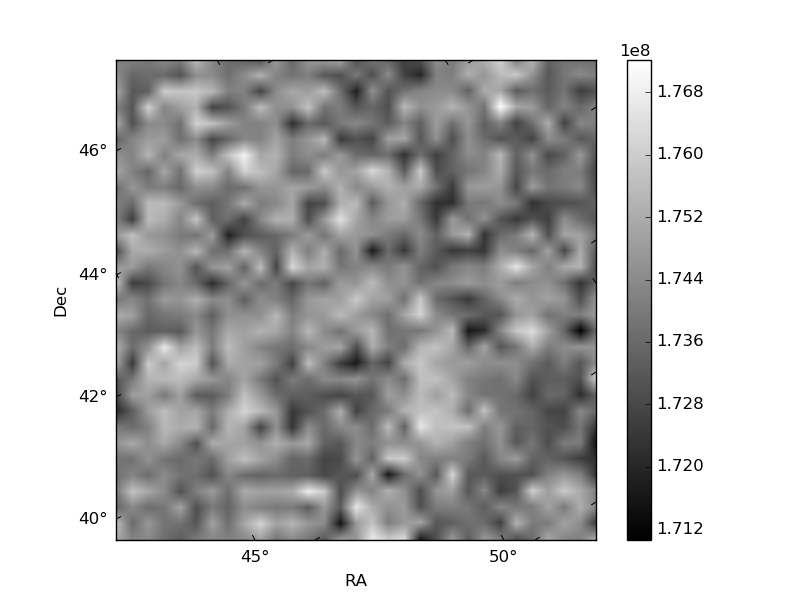
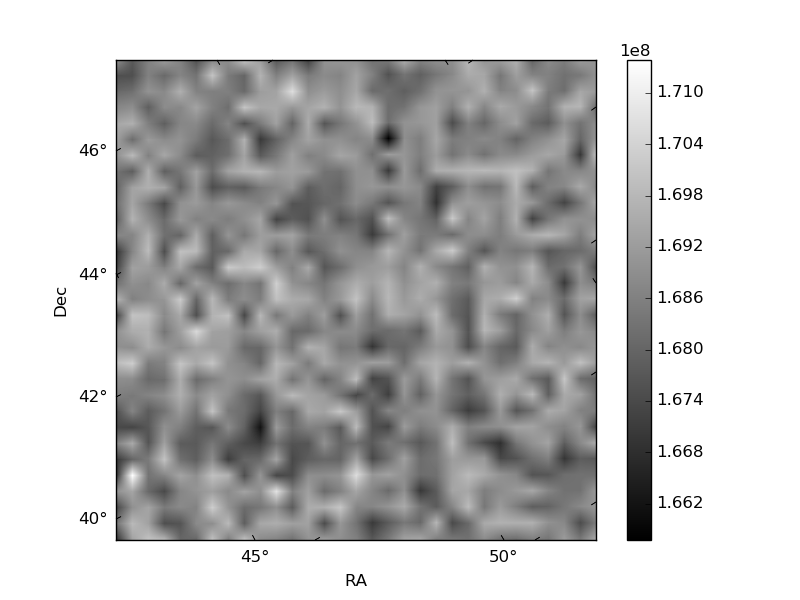
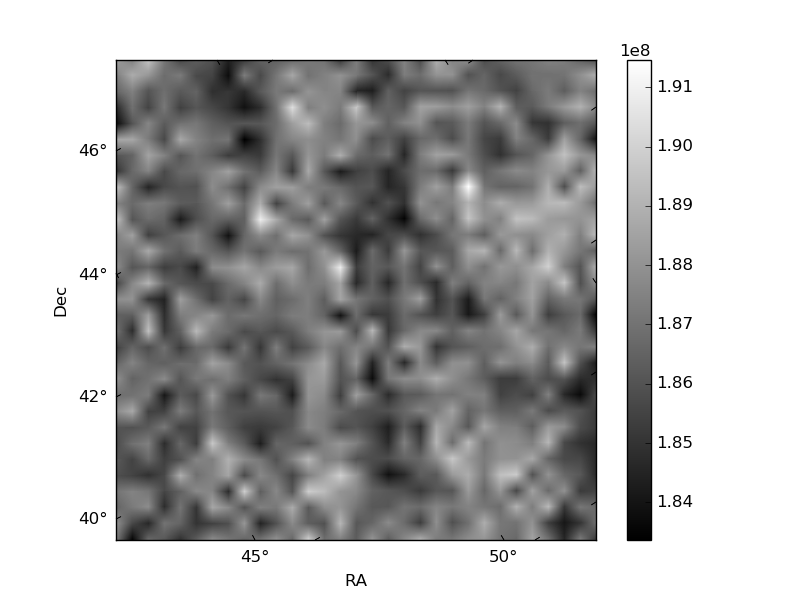
Histogram calculated using DETX and DETY for each event in the final _common_clean file
| Quadrant A | 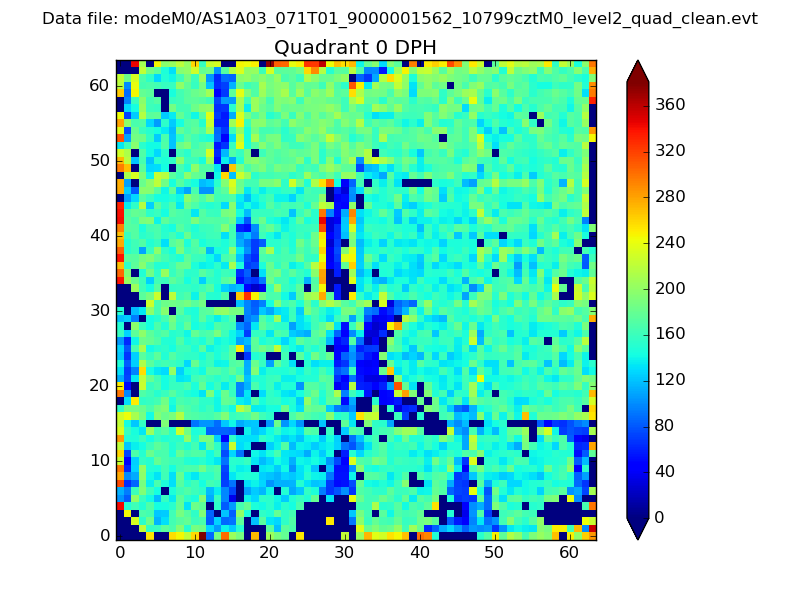 |
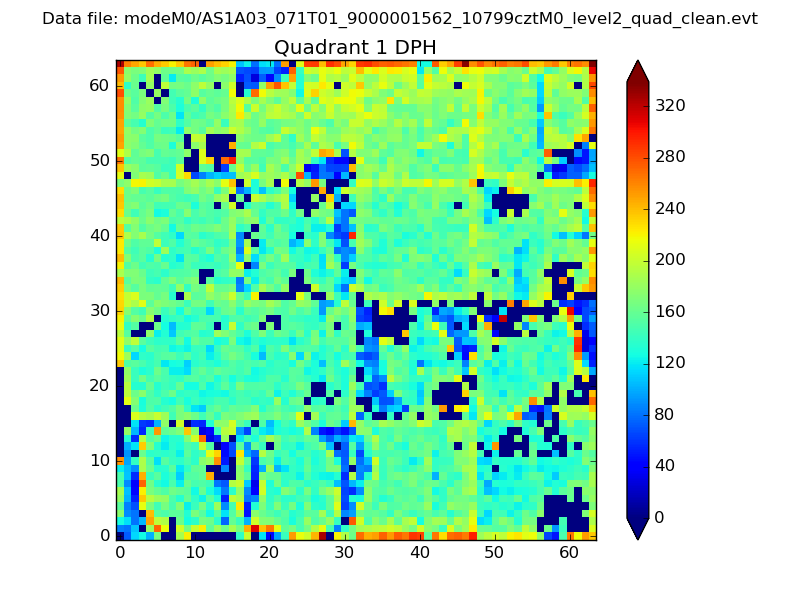 |
Quadrant B |
|---|---|---|---|
| Quadrant D | 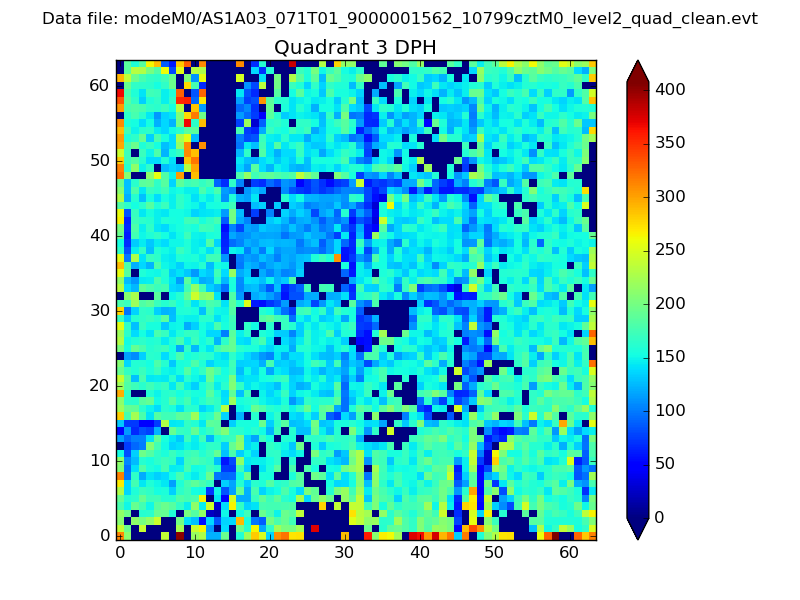 |
 |
Quadrant C |
| Plot type | Count rate plots | Images |
|---|---|---|
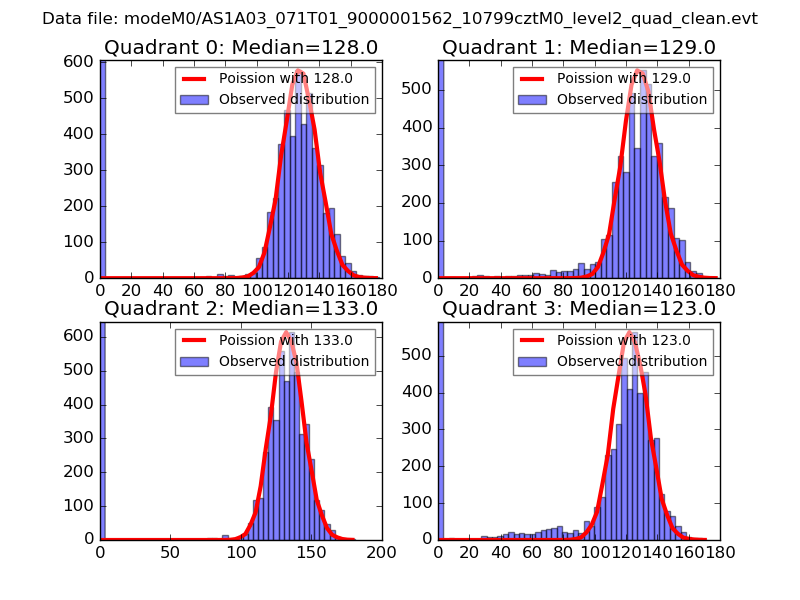
| Comparison with Poisson distribution Blue bars denote a histogram of data divided into 1 sec bins. Red curve is a Poisson curve with rate = median count rate of data. |
 |
 |
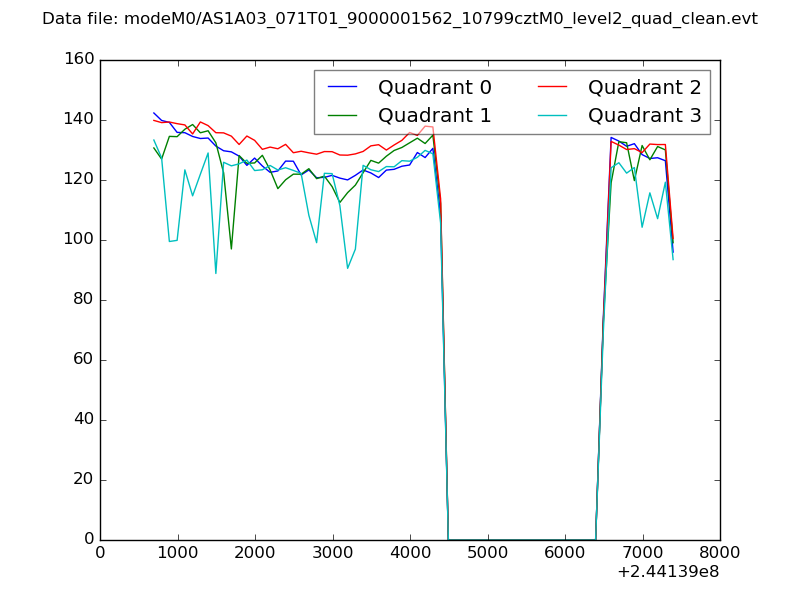
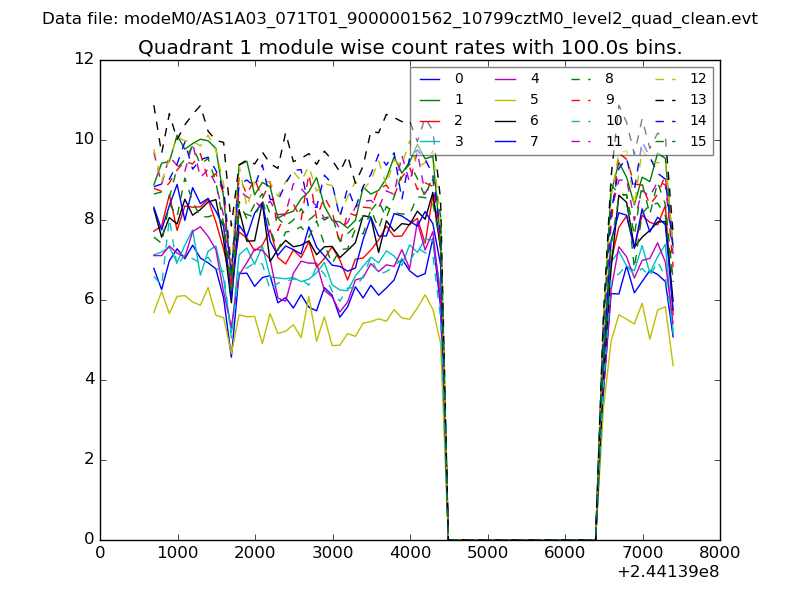
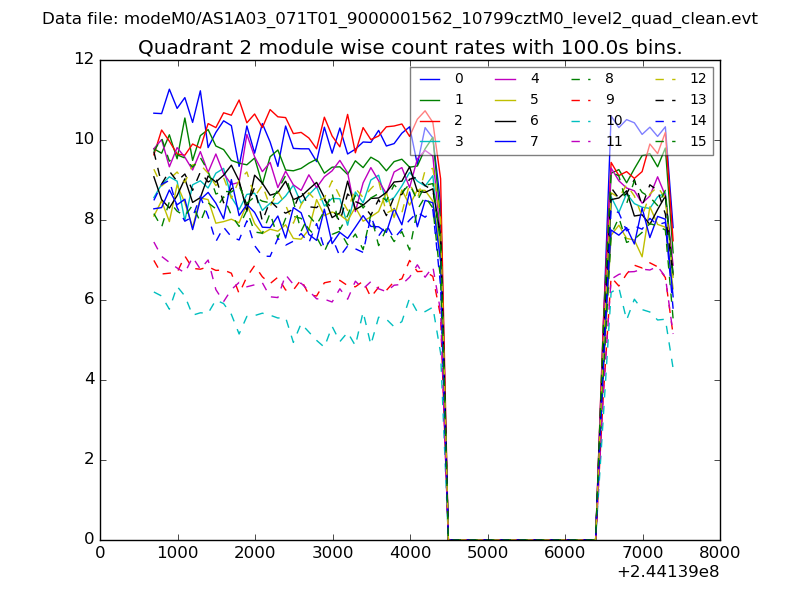
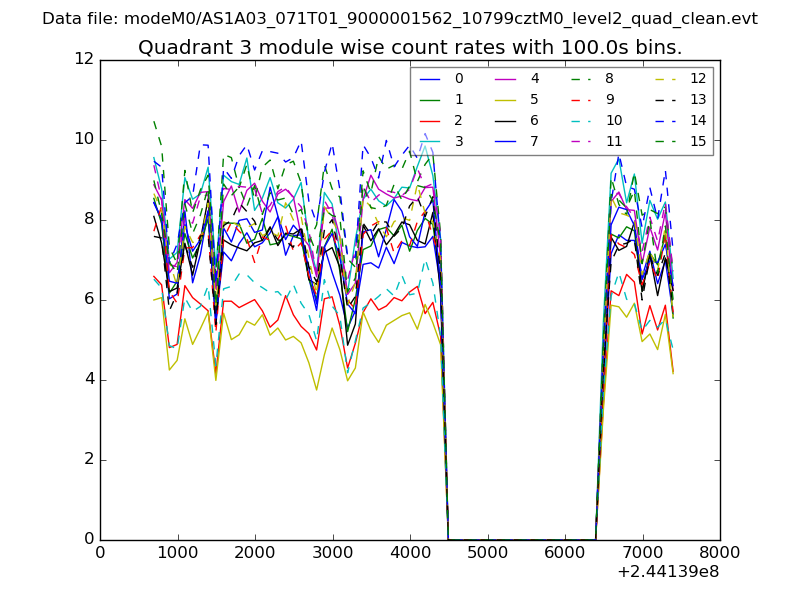
| Quadrant-wise count rates Data is divided into 100 sec bins |
 |
|
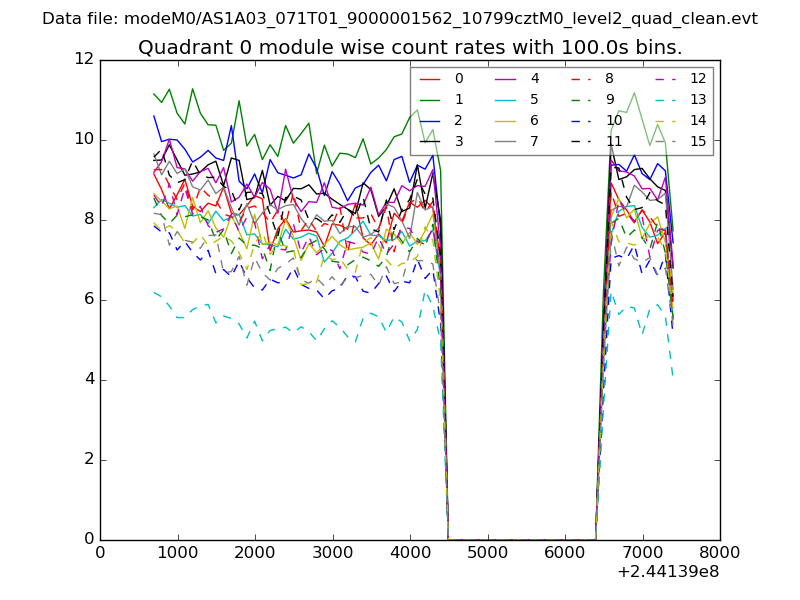
| Module-wise count rates for Quadrant A Data is divided into 100 sec bins |
 |
 |
| Module-wise count rates for Quadrant B Data is divided into 100 sec bins |
 |
 |
| Module-wise count rates for Quadrant C Data is divided into 100 sec bins |
 |
 |
| Module-wise count rates for Quadrant D Data is divided into 100 sec bins |
 |
 |
| Parameter | Plot |
|---|---|
| CZT HV Monitor | 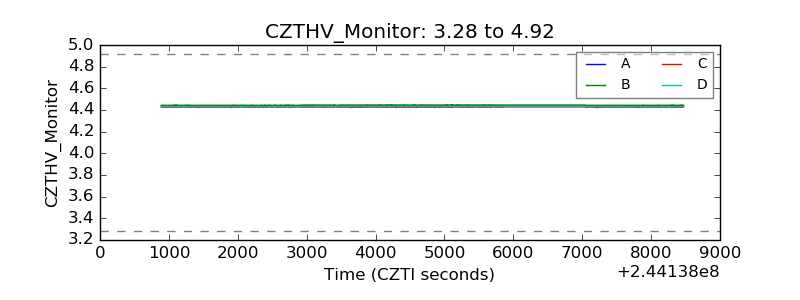 |
| D_VDD |  |
| Temperature 1 | 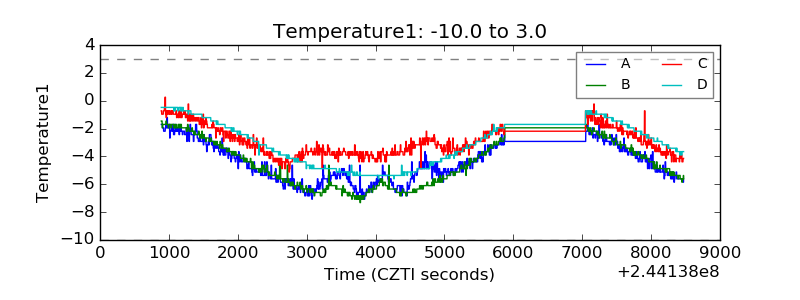 |
| Veto HV Monitor | 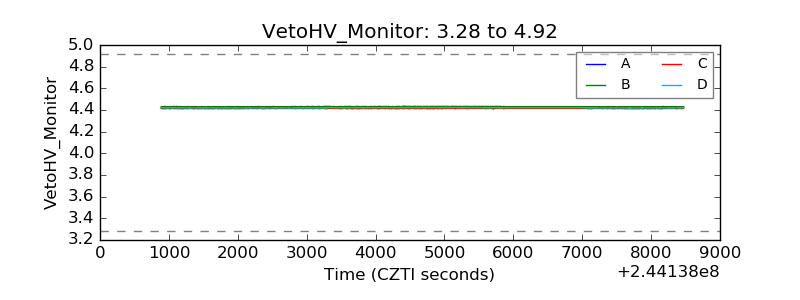 |
| Veto LLD | 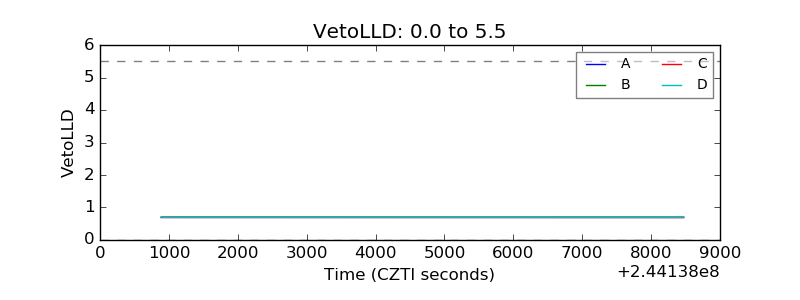 |
| Alpha Counter | 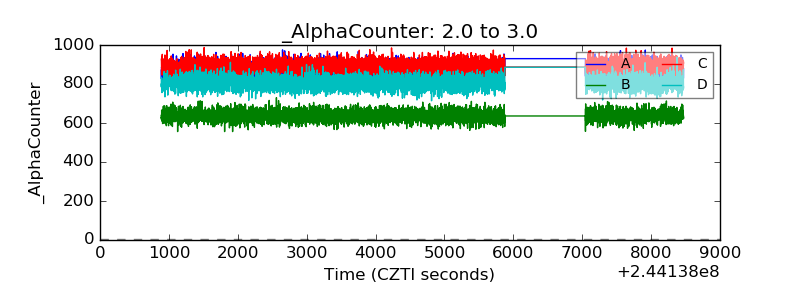 |
| _CPM_Rate | 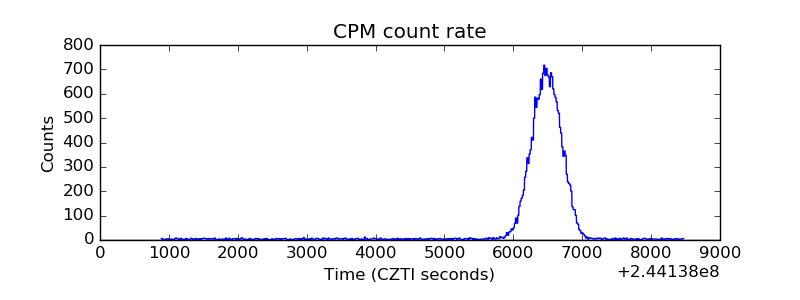 |
| CZT Counter | 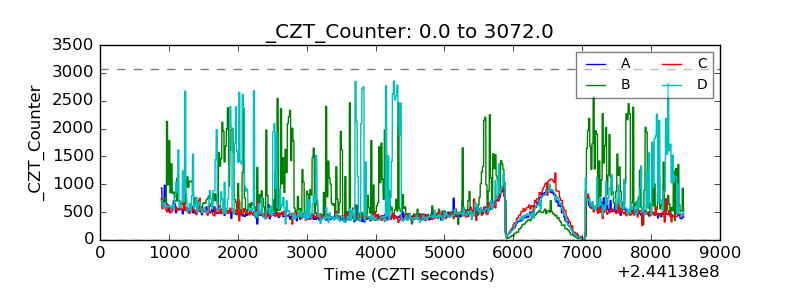 |
| +2.5 Volts monitor |  |
| +5 Volts monitor |  |
| _ROLL_ROT | 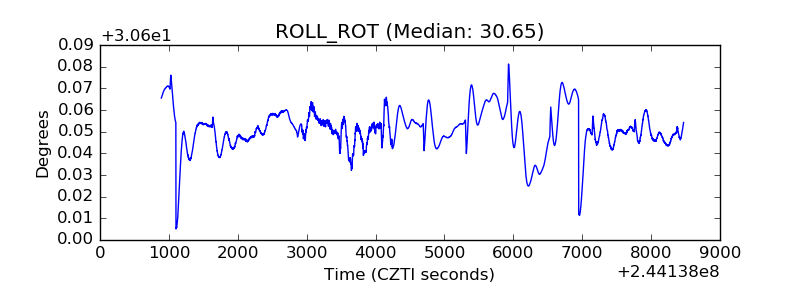 |
| _Roll_DEC | 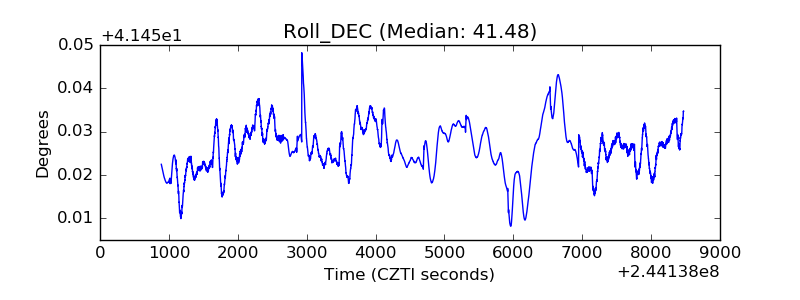 |
| _Roll_RA | 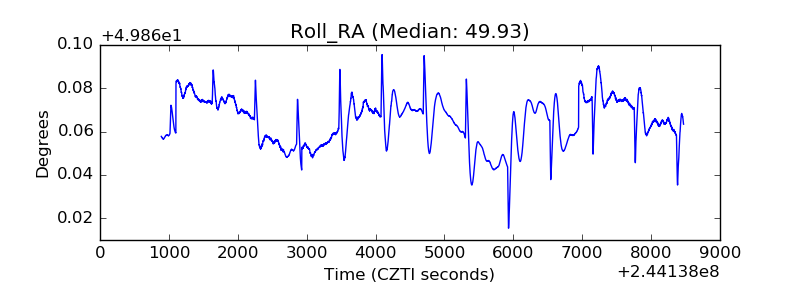 |
| Veto Counter | 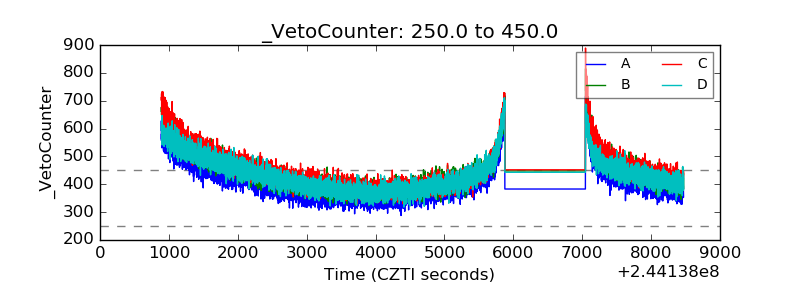 |