| Param | Original file | Final file |
|---|---|---|
| Filename | modeM0/AS1A03_071T01_9000001562_10800cztM0_level2.evt | modeM0/AS1A03_071T01_9000001562_10800cztM0_level2_quad_clean.evt |
| Size (bytes) | 265,872,960 | 44,942,400 |
| Size | 253.6 MB | 42.9 MB |
| Events in quadrant A | 1,714,329 | 309,935 |
| Events in quadrant B | 2,634,016 | 210,085 |
| Events in quadrant C | 1,667,526 | 318,878 |
| Events in quadrant D | 1,805,198 | 283,039 |
| Mode M9 | |||
|---|---|---|---|
| Quadrant | BADHDUFLAG | Total packets | Discarded packets |
| A | 0 | 21 | 7 |
| B | 0 | 21 | 7 |
| C | 0 | 21 | 7 |
| D | 0 | 21 | 6 |
| Mode M0 | |||
|---|---|---|---|
| Quadrant | BADHDUFLAG | Total packets | Discarded packets |
| A | 0 | 15185 | 7635 |
| B | 0 | 31580 | 22017 |
| C | 0 | 14918 | 7498 |
| D | 0 | 18798 | 11123 |
| Mode SS | |||
|---|---|---|---|
| Quadrant | BADHDUFLAG | Total packets | Discarded packets |
| A | 0 | 148 | 68 |
| B | 0 | 148 | 74 |
| C | 0 | 148 | 66 |
| D | 0 | 148 | 72 |
| Quadrant | Total seconds | Saturated seconds | Saturation percentage |
|---|---|---|---|
| A | 3632 | 32 | 0.881057% |
| B | 2623 | 490 | 18.680900% |
| C | 3625 | 30 | 0.827586% |
| D | 3347 | 37 | 1.105468% |
Noise dominated data is calculated using 1-second bins in cleaned event files. If a bin has >2000 counts, and if more than 50% of those come from <1% of pixels, then it is considered to be noise-dominated and hence unusable.
| Quadrant | # 1 sec bins | Bins with >0 counts | Bins with >2000 counts | High rate bins dominated by noise | Noise dominated (total time) | Noise dominated (detector-on time) | Marked lightcurve |
|---|---|---|---|---|---|---|---|
| A | 9282 | 4877 | 0 | 0 | 0.00% | 0.00% | 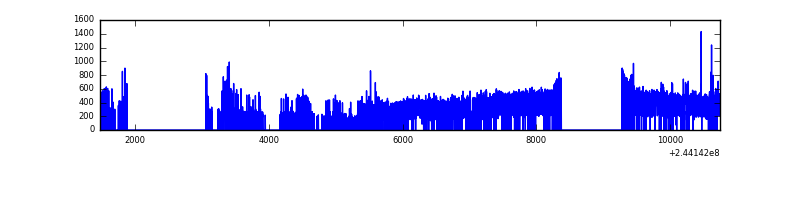 |
| B | 9278 | 3554 | 308 | 308 | 3.32% | 8.67% | 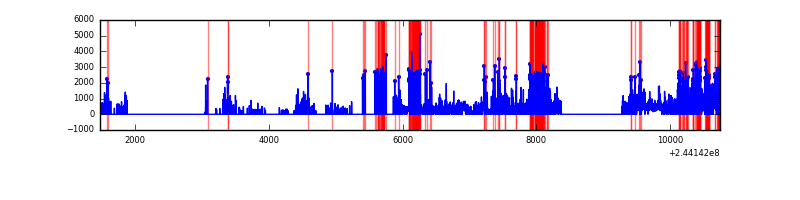 |
| C | 9282 | 4887 | 0 | 0 | 0.00% | 0.00% | 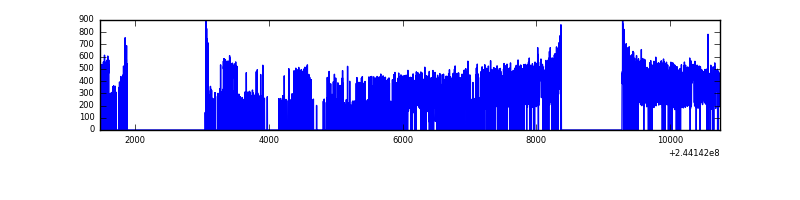 |
| D | 9281 | 4561 | 12 | 12 | 0.13% | 0.26% | 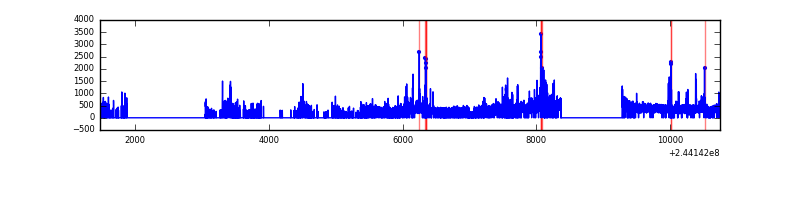 |
Top three noisy pixels from each quadrant. If the there are fewer than three noisy pixels in the level2.evt file, extra rows are filled as -1
| Pixel properties | Quadrant properties | ||||||
|---|---|---|---|---|---|---|---|
| Quadrant | DetID | PixID | Counts | Sigma | Mean | Median | Sigma |
| A | 15 | 174 | 14735 | 160.34 | 432 | 422 | 89.3 |
| A | 13 | 251 | 12771 | 138.34 | 432 | 422 | 89.3 |
| A | 8 | 5 | 10915 | 117.55 | 432 | 422 | 89.3 |
| B | 0 | 85 | 664183 | 11798.23 | 287 | 280 | 56.3 |
| B | 4 | 239 | 536135 | 9522.68 | 287 | 280 | 56.3 |
| B | 4 | 81 | 223403 | 3965.12 | 287 | 280 | 56.3 |
| C | 13 | 61 | 3146 | 27.15 | 427 | 429 | 100.1 |
| C | 12 | 4 | 1643 | 12.13 | 427 | 429 | 100.1 |
| C | 14 | 234 | 1442 | 10.12 | 427 | 429 | 100.1 |
| D | 13 | 138 | 102520 | 1082.88 | 388 | 378 | 94.3 |
| D | 12 | 233 | 96839 | 1022.65 | 388 | 378 | 94.3 |
| D | 9 | 85 | 61894 | 652.17 | 388 | 378 | 94.3 |
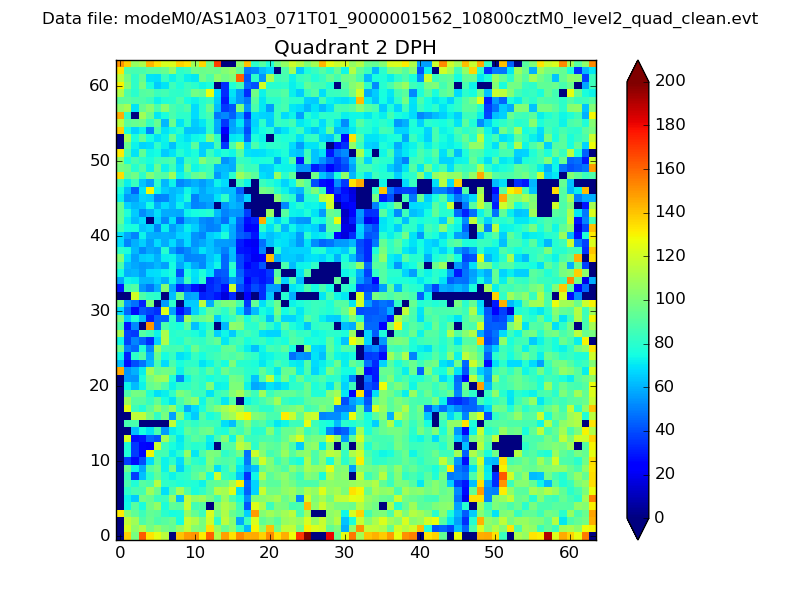
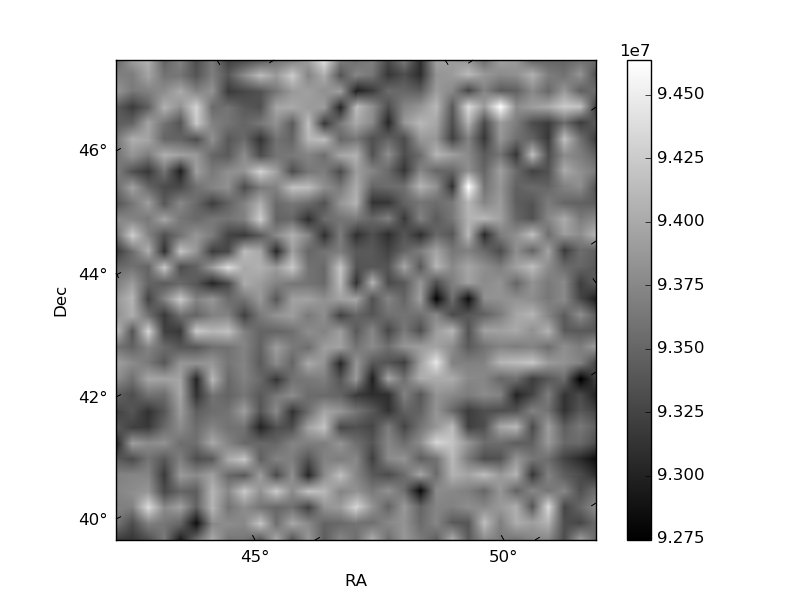
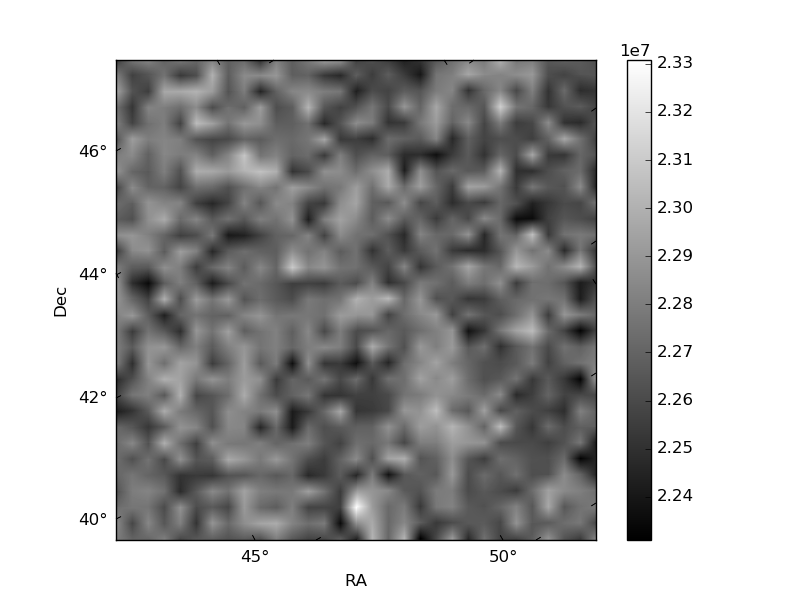
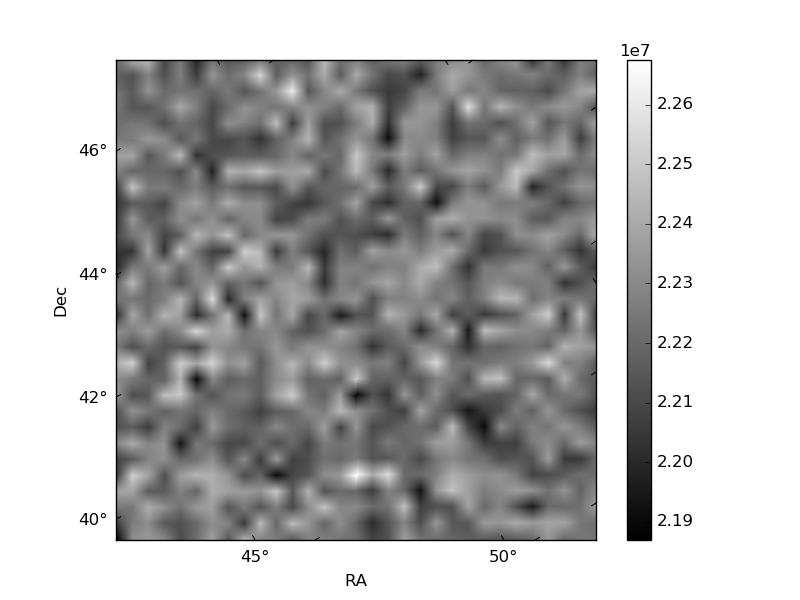
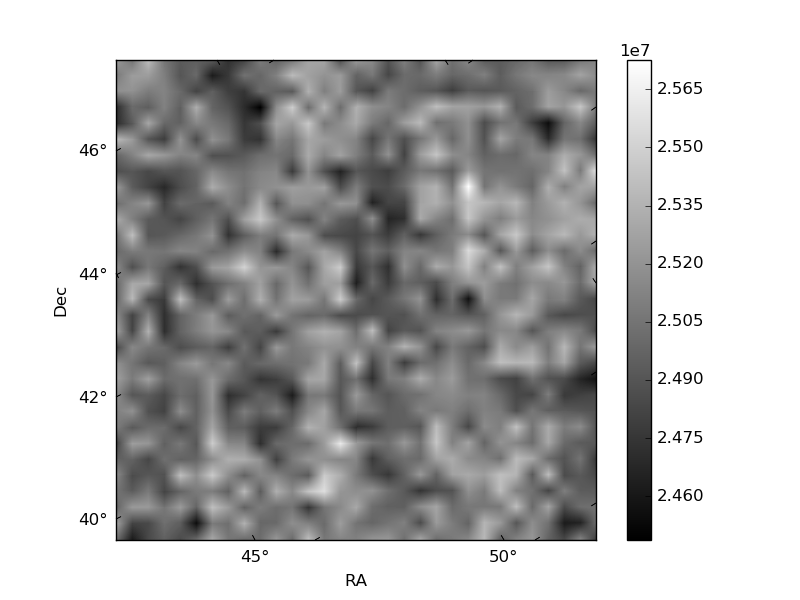
Histogram calculated using DETX and DETY for each event in the final _common_clean file
| Quadrant A | 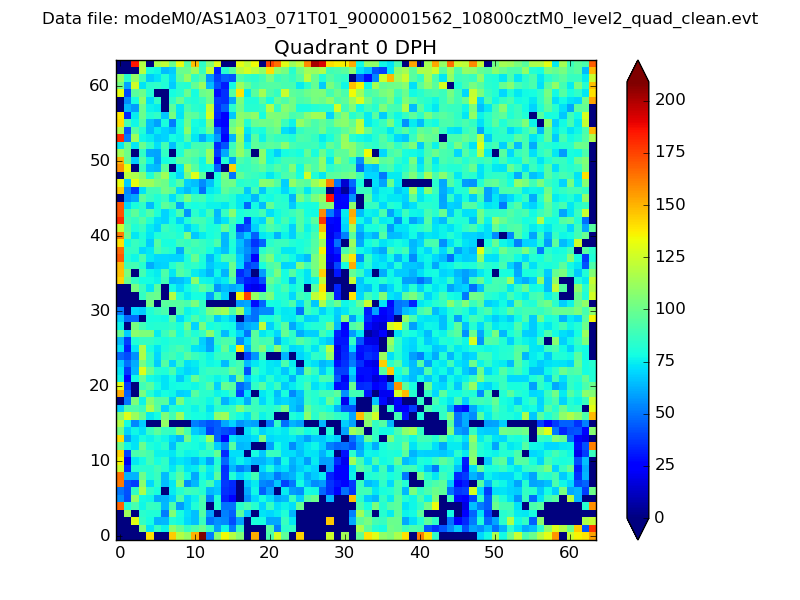 |
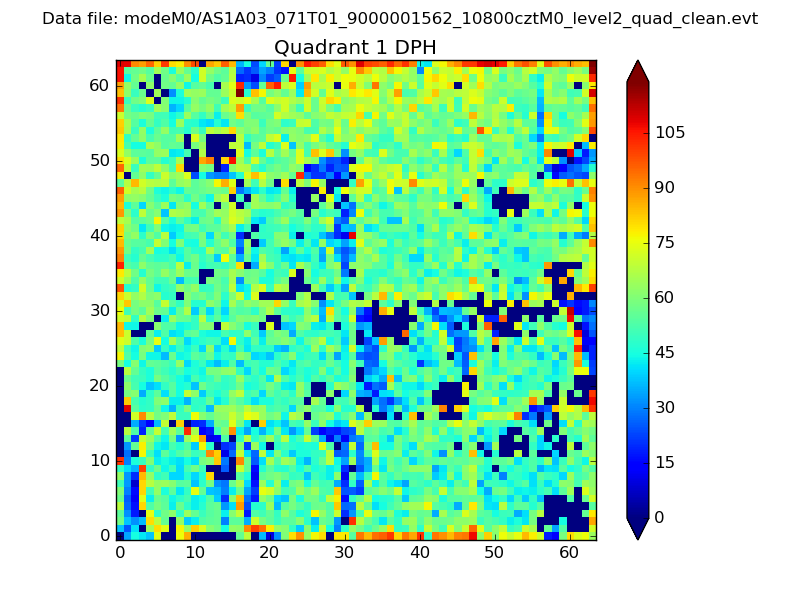 |
Quadrant B |
|---|---|---|---|
| Quadrant D | 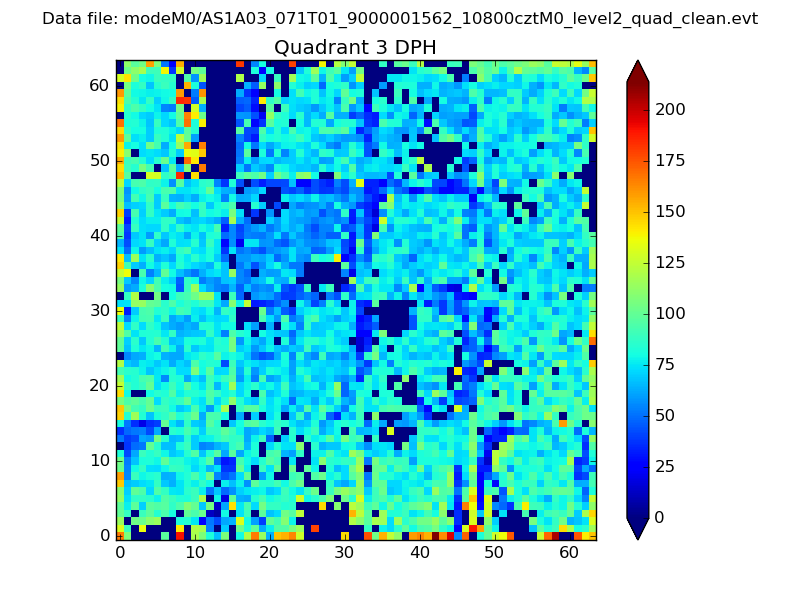 |
 |
Quadrant C |
| Plot type | Count rate plots | Images |
|---|---|---|
| Comparison with Poisson distribution Blue bars denote a histogram of data divided into 1 sec bins. Red curve is a Poisson curve with rate = median count rate of data. |
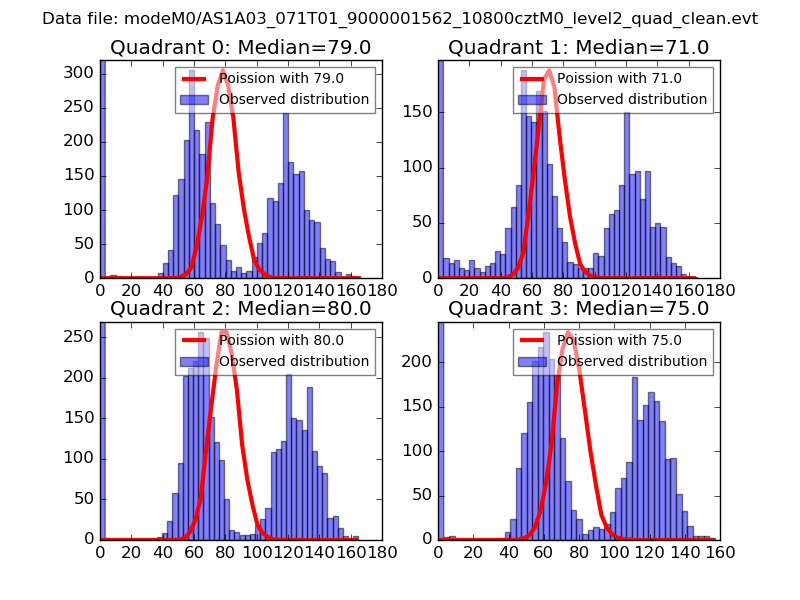 |
 |
| Quadrant-wise count rates Data is divided into 100 sec bins |
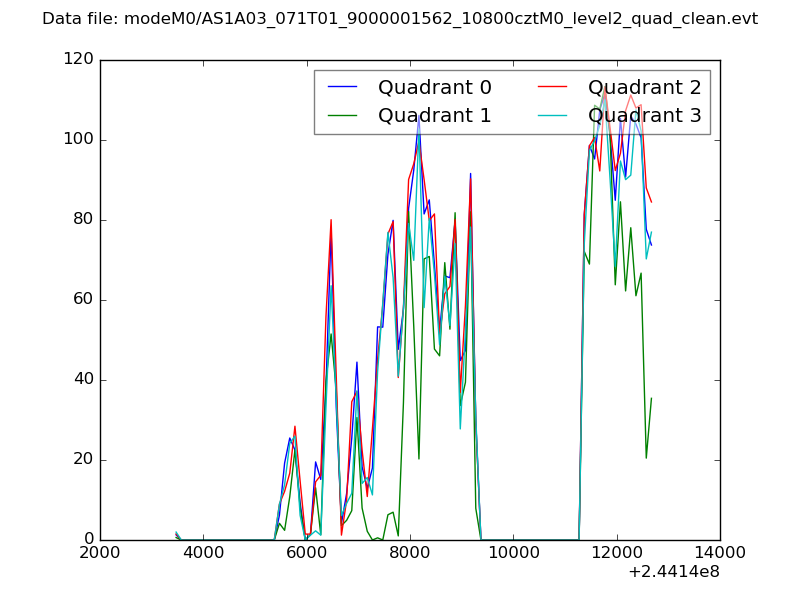 |
|
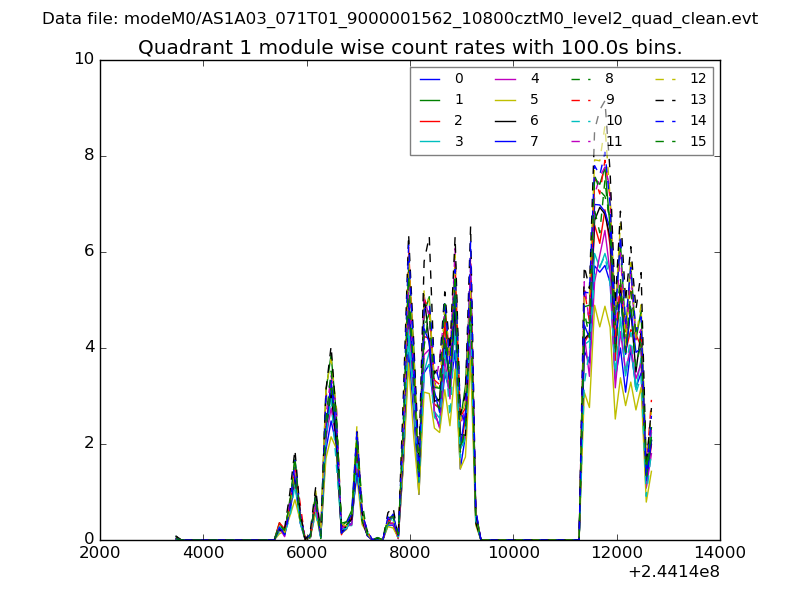
| Module-wise count rates for Quadrant A Data is divided into 100 sec bins |
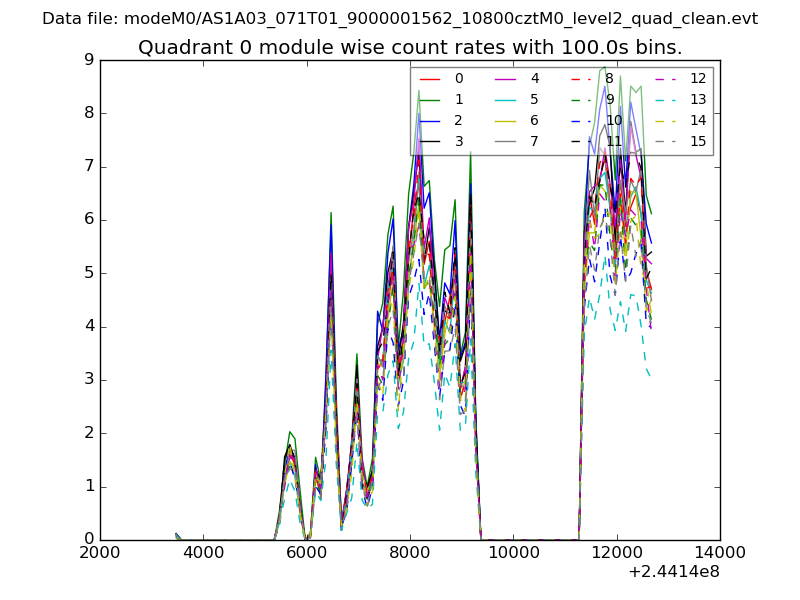 |
 |
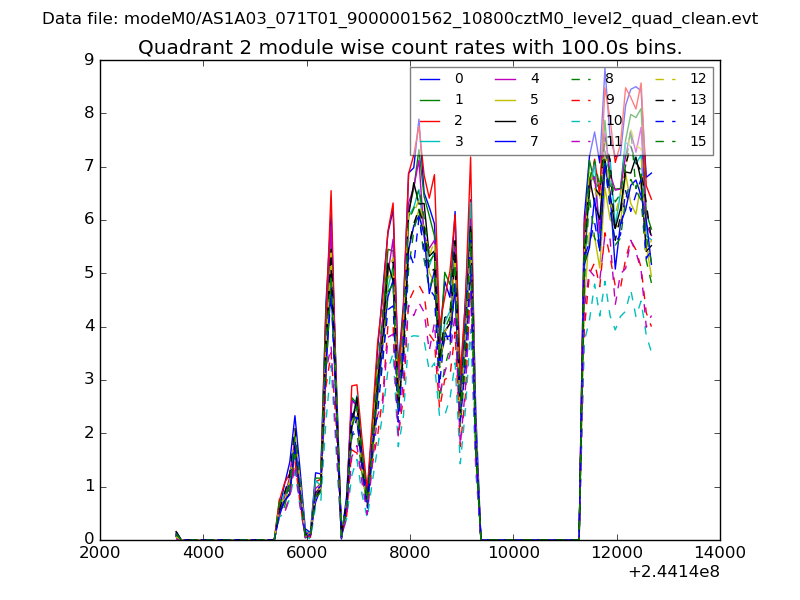
| Module-wise count rates for Quadrant B Data is divided into 100 sec bins |
 |
 |
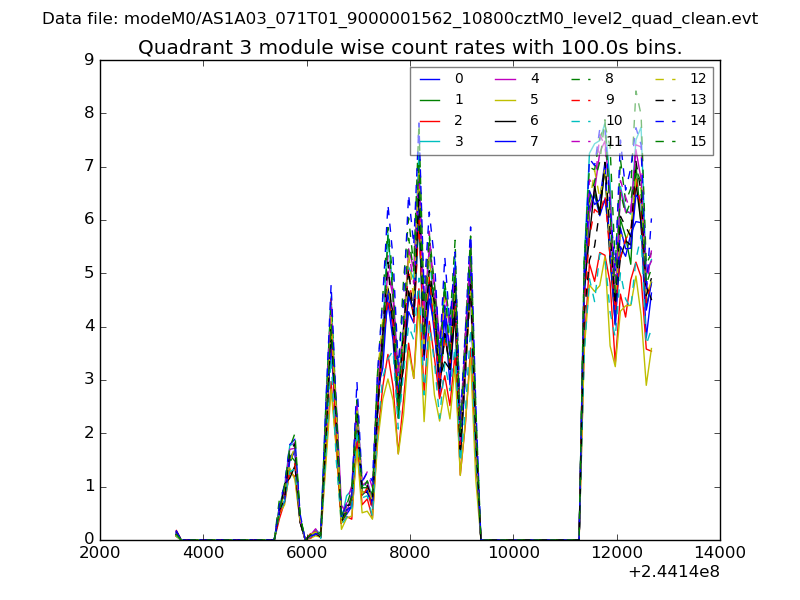
| Module-wise count rates for Quadrant C Data is divided into 100 sec bins |
 |
 |
| Module-wise count rates for Quadrant D Data is divided into 100 sec bins |
 |
 |
| Parameter | Plot |
|---|---|
| CZT HV Monitor | 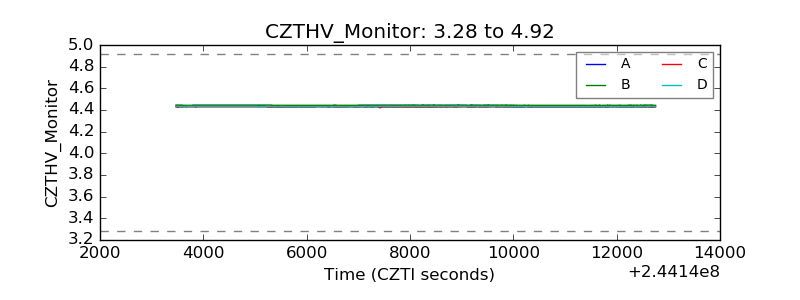 |
| D_VDD |  |
| Temperature 1 | 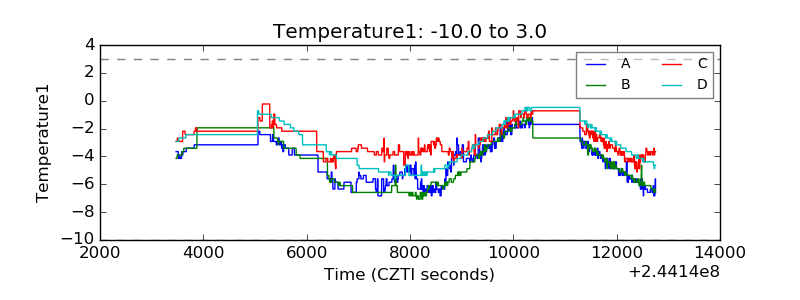 |
| Veto HV Monitor | 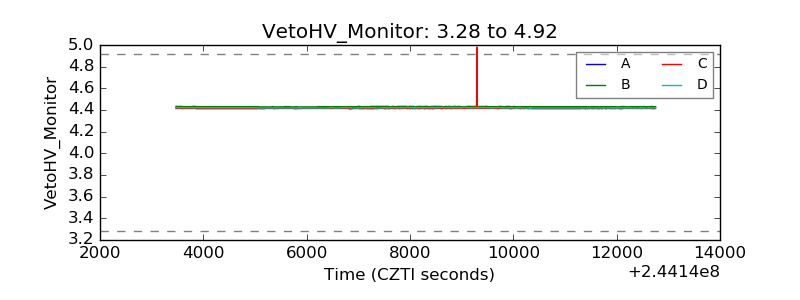 |
| Veto LLD | 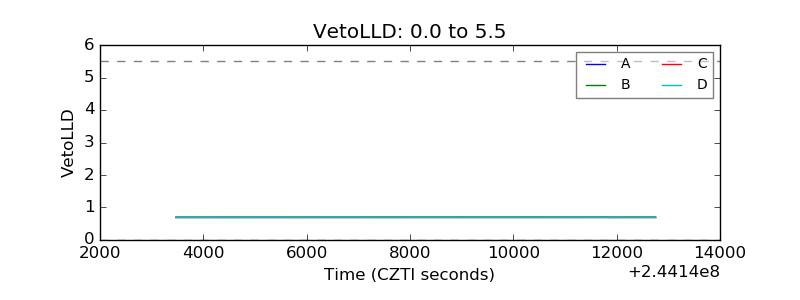 |
| Alpha Counter | 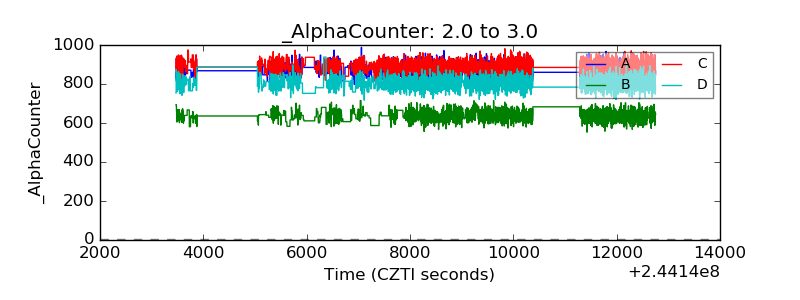 |
| _CPM_Rate | 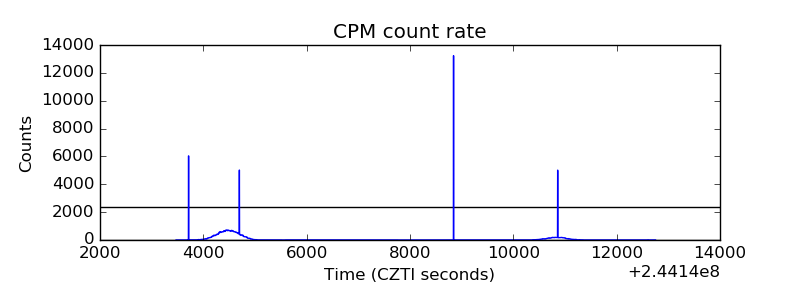 |
| CZT Counter | 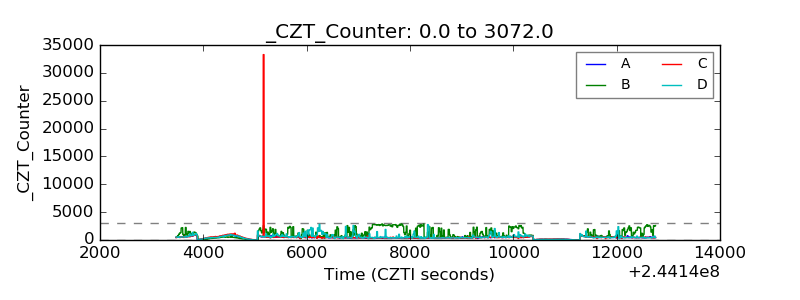 |
| +2.5 Volts monitor |  |
| +5 Volts monitor |  |
| _ROLL_ROT | 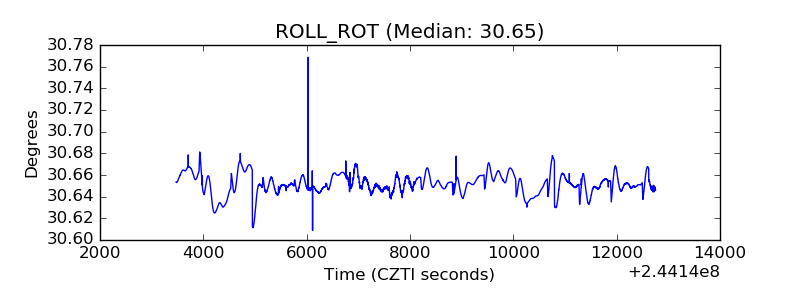 |
| _Roll_DEC | 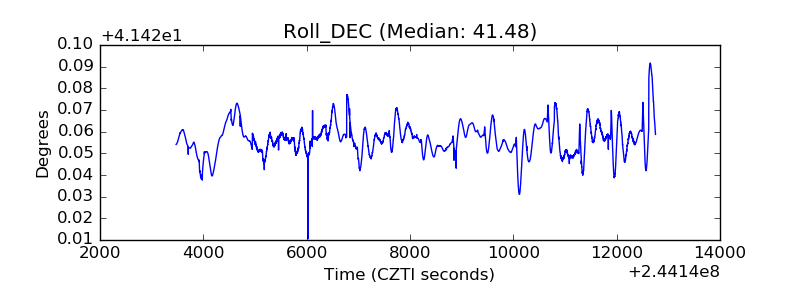 |
| _Roll_RA | 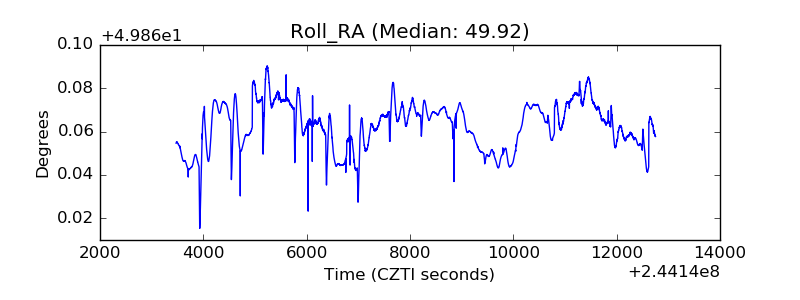 |
| Veto Counter | 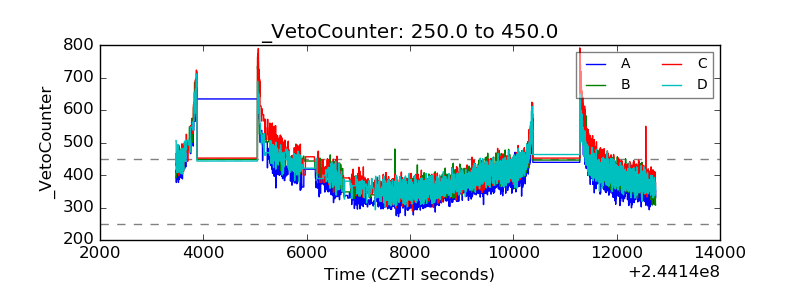 |