| Param | Original file | Final file |
|---|---|---|
| Filename | modeM0/AS1A03_071T01_9000001562_10802cztM0_level2.evt | modeM0/AS1A03_071T01_9000001562_10802cztM0_level2_quad_clean.evt |
| Size (bytes) | 19,808,640 | 5,745,600 |
| Size | 18.9 MB | 5.5 MB |
| Events in quadrant A | 159,683 | 39,107 |
| Events in quadrant B | 111,160 | 23,526 |
| Events in quadrant C | 164,401 | 43,746 |
| Events in quadrant D | 139,492 | 36,724 |
| Mode M9 | |||
|---|---|---|---|
| Quadrant | BADHDUFLAG | Total packets | Discarded packets |
| A | 0 | 9 | 8 |
| B | 0 | 10 | 7 |
| C | 0 | 10 | 10 |
| D | 0 | 9 | 7 |
| Mode M0 | |||
|---|---|---|---|
| Quadrant | BADHDUFLAG | Total packets | Discarded packets |
| A | 0 | 21748 | 21063 |
| B | 0 | 36154 | 35701 |
| C | 0 | 18667 | 17918 |
| D | 0 | 23216 | 22571 |
| Mode SS | |||
|---|---|---|---|
| Quadrant | BADHDUFLAG | Total packets | Discarded packets |
| A | 0 | 181 | 173 |
| B | 0 | 189 | 177 |
| C | 0 | 188 | 182 |
| D | 0 | 188 | 182 |
| Quadrant | Total seconds | Saturated seconds | Saturation percentage |
|---|---|---|---|
| A | 336 | 0 | 0.000000% |
| B | 197 | 1 | 0.507614% |
| C | 372 | 0 | 0.000000% |
| D | 319 | 0 | 0.000000% |
Noise dominated data is calculated using 1-second bins in cleaned event files. If a bin has >2000 counts, and if more than 50% of those come from <1% of pixels, then it is considered to be noise-dominated and hence unusable.
| Quadrant | # 1 sec bins | Bins with >0 counts | Bins with >2000 counts | High rate bins dominated by noise | Noise dominated (total time) | Noise dominated (detector-on time) | Marked lightcurve |
|---|---|---|---|---|---|---|---|
| A | 6467 | 596 | 0 | 0 | 0.00% | 0.00% | 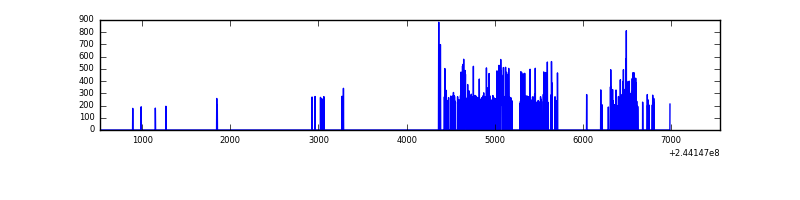 |
| B | 6246 | 357 | 0 | 0 | 0.00% | 0.00% | 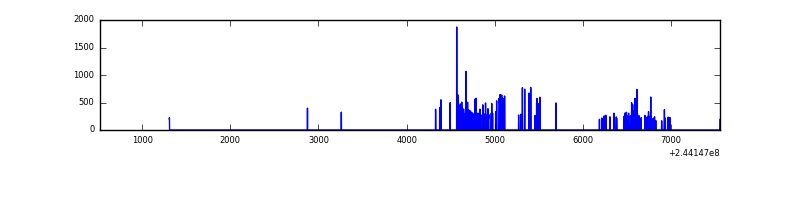 |
| C | 6828 | 663 | 0 | 0 | 0.00% | 0.00% | 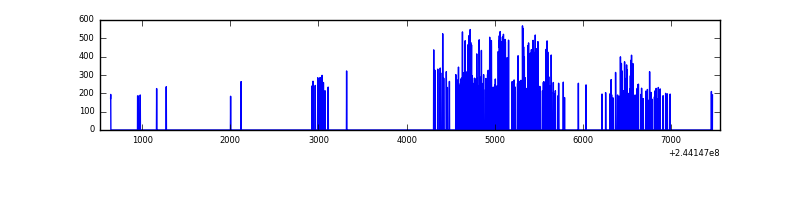 |
| D | 6388 | 574 | 0 | 0 | 0.00% | 0.00% | 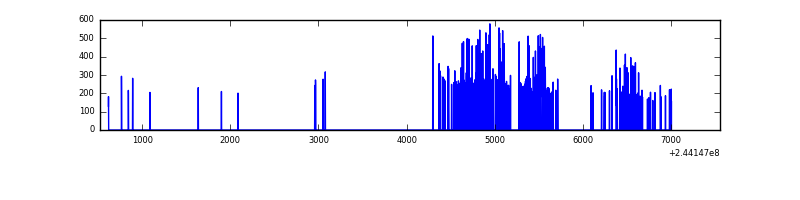 |
Top three noisy pixels from each quadrant. If the there are fewer than three noisy pixels in the level2.evt file, extra rows are filled as -1
| Pixel properties | Quadrant properties | ||||||
|---|---|---|---|---|---|---|---|
| Quadrant | DetID | PixID | Counts | Sigma | Mean | Median | Sigma |
| A | 8 | 5 | 8424 | 848.43 | 38 | 37 | 9.9 |
| A | 13 | 251 | 2036 | 202.22 | 38 | 37 | 9.9 |
| A | 15 | 174 | 609 | 57.86 | 38 | 37 | 9.9 |
| B | 4 | 239 | 12532 | 1991.02 | 22 | 21 | 6.3 |
| B | 4 | 81 | 6188 | 981.43 | 22 | 21 | 6.3 |
| B | 15 | 204 | 2350 | 370.64 | 22 | 21 | 6.3 |
| C | 13 | 61 | 319 | 23.57 | 42 | 42 | 11.8 |
| C | 7 | 247 | 143 | 8.59 | 42 | 42 | 11.8 |
| C | 8 | 222 | 112 | 5.96 | 42 | 42 | 11.8 |
| D | 13 | 138 | 3052 | 288.56 | 35 | 34 | 10.5 |
| D | 2 | 234 | 1410 | 131.56 | 35 | 34 | 10.5 |
| D | 8 | 195 | 1370 | 127.74 | 35 | 34 | 10.5 |
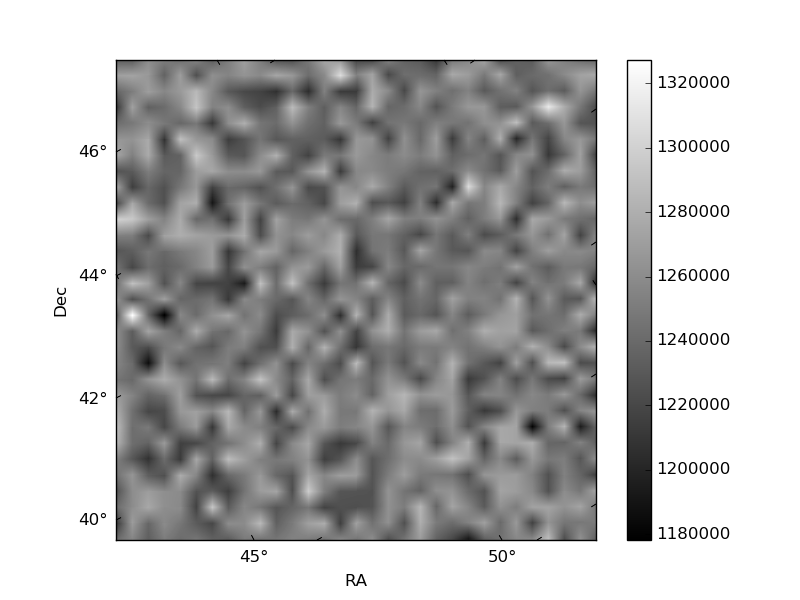
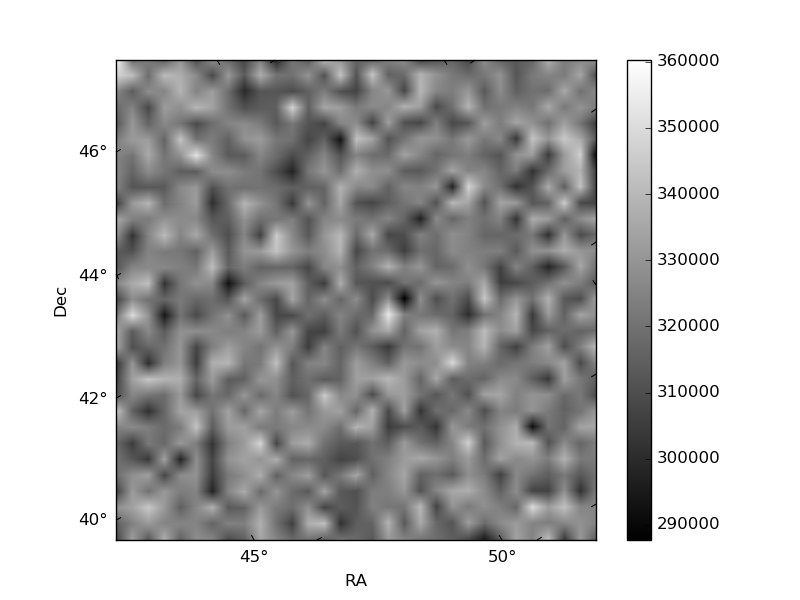
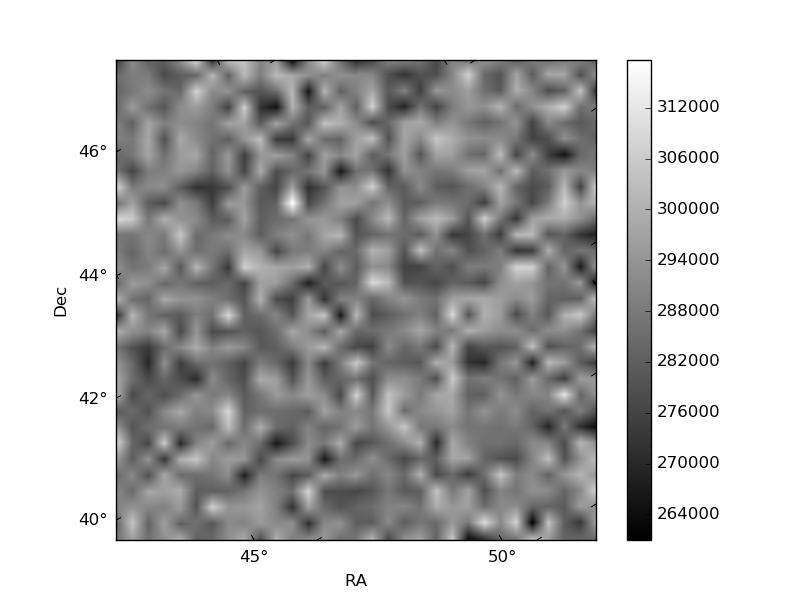
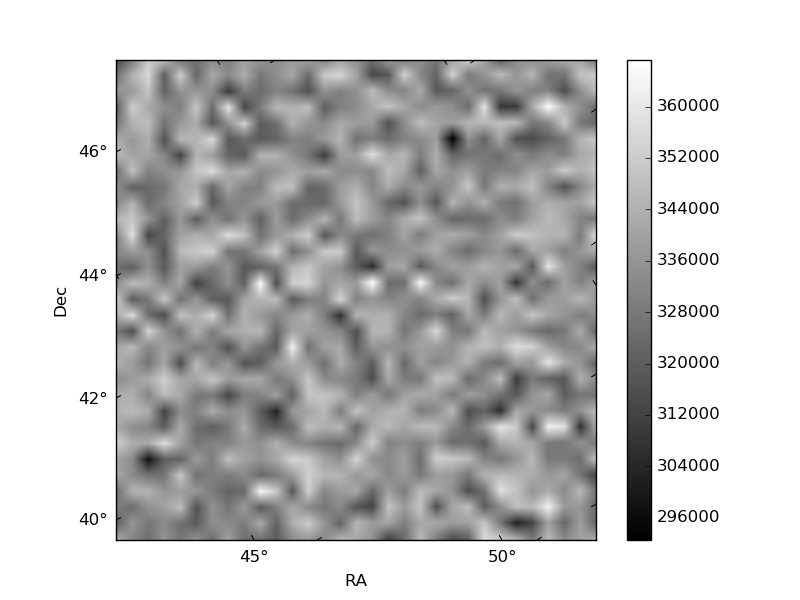
Histogram calculated using DETX and DETY for each event in the final _common_clean file
| Quadrant A | 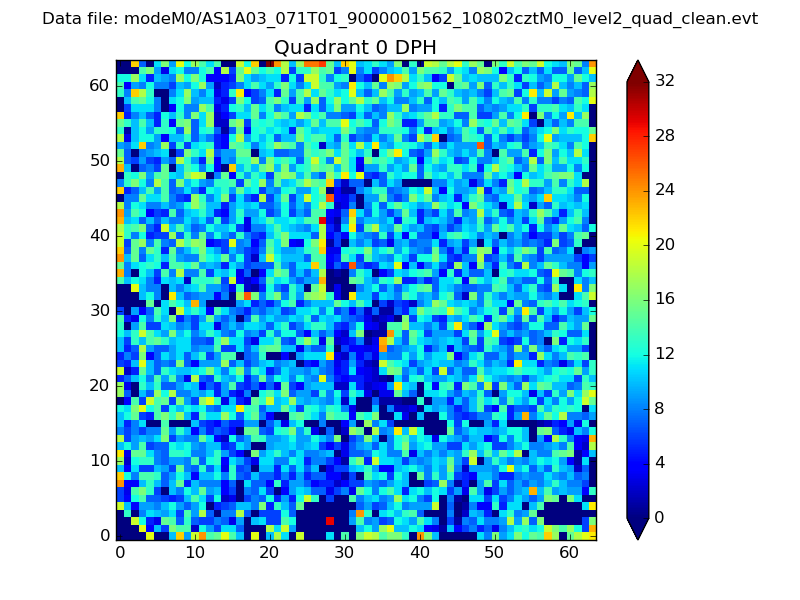 |
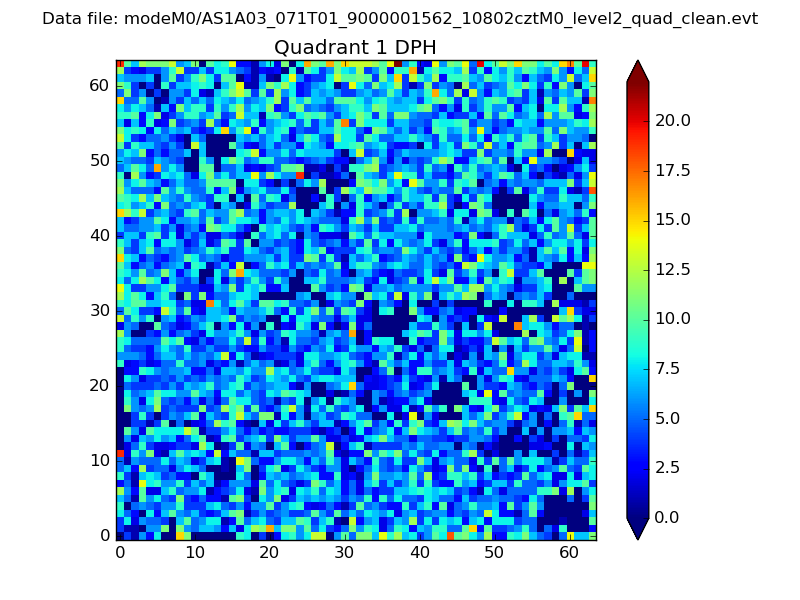 |
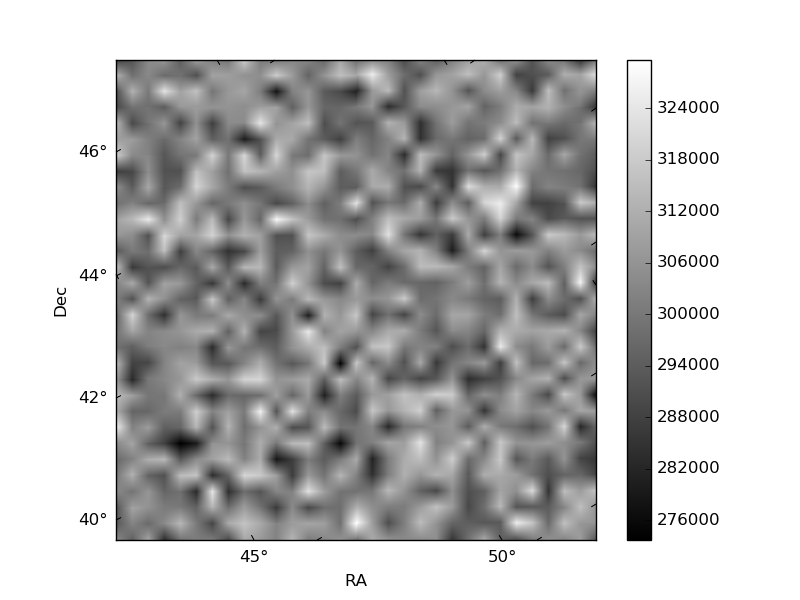
Quadrant B |
|---|---|---|---|
| Quadrant D | 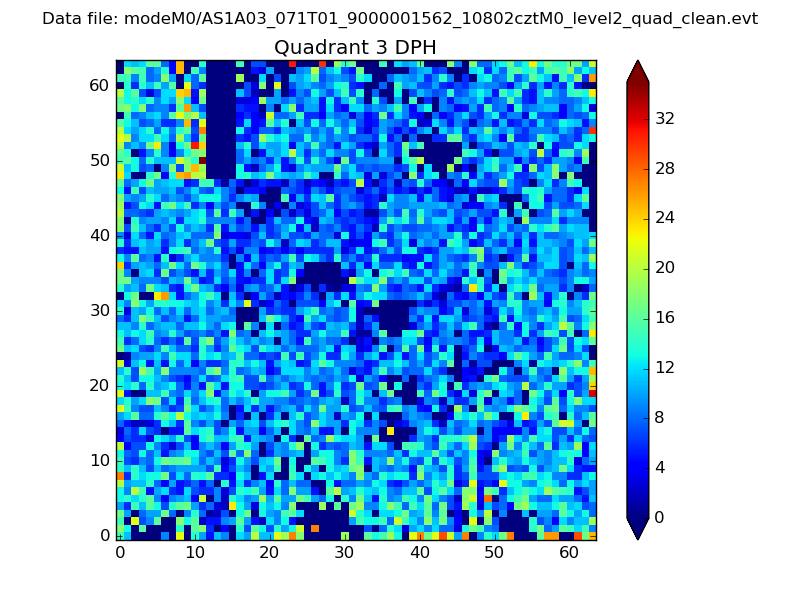 |
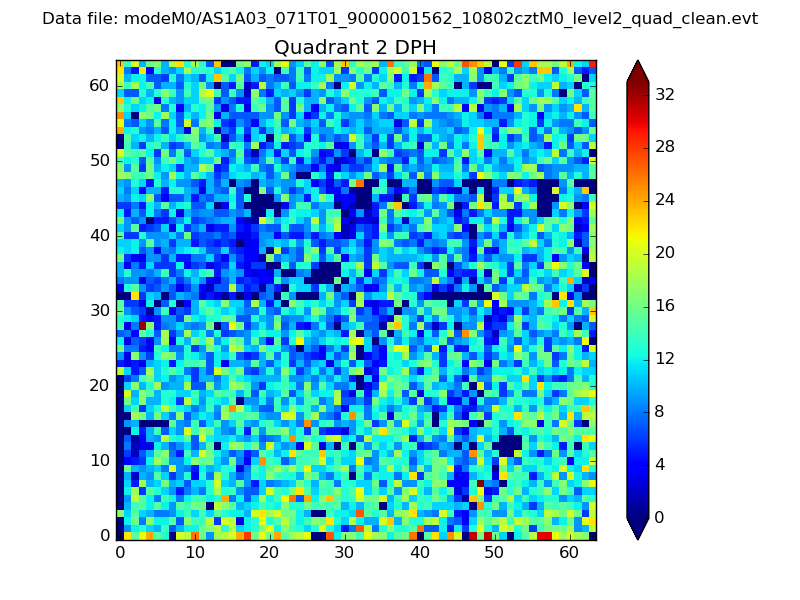 |
Quadrant C |
| Plot type | Count rate plots | Images |
|---|---|---|
| Comparison with Poisson distribution Blue bars denote a histogram of data divided into 1 sec bins. Red curve is a Poisson curve with rate = median count rate of data. |
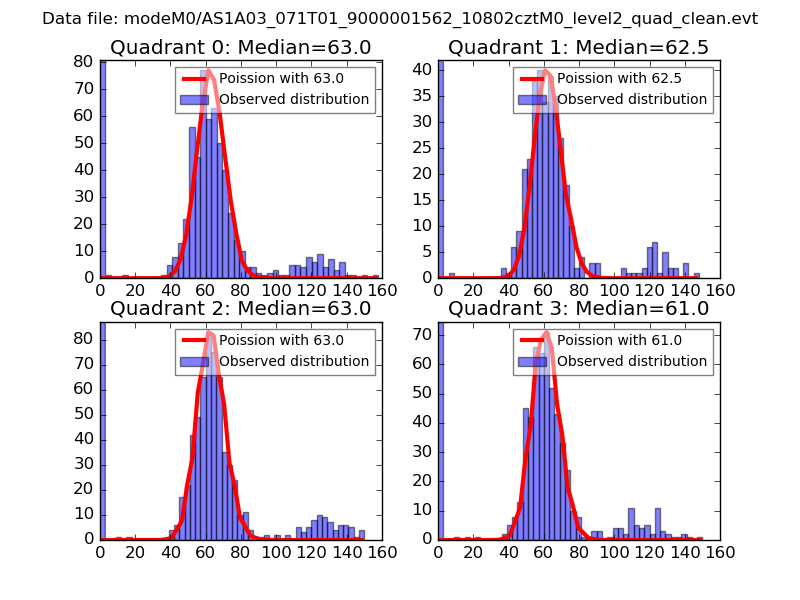 |
 |
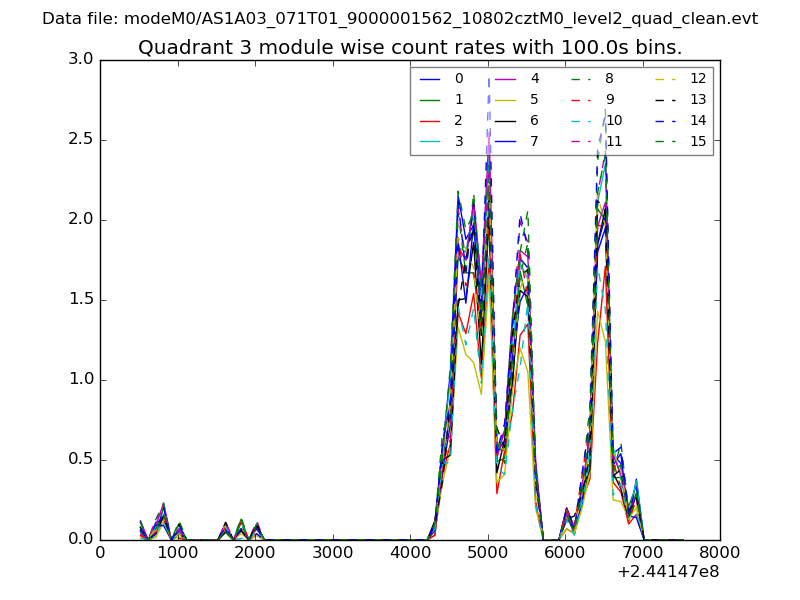
| Quadrant-wise count rates Data is divided into 100 sec bins |
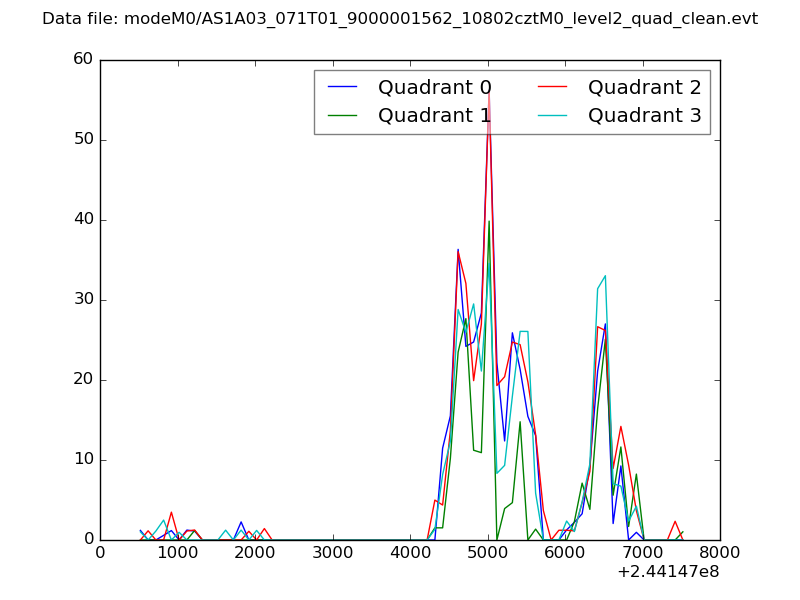 |
|
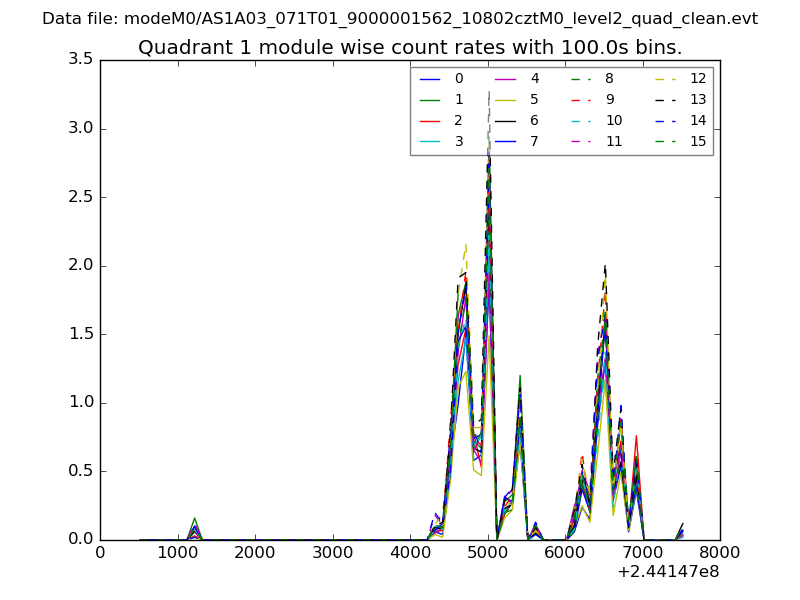
| Module-wise count rates for Quadrant A Data is divided into 100 sec bins |
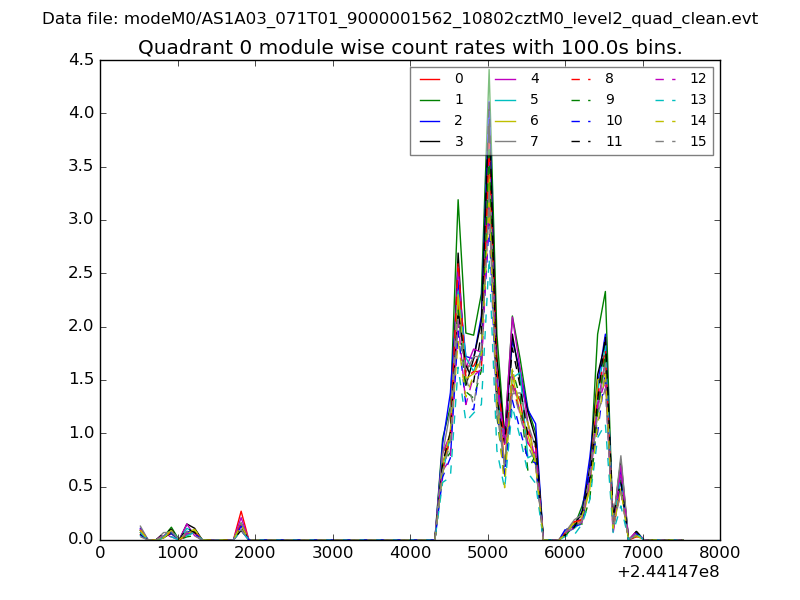 |
 |
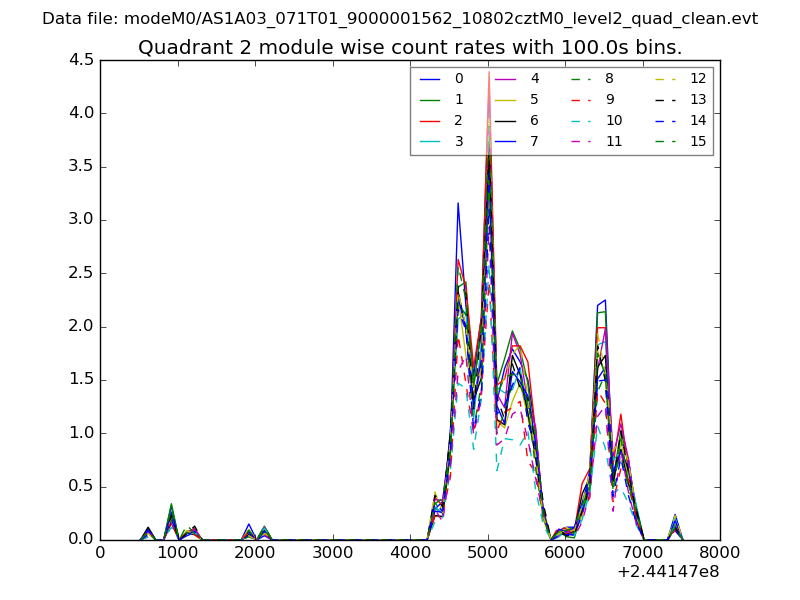
| Module-wise count rates for Quadrant B Data is divided into 100 sec bins |
 |
 |
| Module-wise count rates for Quadrant C Data is divided into 100 sec bins |
 |
 |
| Module-wise count rates for Quadrant D Data is divided into 100 sec bins |
 |
 |
| Parameter | Plot |
|---|---|
| CZT HV Monitor | 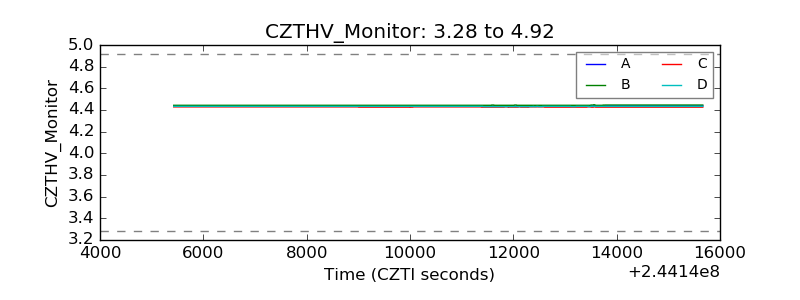 |
| D_VDD | 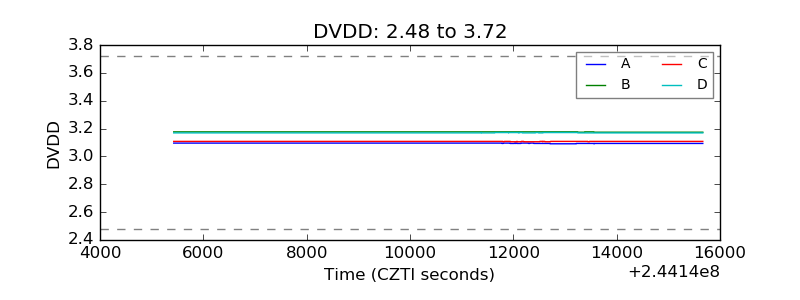 |
| Temperature 1 | 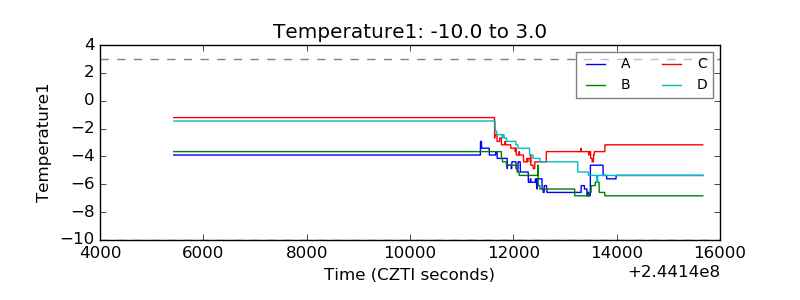 |
| Veto HV Monitor | 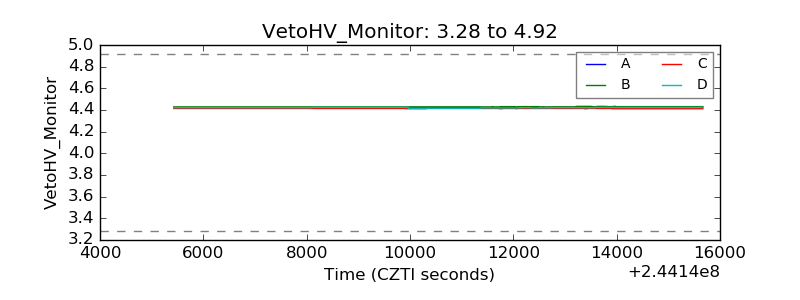 |
| Veto LLD | 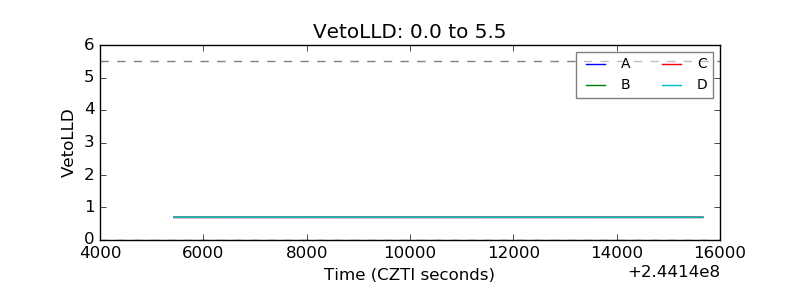 |
| Alpha Counter | 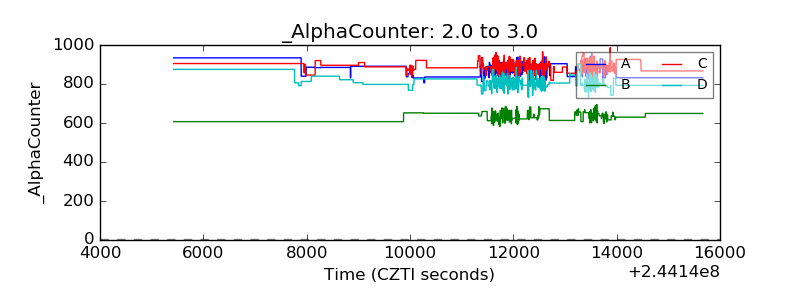 |
| _CPM_Rate | 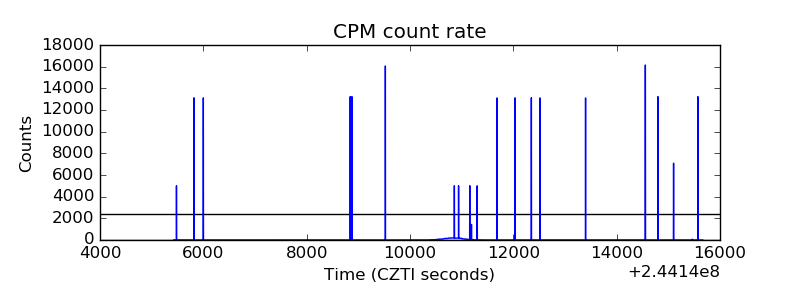 |
| CZT Counter | 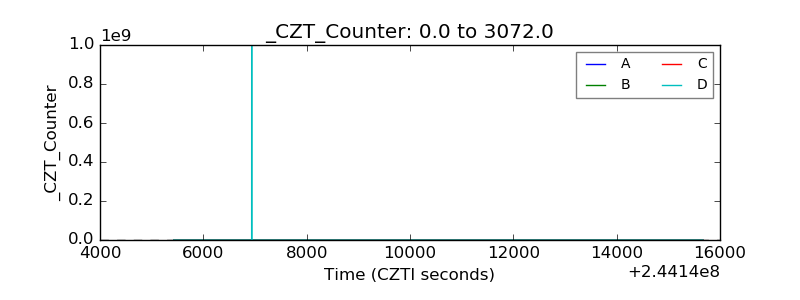 |
| +2.5 Volts monitor |  |
| +5 Volts monitor | 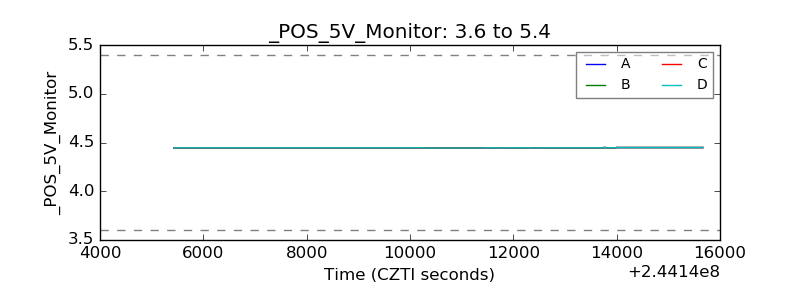 |
| _ROLL_ROT | 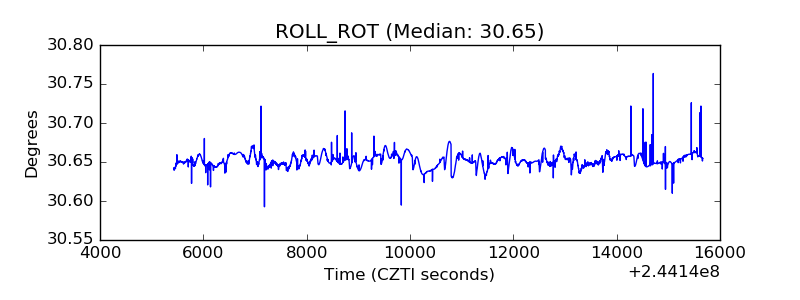 |
| _Roll_DEC | 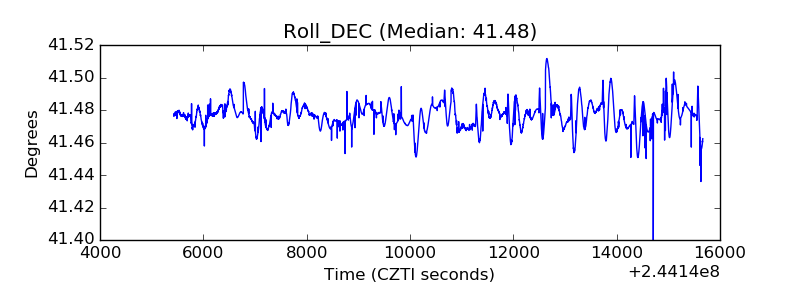 |
| _Roll_RA | 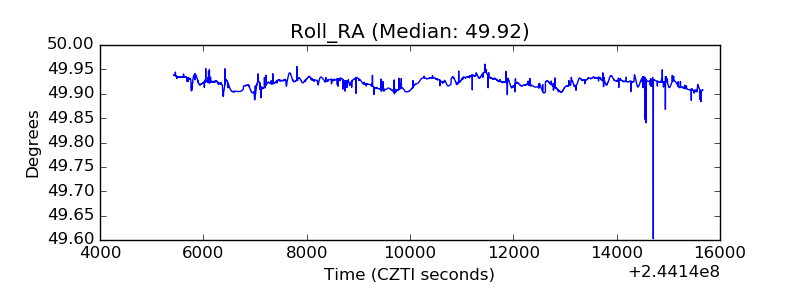 |
| Veto Counter | 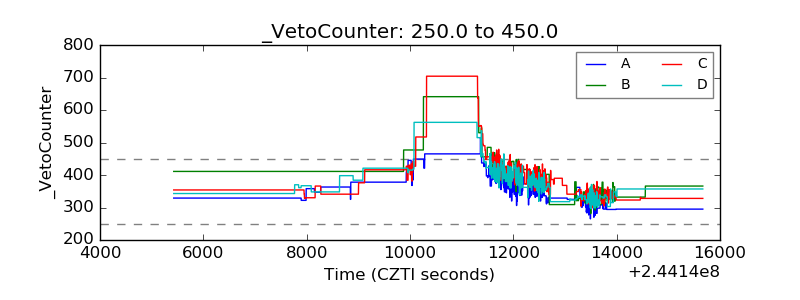 |