| Param | Original file | Final file |
|---|---|---|
| Filename | modeM0/AS1A03_071T01_9000001562_10803cztM0_level2.evt | modeM0/AS1A03_071T01_9000001562_10803cztM0_level2_quad_clean.evt |
| Size (bytes) | 529,044,480 | 77,319,360 |
| Size | 504.5 MB | 73.7 MB |
| Events in quadrant A | 5,731,316 | 421,232 |
| Events in quadrant B | 4,211,330 | 482,392 |
| Events in quadrant C | 2,634,063 | 552,055 |
| Events in quadrant D | 3,063,639 | 492,201 |
| Mode M9 | |||
|---|---|---|---|
| Quadrant | BADHDUFLAG | Total packets | Discarded packets |
| A | 0 | 5 | 0 |
| B | 0 | 5 | 0 |
| C | 0 | 5 | 0 |
| D | 0 | 5 | 0 |
| Mode M0 | |||
|---|---|---|---|
| Quadrant | BADHDUFLAG | Total packets | Discarded packets |
| A | 0 | 32204 | 11529 |
| B | 0 | 25600 | 9346 |
| C | 0 | 17400 | 5139 |
| D | 0 | 21053 | 7711 |
| Mode SS | |||
|---|---|---|---|
| Quadrant | BADHDUFLAG | Total packets | Discarded packets |
| A | 0 | 174 | 46 |
| B | 0 | 174 | 44 |
| C | 0 | 174 | 54 |
| D | 0 | 174 | 56 |
| Quadrant | Total seconds | Saturated seconds | Saturation percentage |
|---|---|---|---|
| A | 5282 | 1146 | 21.696327% |
| B | 5478 | 560 | 10.222709% |
| C | 5894 | 64 | 1.085850% |
| D | 5648 | 130 | 2.301700% |
Noise dominated data is calculated using 1-second bins in cleaned event files. If a bin has >2000 counts, and if more than 50% of those come from <1% of pixels, then it is considered to be noise-dominated and hence unusable.
| Quadrant | # 1 sec bins | Bins with >0 counts | Bins with >2000 counts | High rate bins dominated by noise | Noise dominated (total time) | Noise dominated (detector-on time) | Marked lightcurve |
|---|---|---|---|---|---|---|---|
| A | 8905 | 6327 | 766 | 766 | 8.60% | 12.11% | 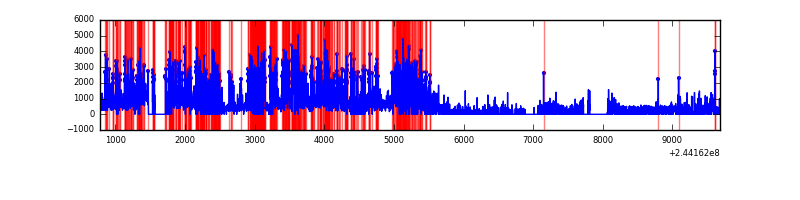 |
| B | 8902 | 6550 | 231 | 231 | 2.59% | 3.53% | 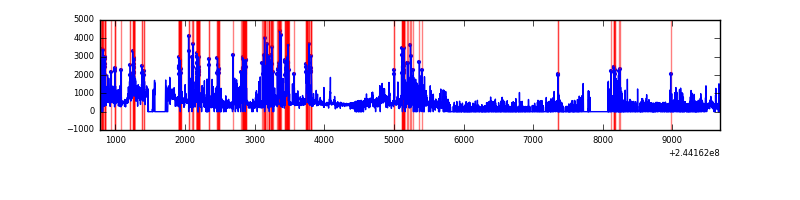 |
| C | 8905 | 6970 | 0 | 0 | 0.00% | 0.00% | 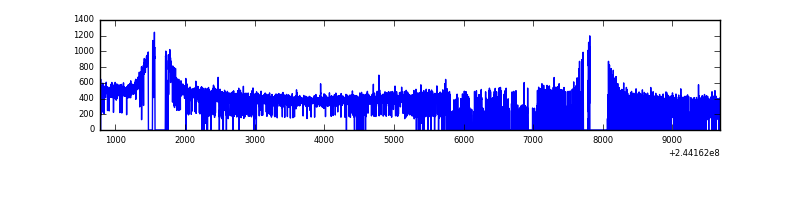 |
| D | 8905 | 6653 | 32 | 32 | 0.36% | 0.48% | 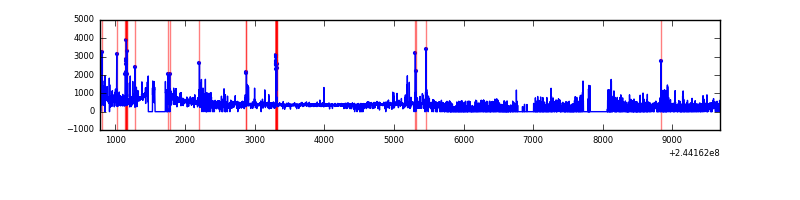 |
Top three noisy pixels from each quadrant. If the there are fewer than three noisy pixels in the level2.evt file, extra rows are filled as -1
| Pixel properties | Quadrant properties | ||||||
|---|---|---|---|---|---|---|---|
| Quadrant | DetID | PixID | Counts | Sigma | Mean | Median | Sigma |
| A | 8 | 5 | 3558736 | 31289.82 | 547 | 534 | 113.7 |
| A | 15 | 174 | 52972 | 461.12 | 547 | 534 | 113.7 |
| A | 8 | 15 | 6605 | 53.39 | 547 | 534 | 113.7 |
| B | 4 | 239 | 1285787 | 10695.45 | 621 | 605 | 120.2 |
| B | 0 | 85 | 329572 | 2737.71 | 621 | 605 | 120.2 |
| B | 15 | 204 | 129452 | 1072.28 | 621 | 605 | 120.2 |
| C | 13 | 61 | 4999 | 27.1 | 674 | 677 | 159.5 |
| C | 8 | 222 | 3847 | 19.88 | 674 | 677 | 159.5 |
| C | 12 | 4 | 2097 | 8.91 | 674 | 677 | 159.5 |
| D | 13 | 138 | 235037 | 1533.76 | 629 | 611 | 152.8 |
| D | 8 | 195 | 193317 | 1260.8 | 629 | 611 | 152.8 |
| D | 12 | 233 | 67533 | 437.84 | 629 | 611 | 152.8 |
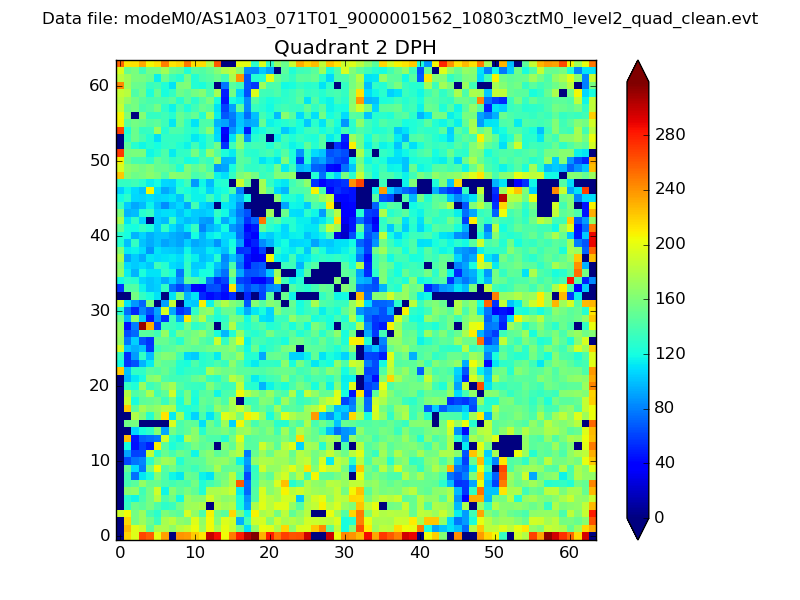
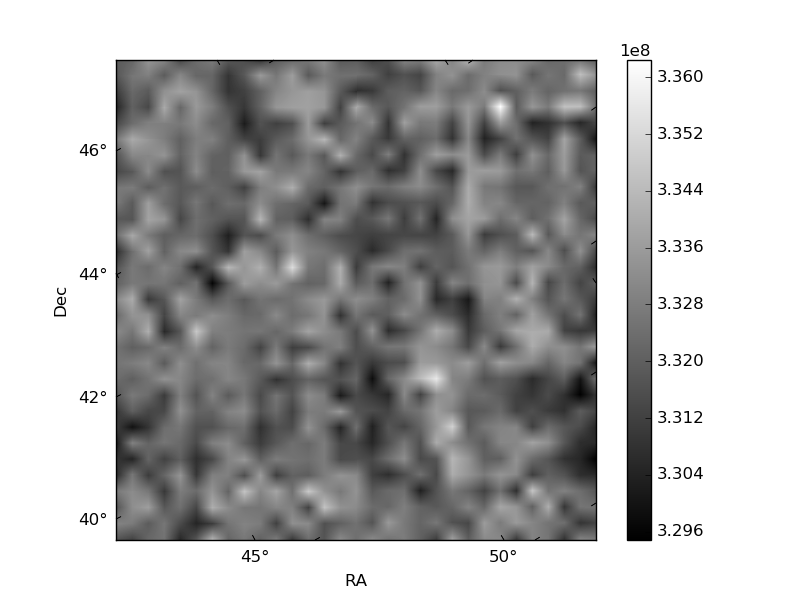
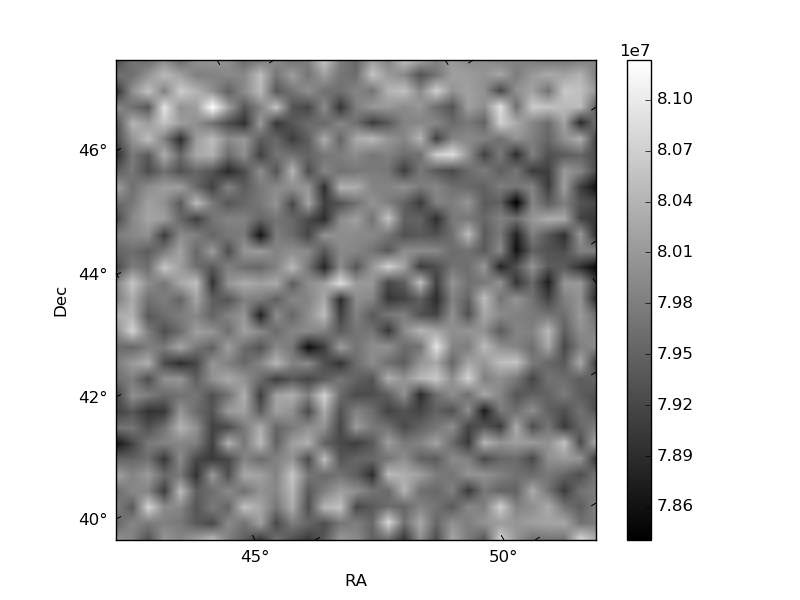
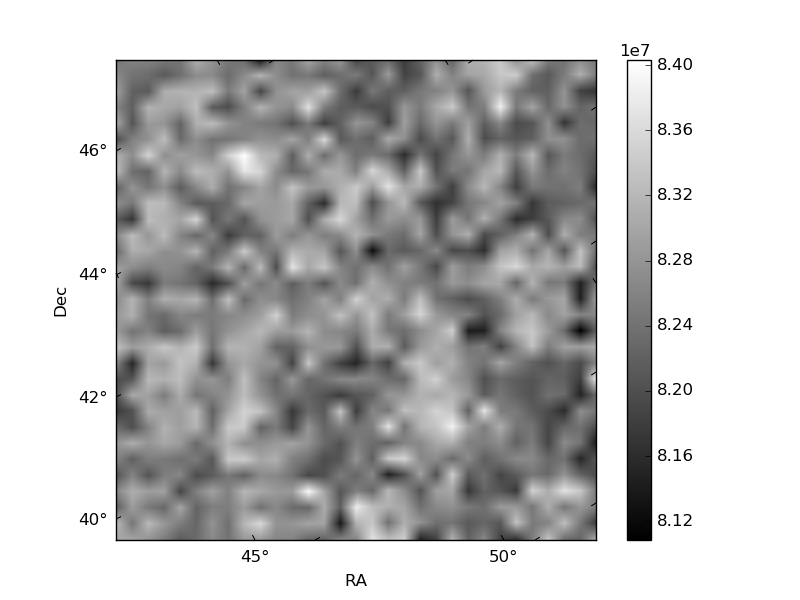
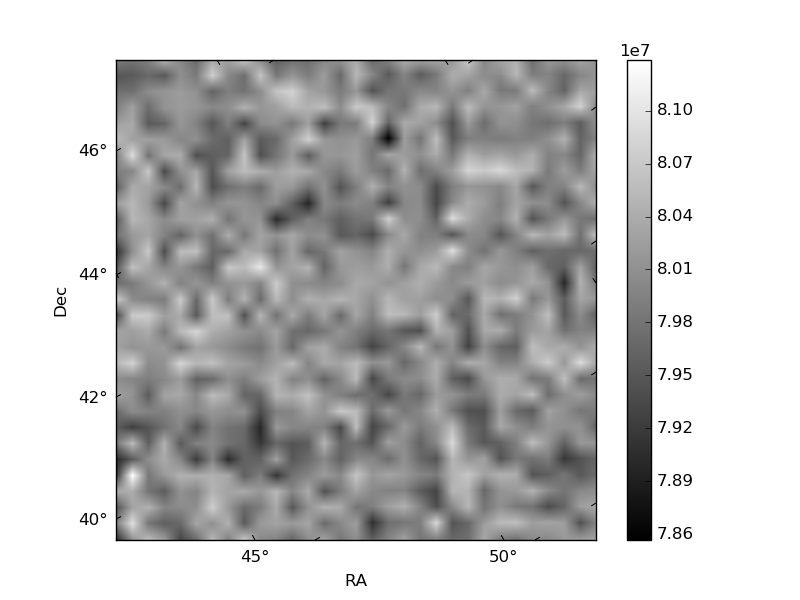
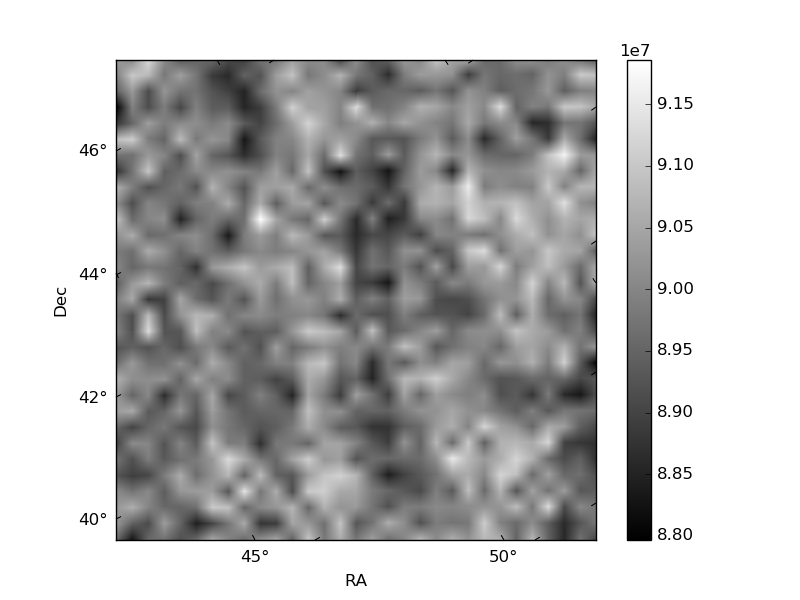
Histogram calculated using DETX and DETY for each event in the final _common_clean file
| Quadrant A | 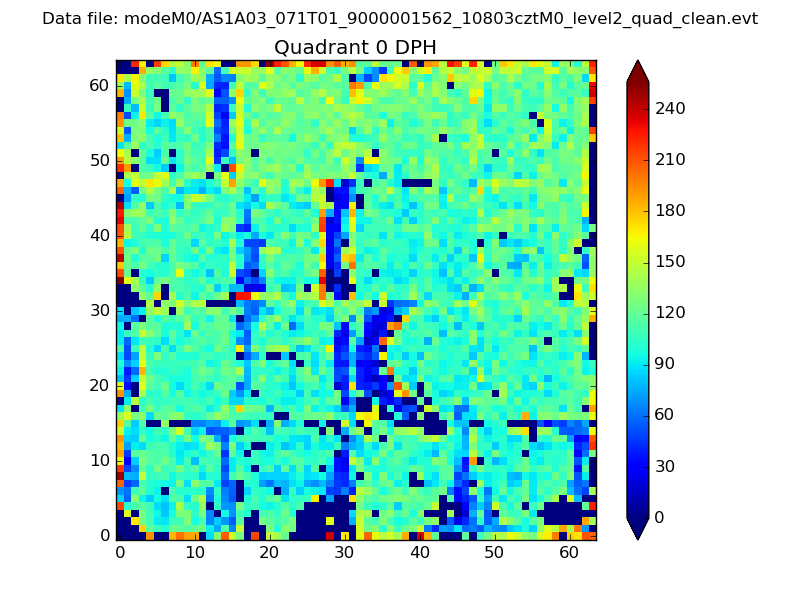 |
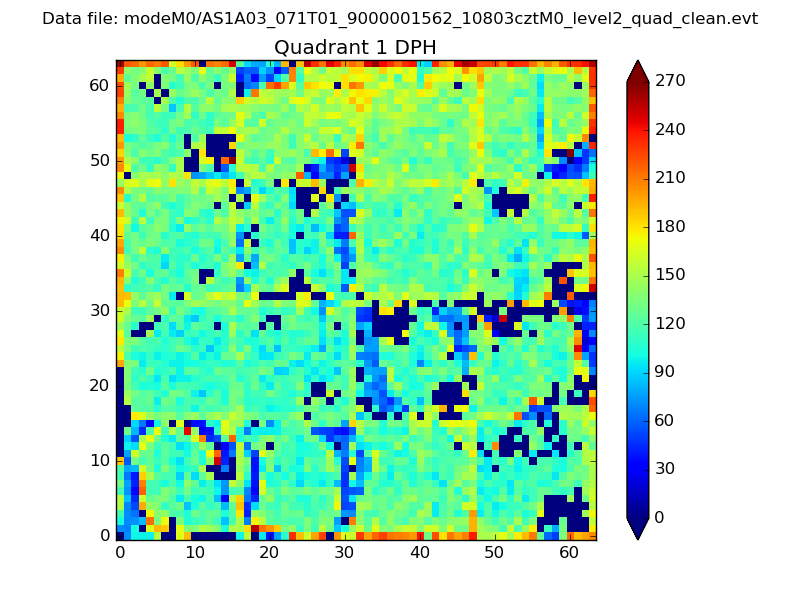 |
Quadrant B |
|---|---|---|---|
| Quadrant D | 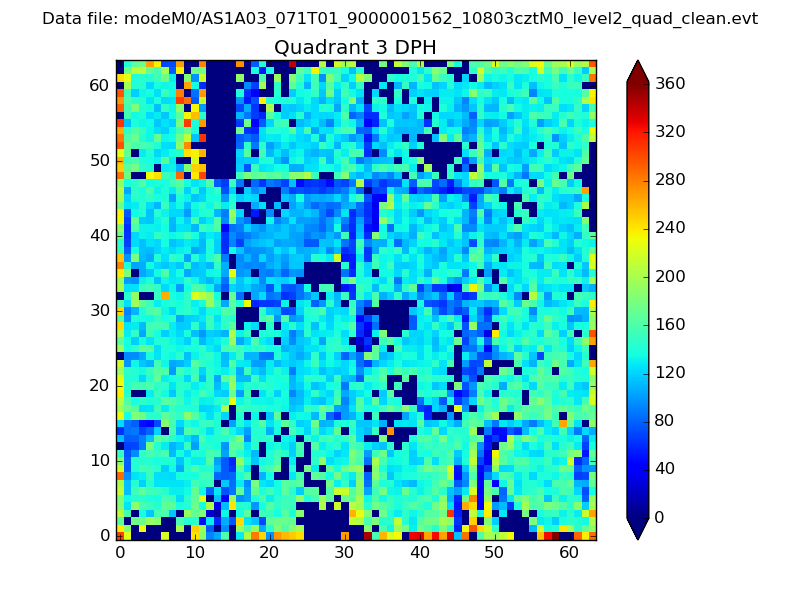 |
 |
Quadrant C |
| Plot type | Count rate plots | Images |
|---|---|---|
| Comparison with Poisson distribution Blue bars denote a histogram of data divided into 1 sec bins. Red curve is a Poisson curve with rate = median count rate of data. |
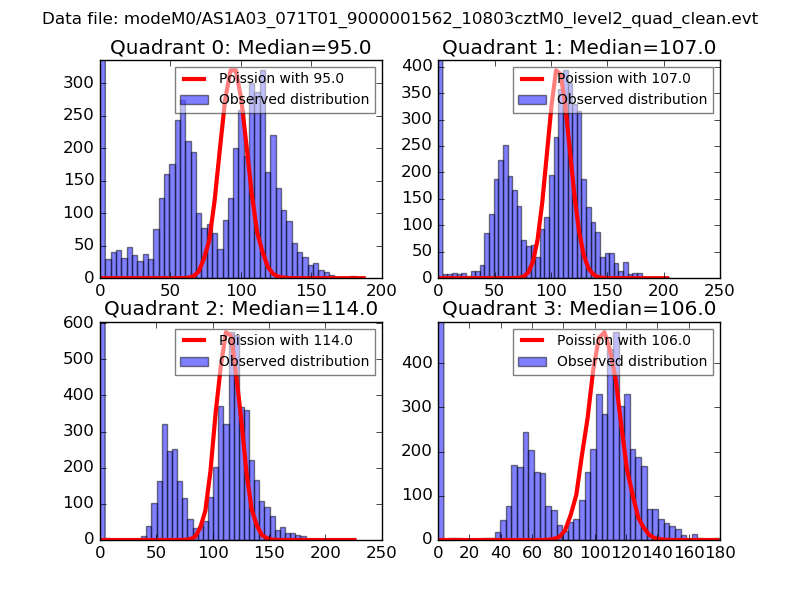 |
 |
| Quadrant-wise count rates Data is divided into 100 sec bins |
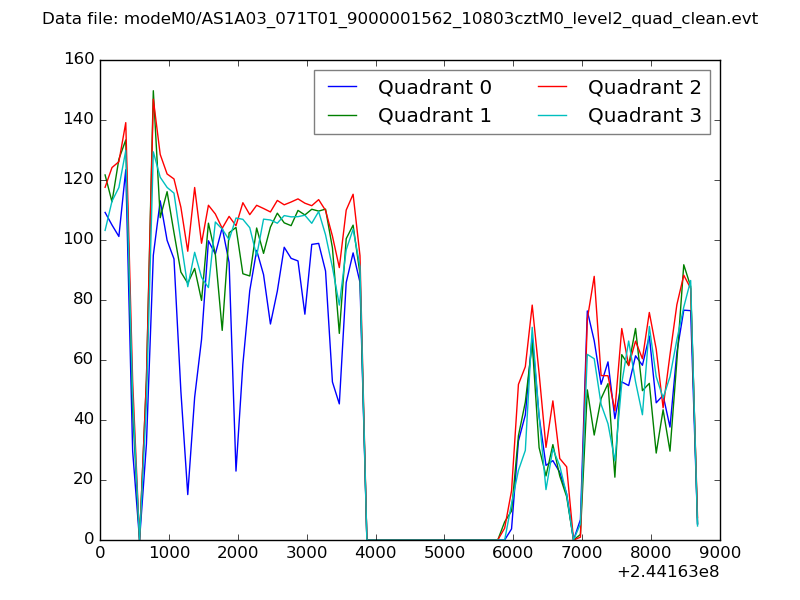 |
|
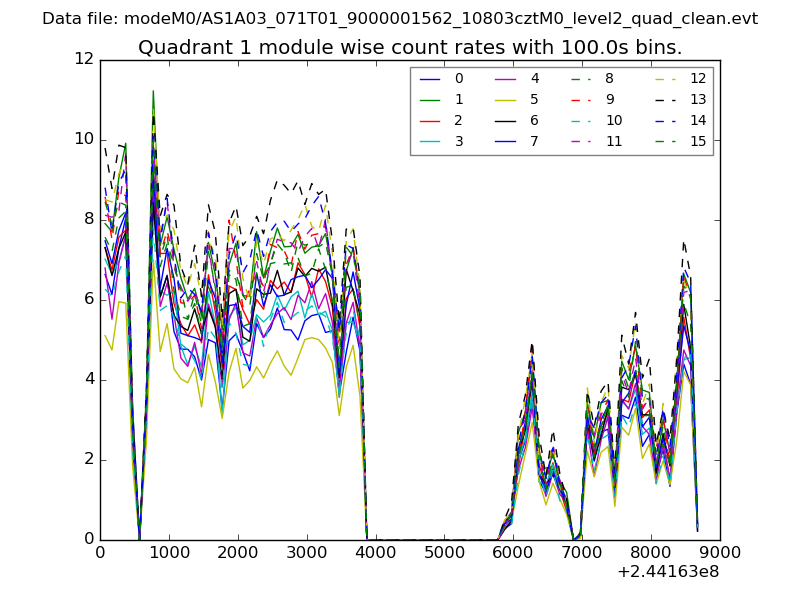
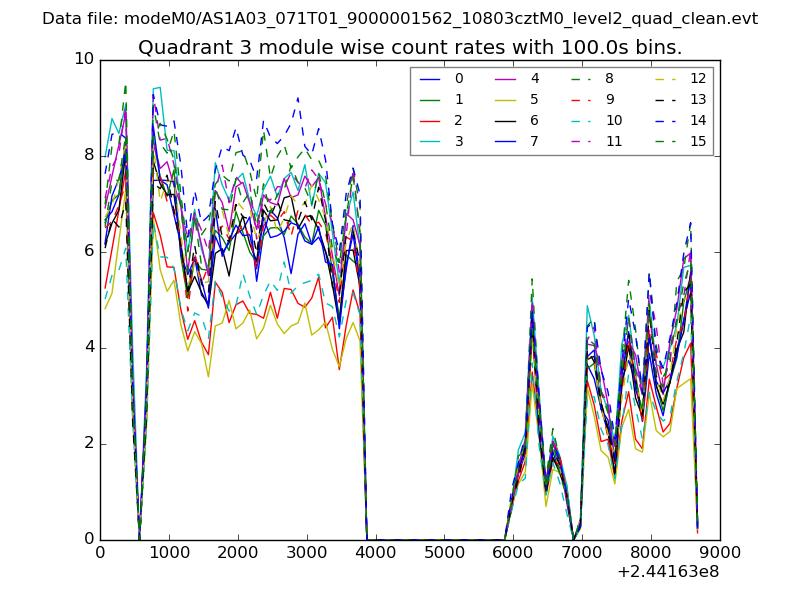
| Module-wise count rates for Quadrant A Data is divided into 100 sec bins |
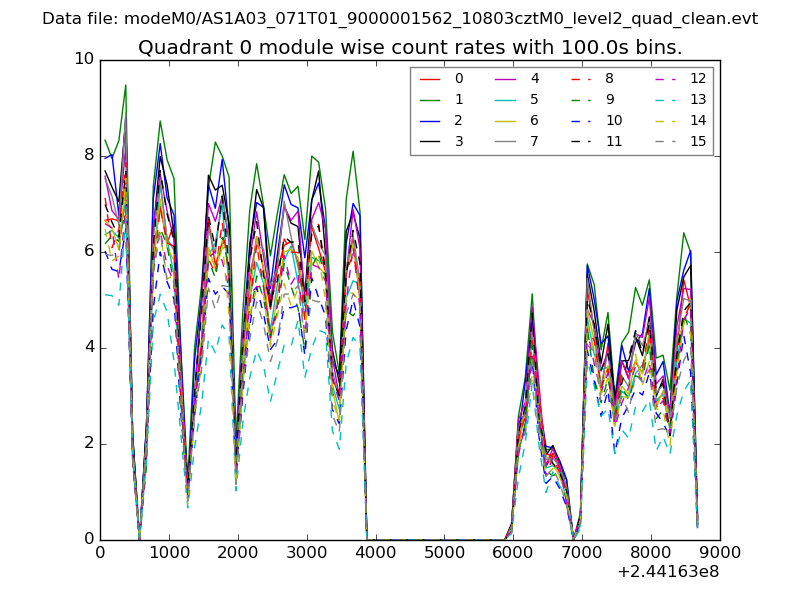 |
 |
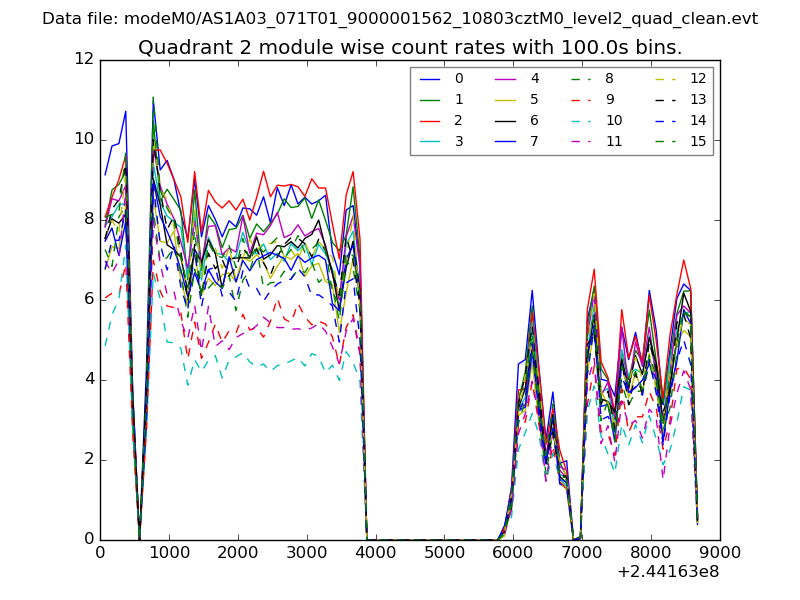
| Module-wise count rates for Quadrant B Data is divided into 100 sec bins |
 |
 |
| Module-wise count rates for Quadrant C Data is divided into 100 sec bins |
 |
 |
| Module-wise count rates for Quadrant D Data is divided into 100 sec bins |
 |
 |
| Parameter | Plot |
|---|---|
| CZT HV Monitor | 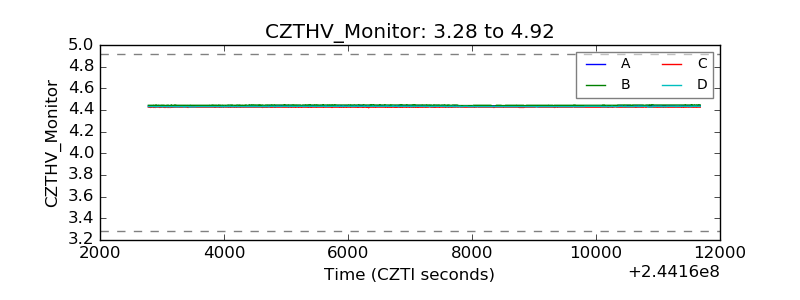 |
| D_VDD | 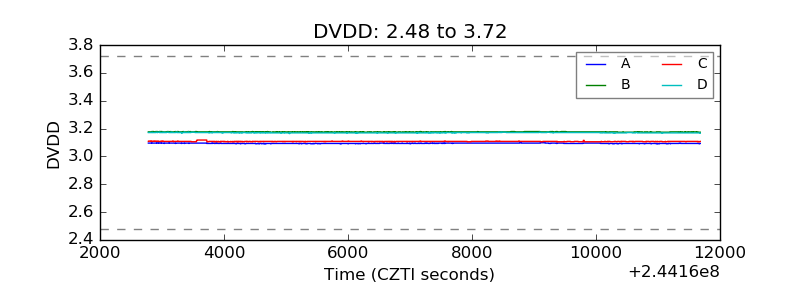 |
| Temperature 1 | 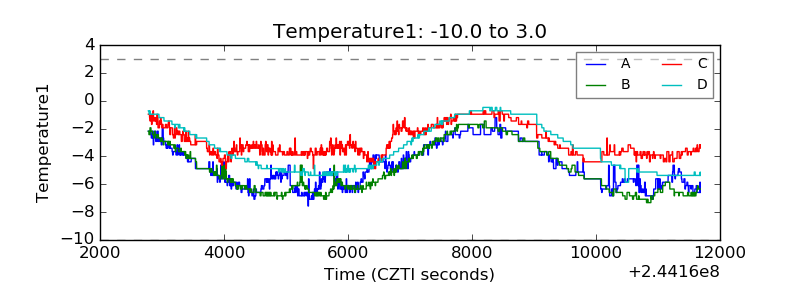 |
| Veto HV Monitor | 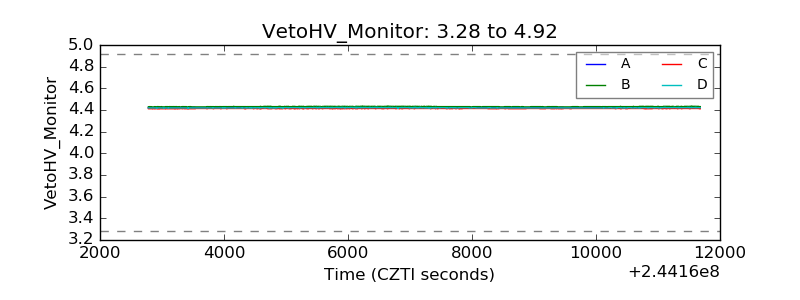 |
| Veto LLD | 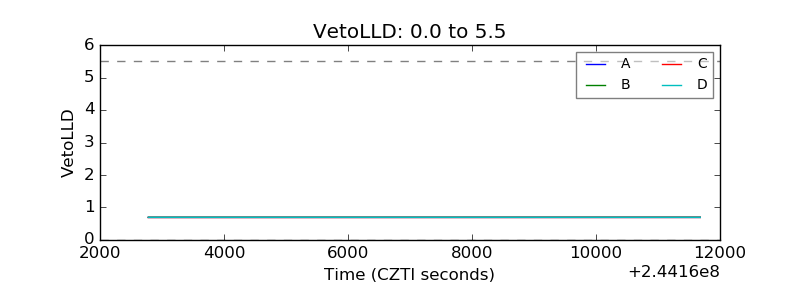 |
| Alpha Counter |  |
| _CPM_Rate | 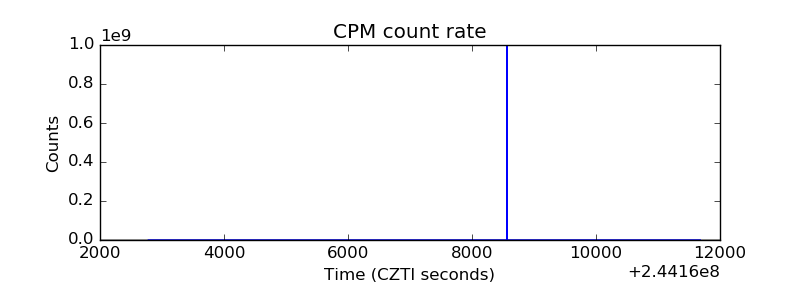 |
| CZT Counter | 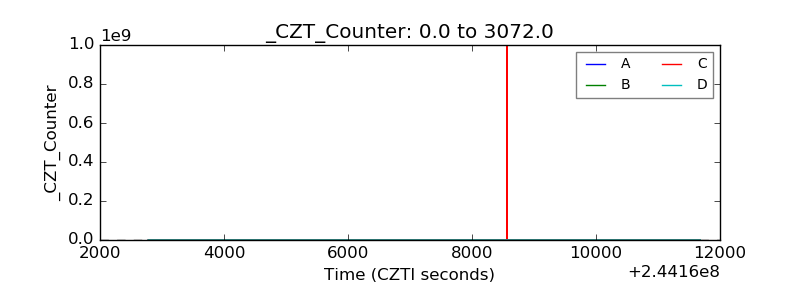 |
| +2.5 Volts monitor |  |
| +5 Volts monitor |  |
| _ROLL_ROT | 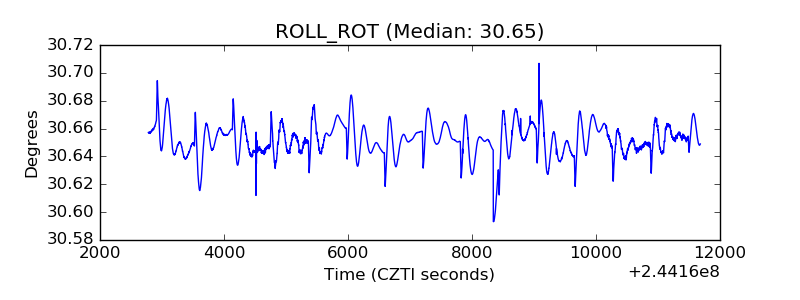 |
| _Roll_DEC | 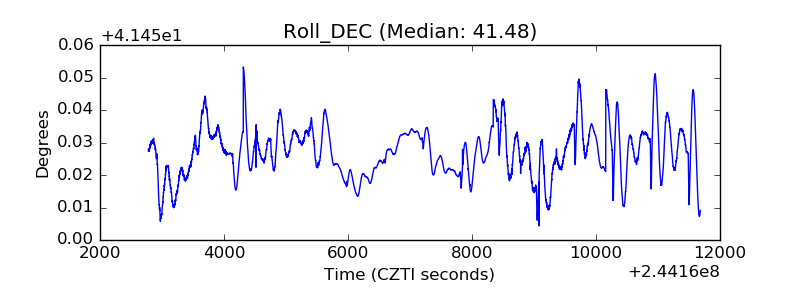 |
| _Roll_RA | 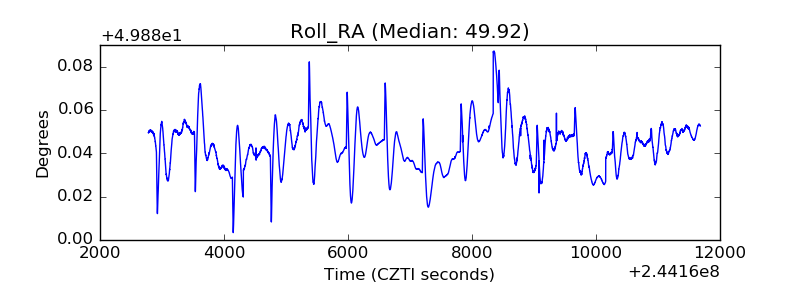 |
| Veto Counter | 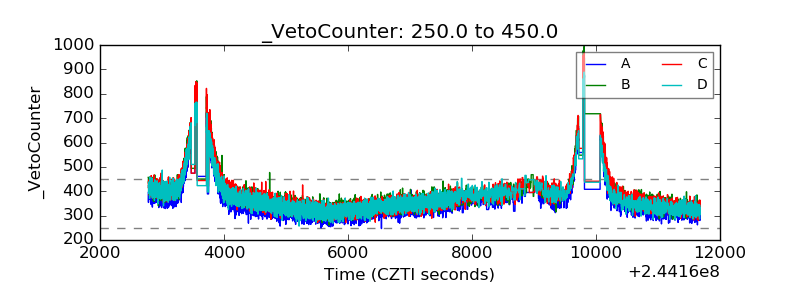 |