| Param | Original file | Final file |
|---|---|---|
| Filename | modeM0/AS1A03_071T01_9000001562_10806cztM0_level2.evt | modeM0/AS1A03_071T01_9000001562_10806cztM0_level2_quad_clean.evt |
| Size (bytes) | 2,592,443,520 | 345,369,600 |
| Size | 2.4 GB | 329.4 MB |
| Events in quadrant A | 22,635,042 | 2,053,296 |
| Events in quadrant B | 25,063,666 | 2,067,676 |
| Events in quadrant C | 12,494,783 | 2,290,623 |
| Events in quadrant D | 16,441,112 | 2,129,029 |
| Mode M9 | |||
|---|---|---|---|
| Quadrant | BADHDUFLAG | Total packets | Discarded packets |
| A | 0 | 20 | 0 |
| B | 0 | 20 | 0 |
| C | 0 | 20 | 0 |
| D | 0 | 20 | 0 |
| Mode M0 | |||
|---|---|---|---|
| Quadrant | BADHDUFLAG | Total packets | Discarded packets |
| A | 0 | 86479 | 7 |
| B | 0 | 93428 | 7 |
| C | 0 | 57393 | 7 |
| D | 0 | 69245 | 5 |
| Mode SS | |||
|---|---|---|---|
| Quadrant | BADHDUFLAG | Total packets | Discarded packets |
| A | 0 | 568 | 0 |
| B | 0 | 568 | 0 |
| C | 0 | 568 | 0 |
| D | 0 | 568 | 0 |
| Quadrant | Total seconds | Saturated seconds | Saturation percentage |
|---|---|---|---|
| A | 27890 | 2947 | 10.566511% |
| B | 27890 | 4042 | 14.492650% |
| C | 27890 | 148 | 0.530656% |
| D | 27891 | 675 | 2.420136% |
Noise dominated data is calculated using 1-second bins in cleaned event files. If a bin has >2000 counts, and if more than 50% of those come from <1% of pixels, then it is considered to be noise-dominated and hence unusable.
| Quadrant | # 1 sec bins | Bins with >0 counts | Bins with >2000 counts | High rate bins dominated by noise | Noise dominated (total time) | Noise dominated (detector-on time) | Marked lightcurve |
|---|---|---|---|---|---|---|---|
| A | 29911 | 27897 | 2114 | 2114 | 7.07% | 7.58% | 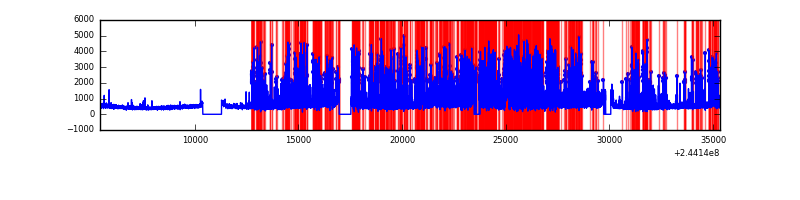 |
| B | 29911 | 27898 | 2872 | 2872 | 9.60% | 10.29% | 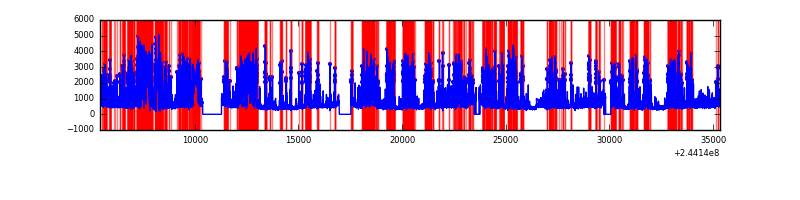 |
| C | 29911 | 27898 | 27 | 27 | 0.09% | 0.10% | 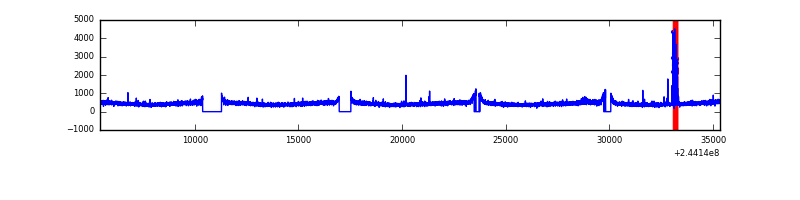 |
| D | 29911 | 27898 | 445 | 445 | 1.49% | 1.60% | 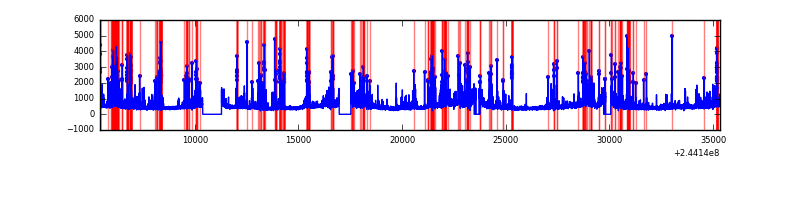 |
Top three noisy pixels from each quadrant. If the there are fewer than three noisy pixels in the level2.evt file, extra rows are filled as -1
| Pixel properties | Quadrant properties | ||||||
|---|---|---|---|---|---|---|---|
| Quadrant | DetID | PixID | Counts | Sigma | Mean | Median | Sigma |
| A | 8 | 5 | 10422583 | 16918.62 | 3056 | 2989 | 615.9 |
| A | 15 | 174 | 330243 | 531.37 | 3056 | 2989 | 615.9 |
| A | 13 | 251 | 60103 | 92.74 | 3056 | 2989 | 615.9 |
| B | 4 | 239 | 7602461 | 13287.86 | 3042 | 2969 | 571.9 |
| B | 0 | 85 | 3574621 | 6245.1 | 3042 | 2969 | 571.9 |
| B | 15 | 204 | 885544 | 1543.2 | 3042 | 2969 | 571.9 |
| C | 14 | 234 | 180313 | 243.03 | 3155 | 3174 | 728.9 |
| C | 13 | 61 | 23589 | 28.01 | 3155 | 3174 | 728.9 |
| C | 8 | 222 | 14744 | 15.87 | 3155 | 3174 | 728.9 |
| D | 13 | 138 | 1679202 | 2256.46 | 3098 | 3012 | 742.8 |
| D | 8 | 195 | 856315 | 1148.7 | 3098 | 3012 | 742.8 |
| D | 12 | 233 | 701466 | 940.25 | 3098 | 3012 | 742.8 |
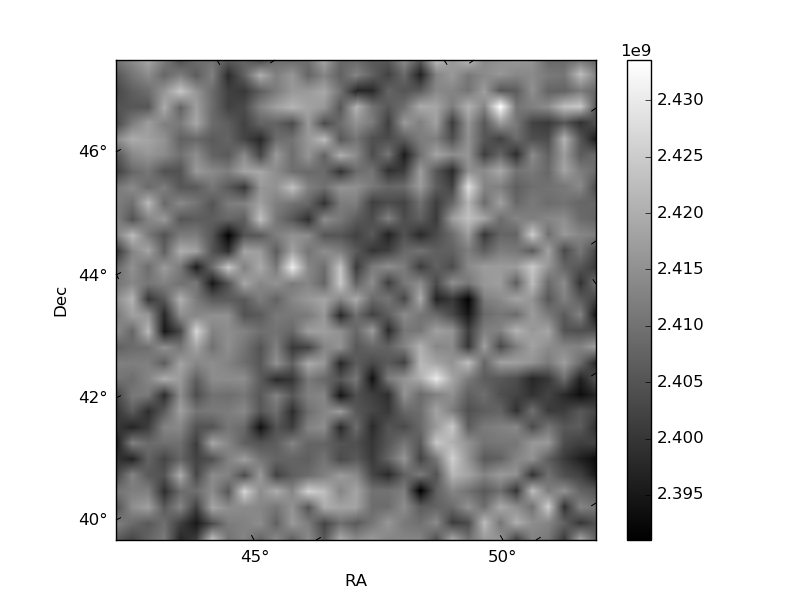
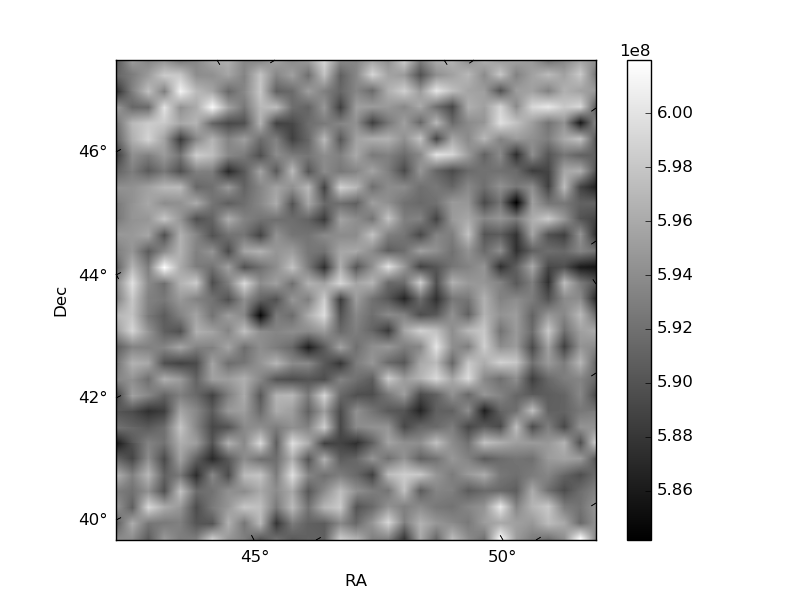
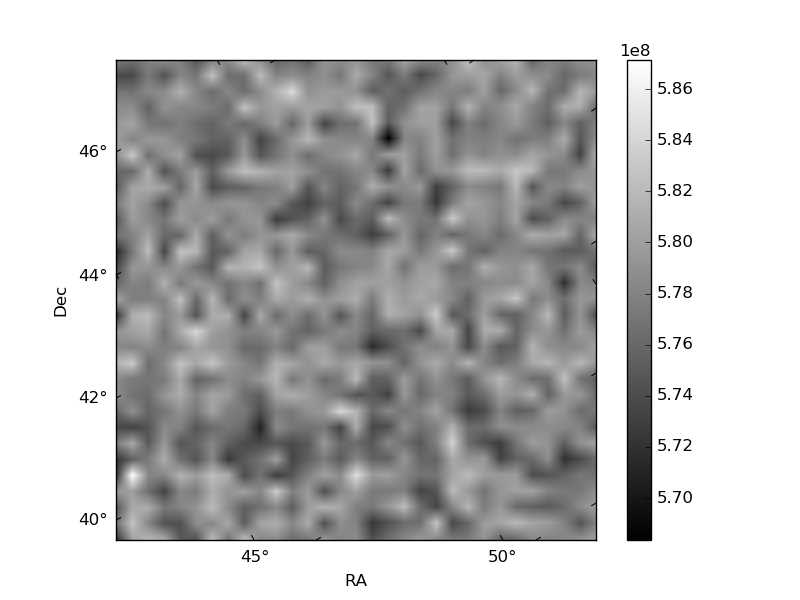
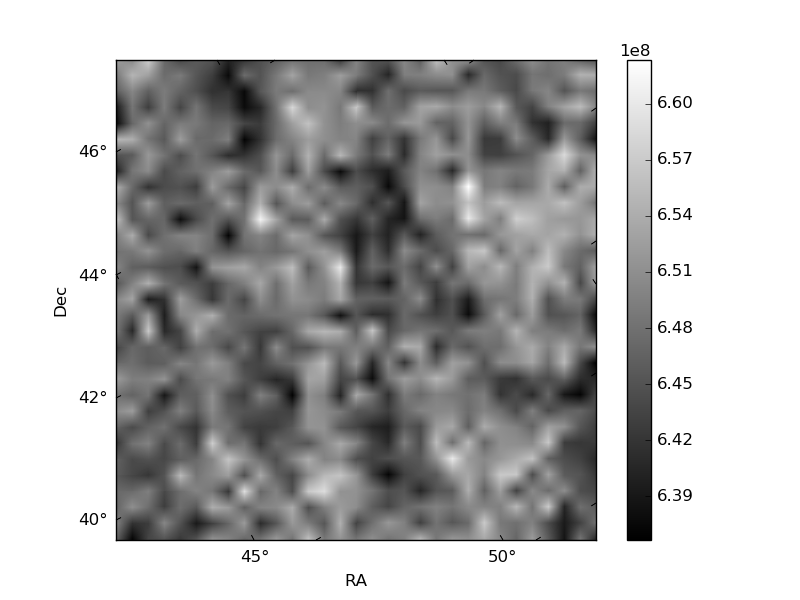
Histogram calculated using DETX and DETY for each event in the final _common_clean file
| Quadrant A | 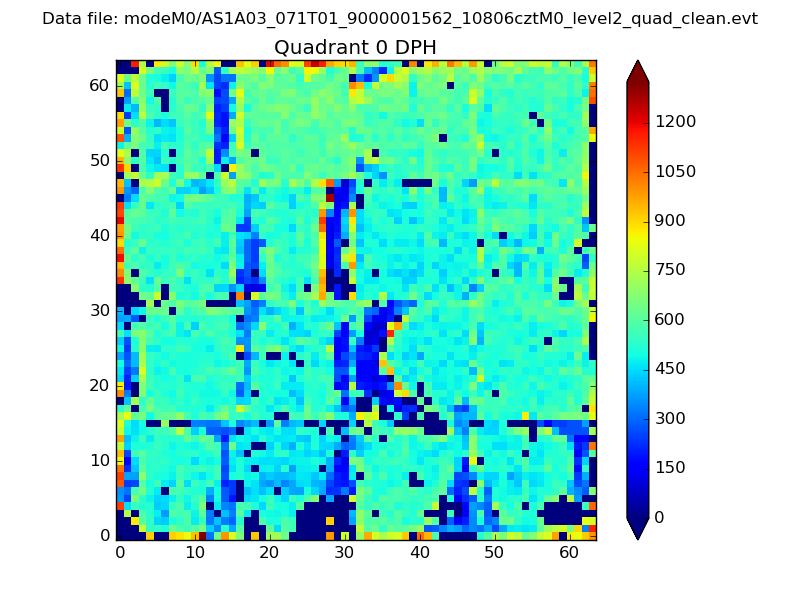 |
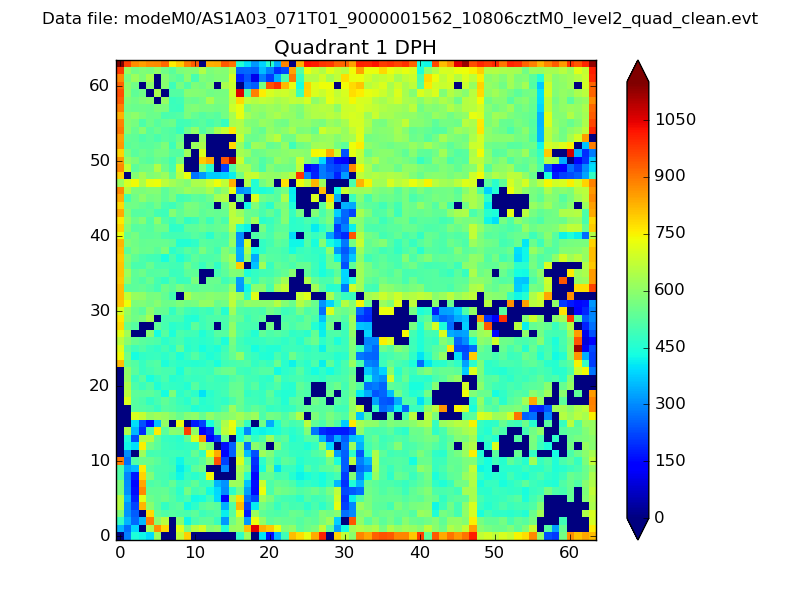 |
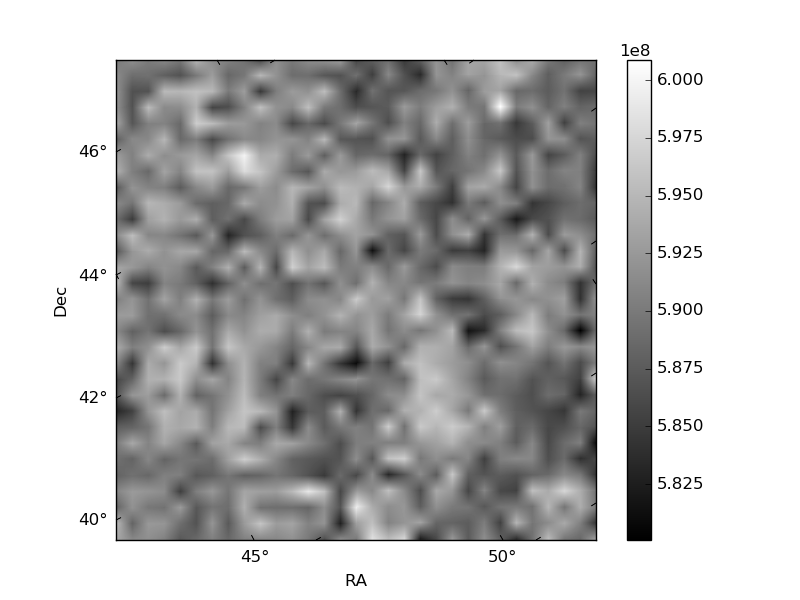
Quadrant B |
|---|---|---|---|
| Quadrant D | 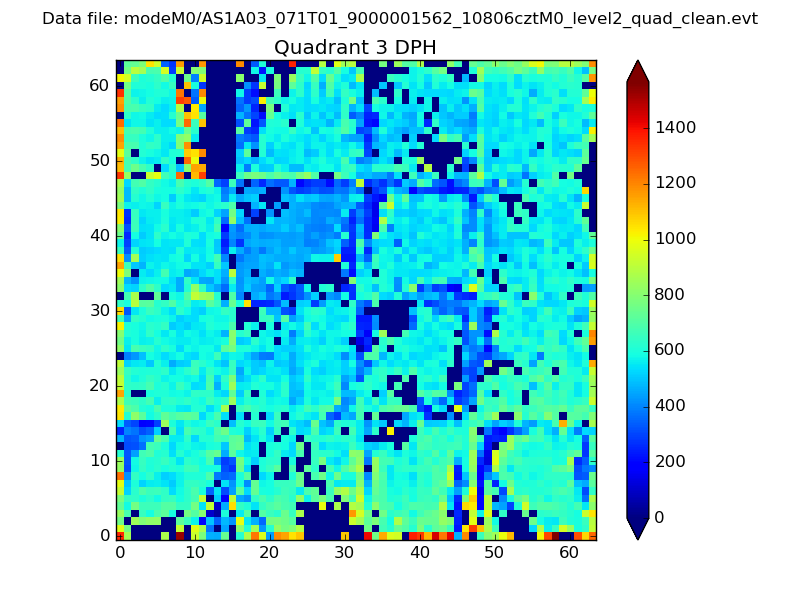 |
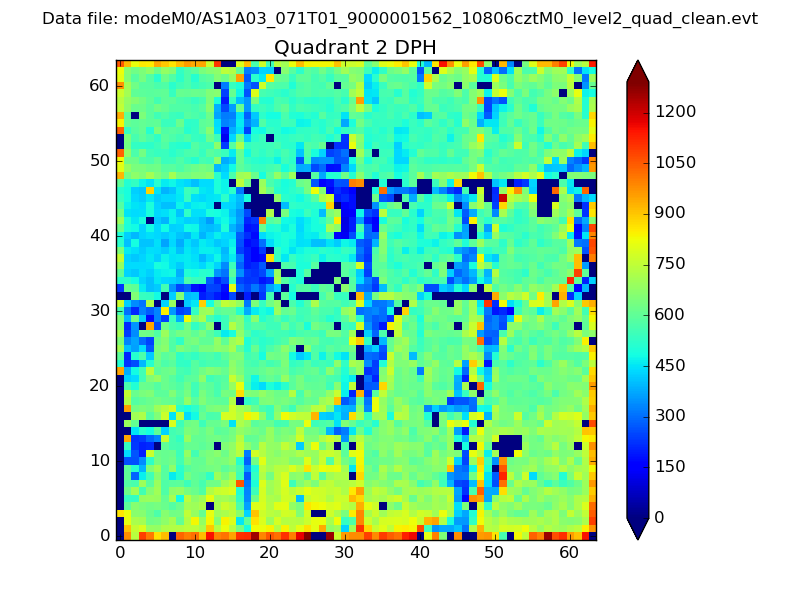 |
Quadrant C |
| Plot type | Count rate plots | Images |
|---|---|---|
| Comparison with Poisson distribution Blue bars denote a histogram of data divided into 1 sec bins. Red curve is a Poisson curve with rate = median count rate of data. |
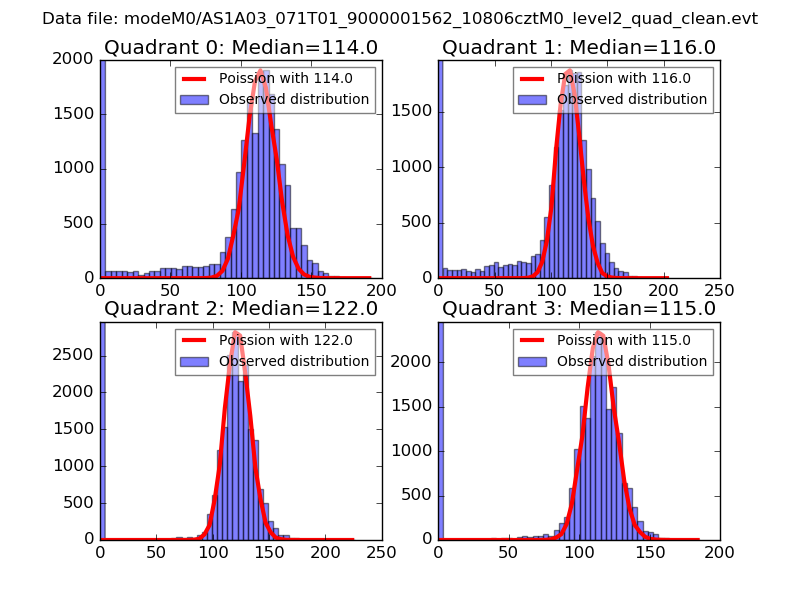 |
 |
| Quadrant-wise count rates Data is divided into 100 sec bins |
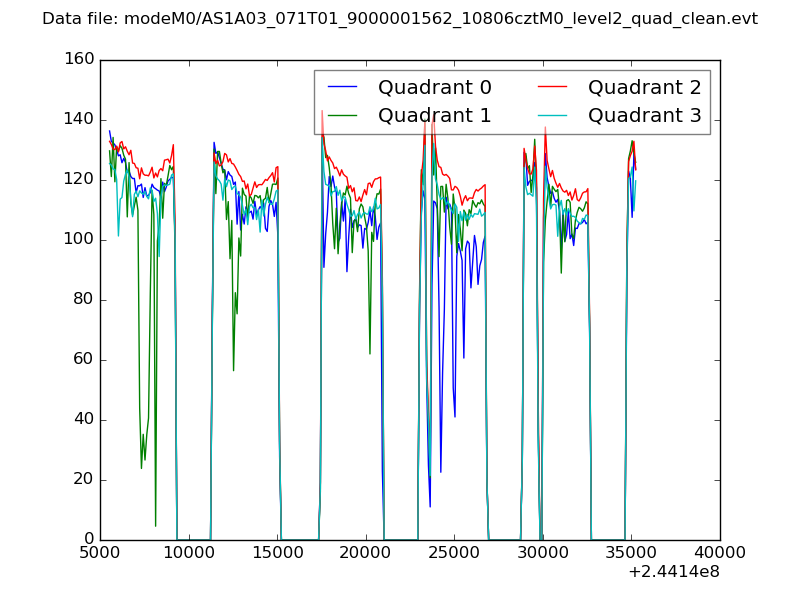 |
|
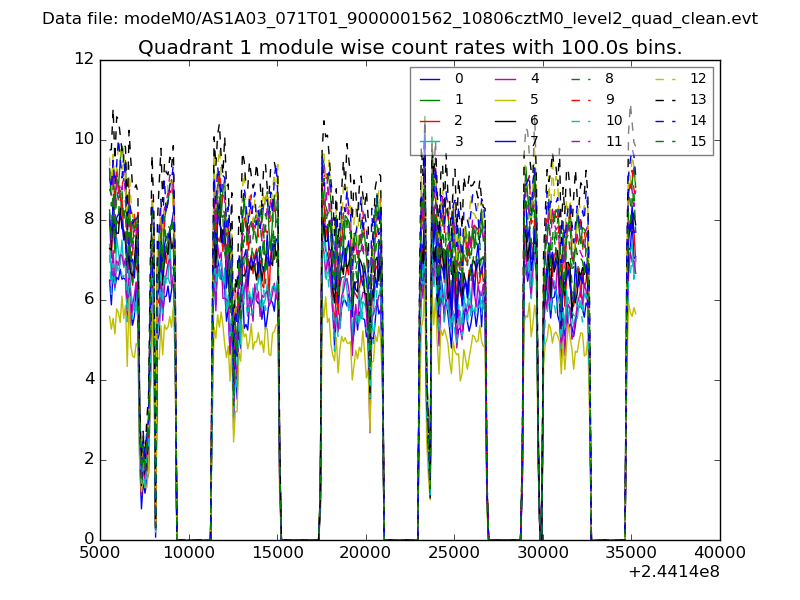
| Module-wise count rates for Quadrant A Data is divided into 100 sec bins |
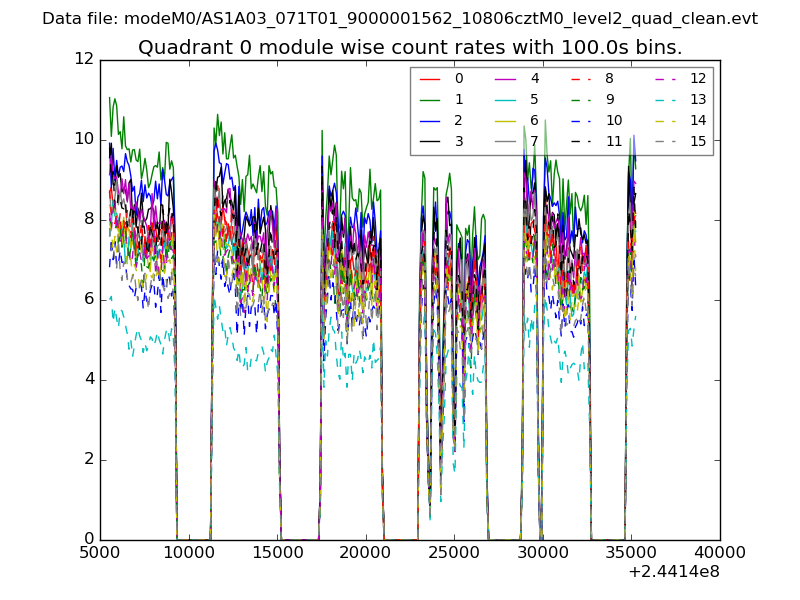 |
 |
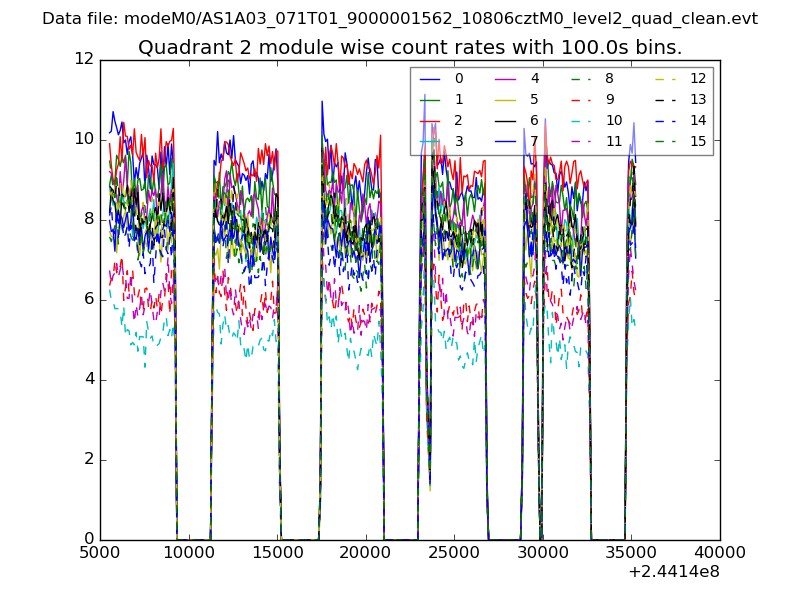
| Module-wise count rates for Quadrant B Data is divided into 100 sec bins |
 |
 |
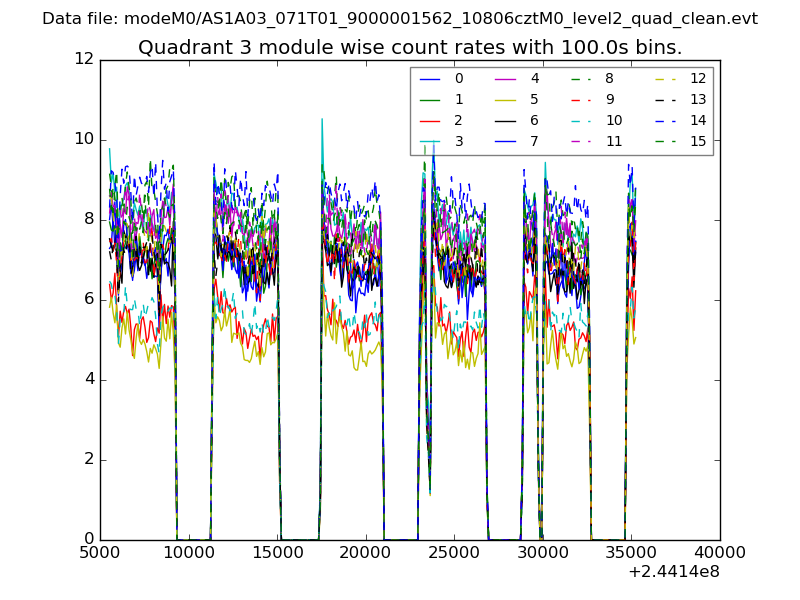
| Module-wise count rates for Quadrant C Data is divided into 100 sec bins |
 |
 |
| Module-wise count rates for Quadrant D Data is divided into 100 sec bins |
 |
 |
| Parameter | Plot |
|---|---|
| CZT HV Monitor | 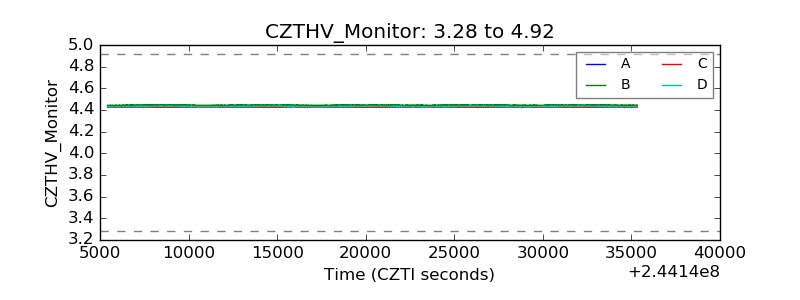 |
| D_VDD | 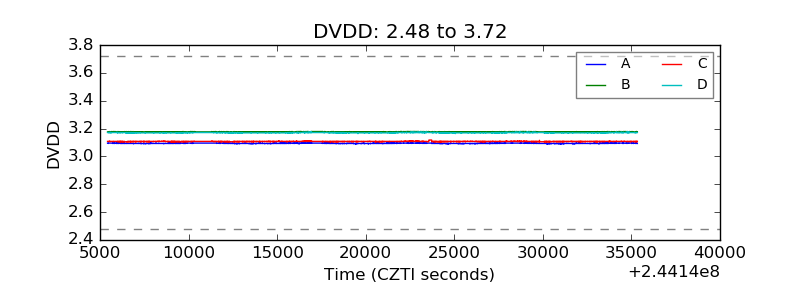 |
| Temperature 1 | 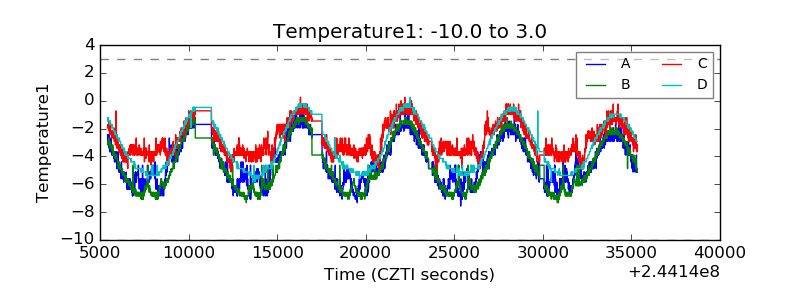 |
| Veto HV Monitor | 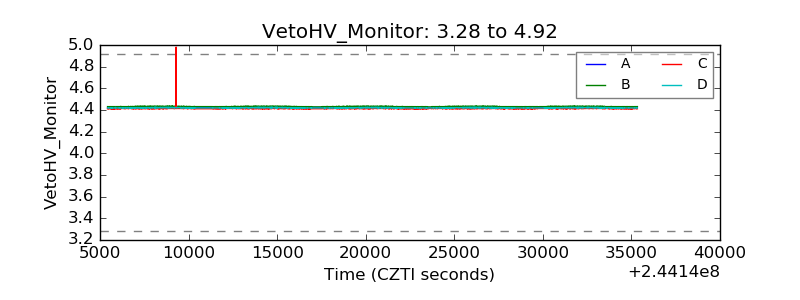 |
| Veto LLD | 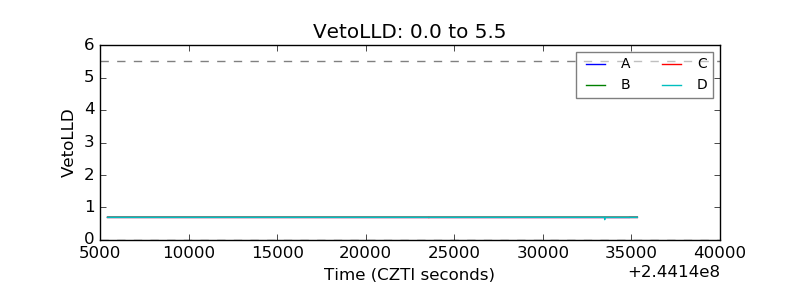 |
| Alpha Counter | 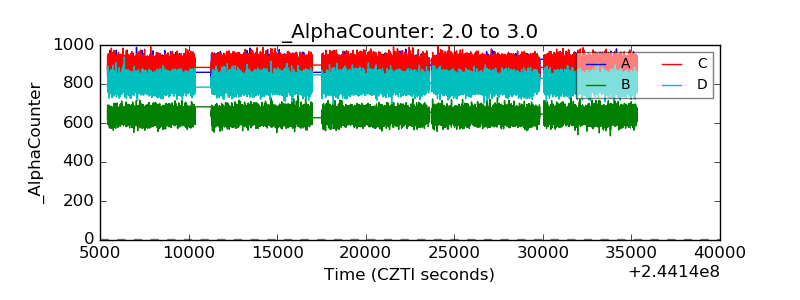 |
| _CPM_Rate | 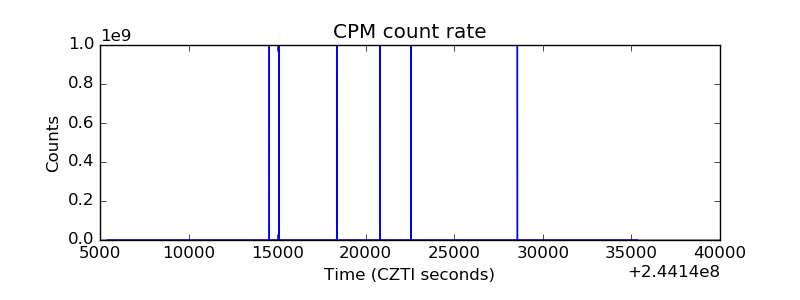 |
| CZT Counter | 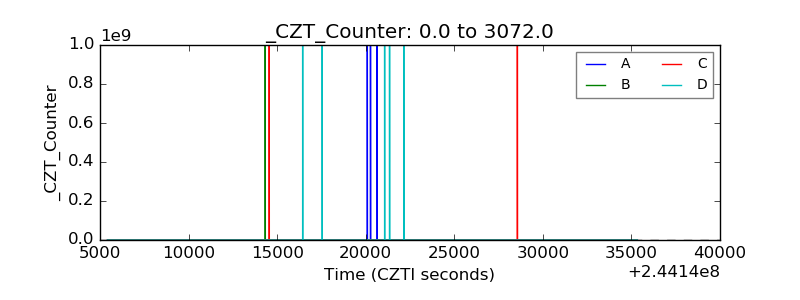 |
| +2.5 Volts monitor |  |
| +5 Volts monitor |  |
| _ROLL_ROT | 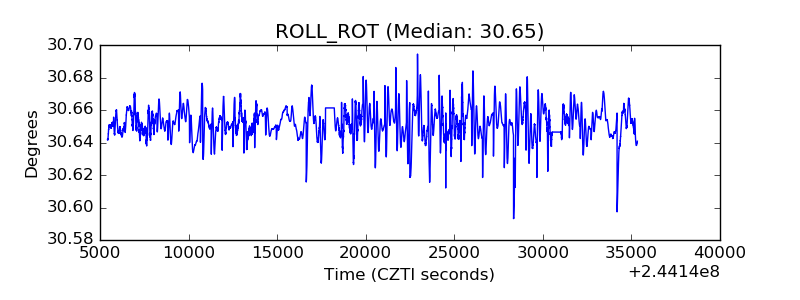 |
| _Roll_DEC | 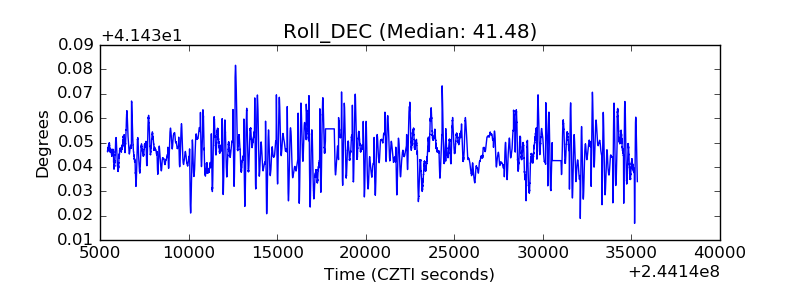 |
| _Roll_RA | 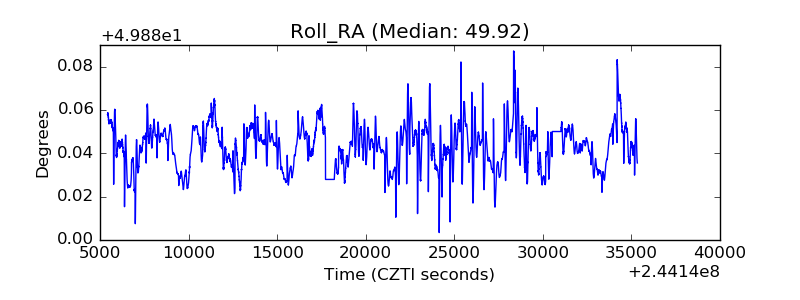 |
| Veto Counter | 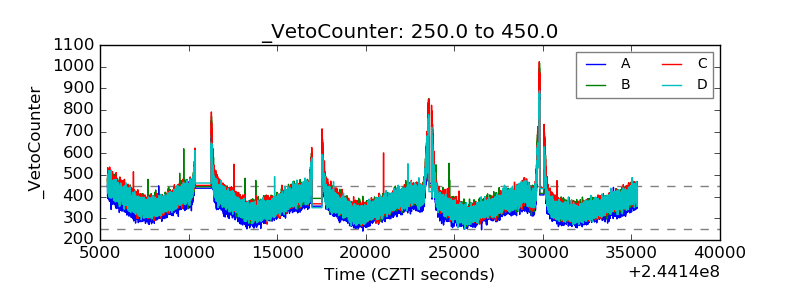 |