| Param | Original file | Final file |
|---|---|---|
| Filename | modeM0/AS1A03_086T01_9000001568cztM0_level2.fits | modeM0/AS1A03_086T01_9000001568cztM0_level2_quad_clean.evt |
| Size (bytes) | 1,944,725,760 | 1,911,176,640 |
| Size | 1.8 GB | 1.8 GB |
| Events in quadrant A | 11,373,862 | 11,008,525 |
| Events in quadrant B | 11,308,386 | 11,368,924 |
| Events in quadrant C | 11,888,016 | 11,328,532 |
| Events in quadrant D | 10,083,530 | 9,951,406 |
| Mode M9 | |||
|---|---|---|---|
| Quadrant | BADHDUFLAG | Total packets | Discarded packets |
| A | 0 | 317 | 0 |
| B | 0 | 317 | 0 |
| C | 0 | 317 | 0 |
| D | 0 | 317 | 0 |
| Mode SS | |||
|---|---|---|---|
| Quadrant | BADHDUFLAG | Total packets | Discarded packets |
| A | 0 | 4232 | 0 |
| B | 0 | 4238 | 0 |
| C | 0 | 4234 | 0 |
| D | 0 | 4232 | 0 |
| Mode M0 | |||
|---|---|---|---|
| Quadrant | BADHDUFLAG | Total packets | Discarded packets |
| A | 0 | 654691 | 0 |
| B | 0 | 563042 | 0 |
| C | 0 | 433097 | 0 |
| D | 0 | 558599 | 0 |
| Quadrant | Total seconds | Saturated seconds | Saturation percentage |
|---|---|---|---|
| A | 207578 | 20713 | 9.978418% |
| B | 207651 | 13373 | 6.440133% |
| C | 207732 | 1835 | 0.883350% |
| D | 207628 | 10078 | 4.853873% |
Noise dominated data is calculated using 1-second bins in cleaned event files. If a bin has >2000 counts, and if more than 50% of those come from <1% of pixels, then it is considered to be noise-dominated and hence unusable.
| Quadrant | # 1 sec bins | Bins with >0 counts | Bins with >2000 counts | High rate bins dominated by noise | Noise dominated (total time) | Noise dominated (detector-on time) | Marked lightcurve |
|---|---|---|---|---|---|---|---|
| A | 242018 | 207569 | 0 | 0 | 0.00% | 0.00% |  |
| B | 242018 | 208168 | 0 | 0 | 0.00% | 0.00% |  |
| C | 242018 | 208285 | 0 | 0 | 0.00% | 0.00% |  |
| D | 242018 | 207988 | 0 | 0 | 0.00% | 0.00% |  |
Top three noisy pixels from each quadrant. If the there are fewer than three noisy pixels in the level2.evt file, extra rows are filled as -1
| Pixel properties | Quadrant properties | ||||||
|---|---|---|---|---|---|---|---|
| Quadrant | DetID | PixID | Counts | Sigma | Mean | Median | Sigma |
| A | 14 | 188 | 11789 | 12.19 | 2959 | 2764 | 740.2 |
| A | 0 | 29 | 11011 | 11.14 | 2959 | 2764 | 740.2 |
| A | 14 | 204 | 9587 | 9.22 | 2959 | 2764 | 740.2 |
| B | 2 | 9 | 9677 | 11.63 | 2977 | 2829 | 588.9 |
| B | 3 | 17 | 7652 | 8.19 | 2977 | 2829 | 588.9 |
| B | 12 | 226 | 7488 | 7.91 | 2977 | 2829 | 588.9 |
| C | 12 | 241 | 8208 | 6.5 | 3145 | 2924 | 813.0 |
| C | 2 | 191 | 8069 | 6.33 | 3145 | 2924 | 813.0 |
| C | 9 | 188 | 7725 | 5.91 | 3145 | 2924 | 813.0 |
| D | 3 | 14 | 7262 | 6.04 | 2882 | 2623 | 767.7 |
| D | 6 | 231 | 7203 | 5.97 | 2882 | 2623 | 767.7 |
| D | 1 | 19 | 7167 | 5.92 | 2882 | 2623 | 767.7 |
Histogram calculated using DETX and DETY for each event in the final _common_clean file
| Quadrant A | 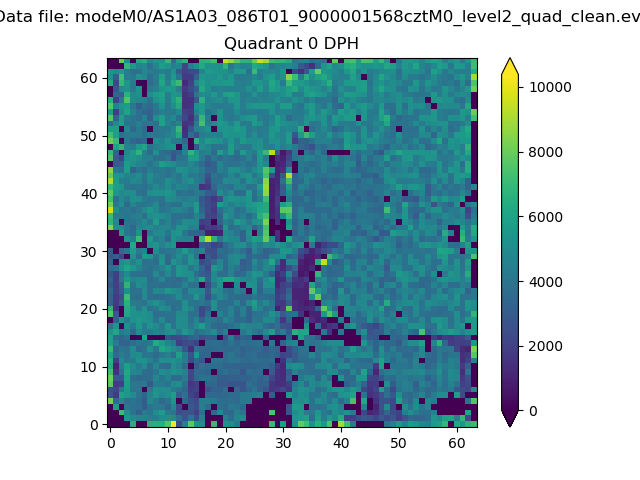 |
 |
Quadrant B |
|---|---|---|---|
| Quadrant D |  |
 |
Quadrant C |
| Plot type | Count rate plots | Images |
|---|---|---|
| Comparison with Poisson distribution Blue bars denote a histogram of data divided into 1 sec bins. Red curve is a Poisson curve with rate = median count rate of data. |
 |
 |
| Quadrant-wise count rates Data is divided into 100 sec bins |
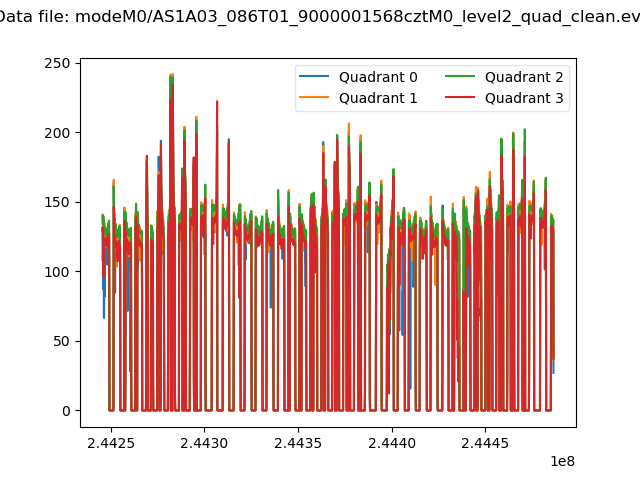 |
|
| Module-wise count rates for Quadrant A Data is divided into 100 sec bins |
 |
 |
| Module-wise count rates for Quadrant B Data is divided into 100 sec bins |
 |
 |
| Module-wise count rates for Quadrant C Data is divided into 100 sec bins |
 |
 |
| Module-wise count rates for Quadrant D Data is divided into 100 sec bins |
 |
 |
| Parameter | Plot |
|---|---|
| CZT HV Monitor |  |
| D_VDD | 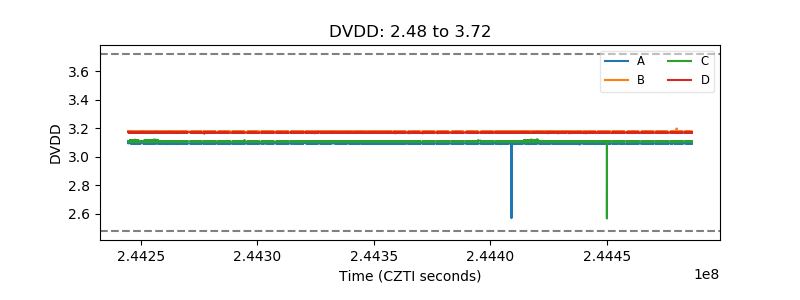 |
| Temperature 1 |  |
| Veto HV Monitor |  |
| Veto LLD | 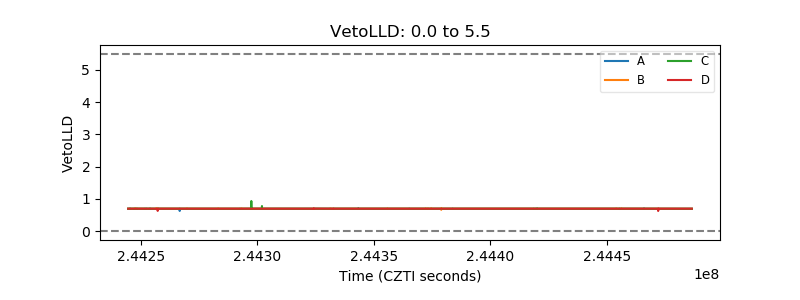 |
| Alpha Counter |  |
| _CPM_Rate |  |
| CZT Counter |  |
| +2.5 Volts monitor |  |
| +5 Volts monitor |  |
| _ROLL_ROT |  |
| _Roll_DEC | 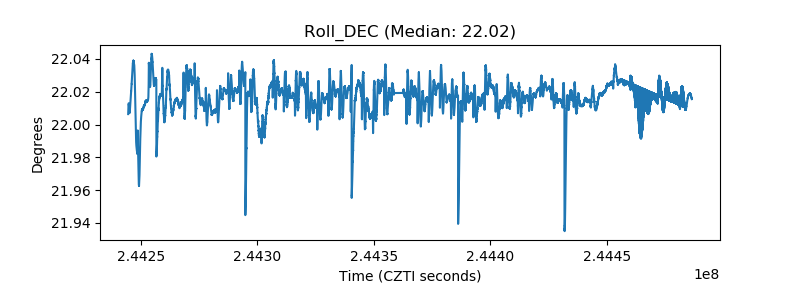 |
| _Roll_RA |  |
| Veto Counter |  |