| Param | Original file | Final file |
|---|---|---|
| Filename | modeM0/AS1A03_086T01_9000001568_10816cztM0_level2.evt | modeM0/AS1A03_086T01_9000001568_10816cztM0_level2_quad_clean.evt |
| Size (bytes) | 276,575,040 | 24,572,160 |
| Size | 263.8 MB | 23.4 MB |
| Events in quadrant A | 3,659,344 | 121,024 |
| Events in quadrant B | 1,617,753 | 164,117 |
| Events in quadrant C | 1,058,638 | 165,106 |
| Events in quadrant D | 1,901,537 | 146,269 |
| Mode M9 | |||
|---|---|---|---|
| Quadrant | BADHDUFLAG | Total packets | Discarded packets |
| A | 0 | 3 | 0 |
| B | 0 | 3 | 0 |
| C | 0 | 3 | 0 |
| D | 0 | 3 | 0 |
| Mode SS | |||
|---|---|---|---|
| Quadrant | BADHDUFLAG | Total packets | Discarded packets |
| A | 0 | 42 | 0 |
| B | 0 | 42 | 0 |
| C | 0 | 42 | 0 |
| D | 0 | 42 | 0 |
| Mode M0 | |||
|---|---|---|---|
| Quadrant | BADHDUFLAG | Total packets | Discarded packets |
| A | 0 | 12299 | 23 |
| B | 0 | 6155 | 22 |
| C | 0 | 4401 | 3 |
| D | 0 | 7077 | 5 |
| Quadrant | Total seconds | Saturated seconds | Saturation percentage |
|---|---|---|---|
| A | 2021 | 1208 | 59.772390% |
| B | 2020 | 239 | 11.831683% |
| C | 2023 | 33 | 1.631241% |
| D | 2023 | 235 | 11.616411% |
Noise dominated data is calculated using 1-second bins in cleaned event files. If a bin has >2000 counts, and if more than 50% of those come from <1% of pixels, then it is considered to be noise-dominated and hence unusable.
| Quadrant | # 1 sec bins | Bins with >0 counts | Bins with >2000 counts | High rate bins dominated by noise | Noise dominated (total time) | Noise dominated (detector-on time) | Marked lightcurve |
|---|---|---|---|---|---|---|---|
| A | 2304 | 2024 | 868 | 868 | 37.67% | 42.89% | 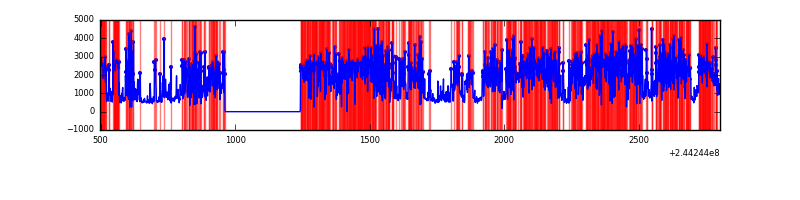 |
| B | 2304 | 2024 | 86 | 86 | 3.73% | 4.25% | 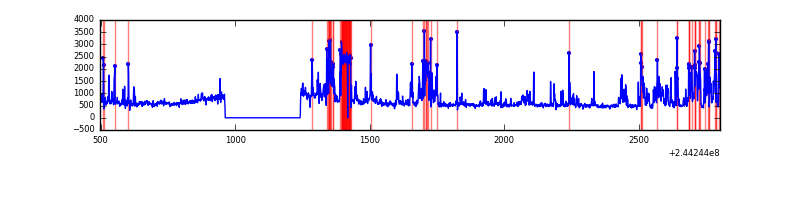 |
| C | 2304 | 2025 | 0 | 0 | 0.00% | 0.00% | 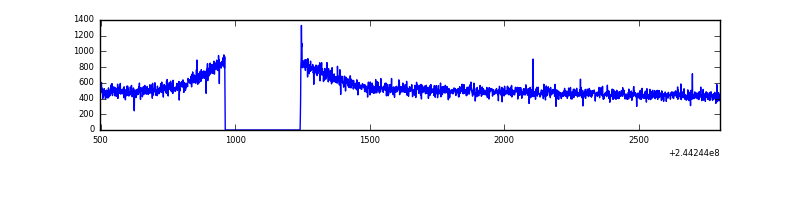 |
| D | 2304 | 2025 | 141 | 141 | 6.12% | 6.96% | 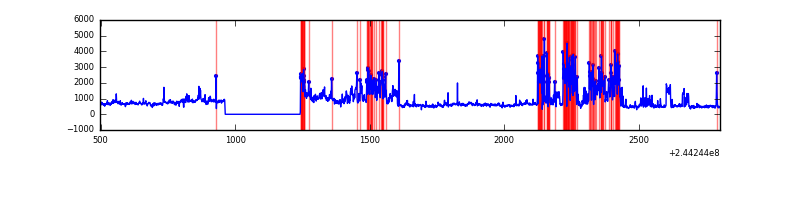 |
Top three noisy pixels from each quadrant. If the there are fewer than three noisy pixels in the level2.evt file, extra rows are filled as -1
| Pixel properties | Quadrant properties | ||||||
|---|---|---|---|---|---|---|---|
| Quadrant | DetID | PixID | Counts | Sigma | Mean | Median | Sigma |
| A | 8 | 5 | 2856537 | 67510.0 | 196 | 191 | 42.3 |
| A | 15 | 174 | 28302 | 664.41 | 196 | 191 | 42.3 |
| A | 13 | 251 | 15244 | 355.78 | 196 | 191 | 42.3 |
| B | 4 | 239 | 462543 | 8633.3 | 266 | 260 | 53.5 |
| B | 0 | 219 | 51673 | 960.16 | 266 | 260 | 53.5 |
| B | 0 | 182 | 28020 | 518.43 | 266 | 260 | 53.5 |
| C | 8 | 128 | 2564 | 35.41 | 269 | 269 | 64.8 |
| C | 5 | 207 | 2080 | 27.94 | 269 | 269 | 64.8 |
| C | 13 | 61 | 2007 | 26.82 | 269 | 269 | 64.8 |
| D | 10 | 199 | 294406 | 4474.08 | 254 | 245 | 65.7 |
| D | 2 | 136 | 215820 | 3278.82 | 254 | 245 | 65.7 |
| D | 8 | 195 | 159503 | 2422.25 | 254 | 245 | 65.7 |
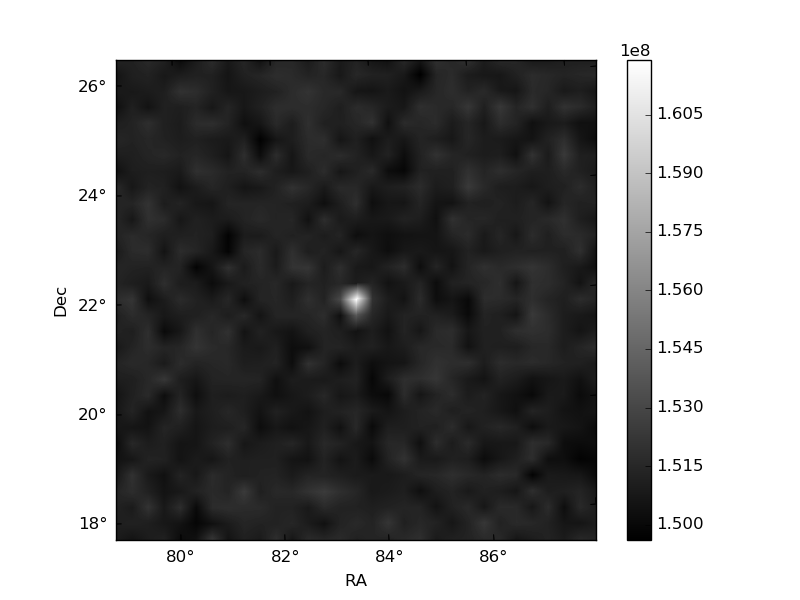
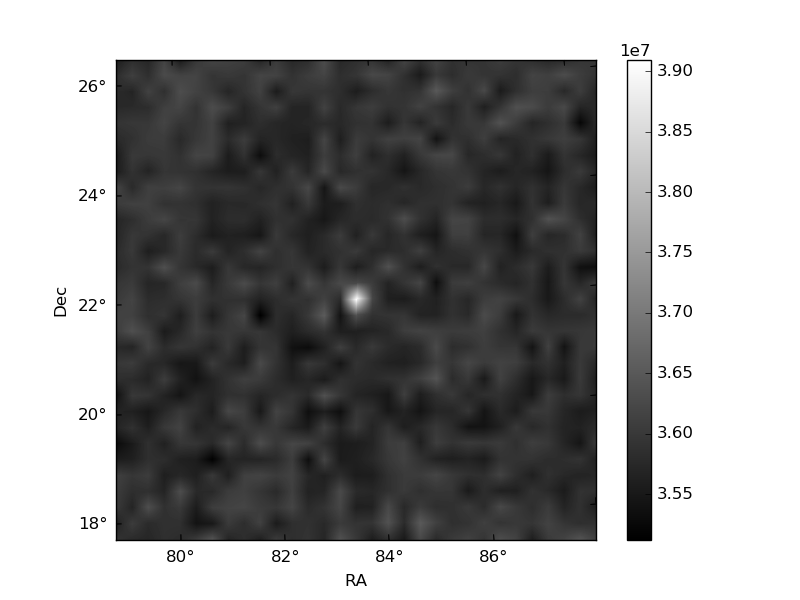
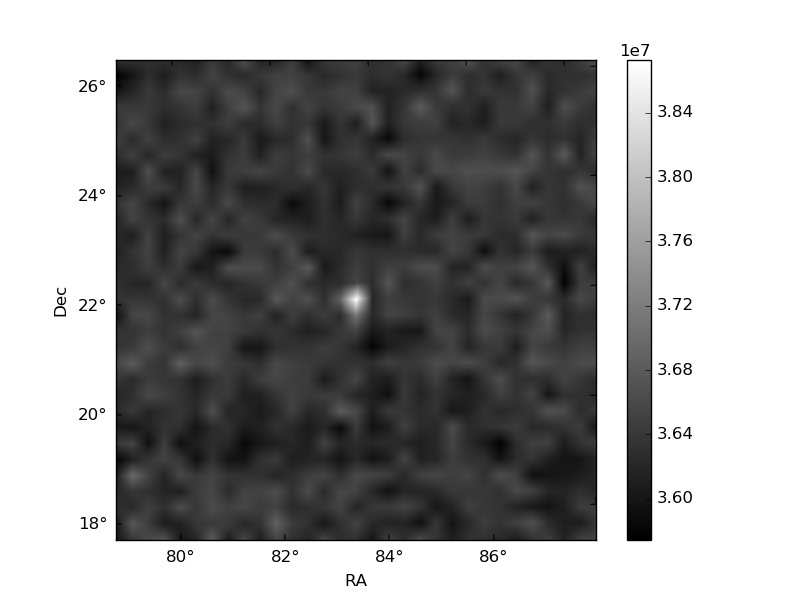
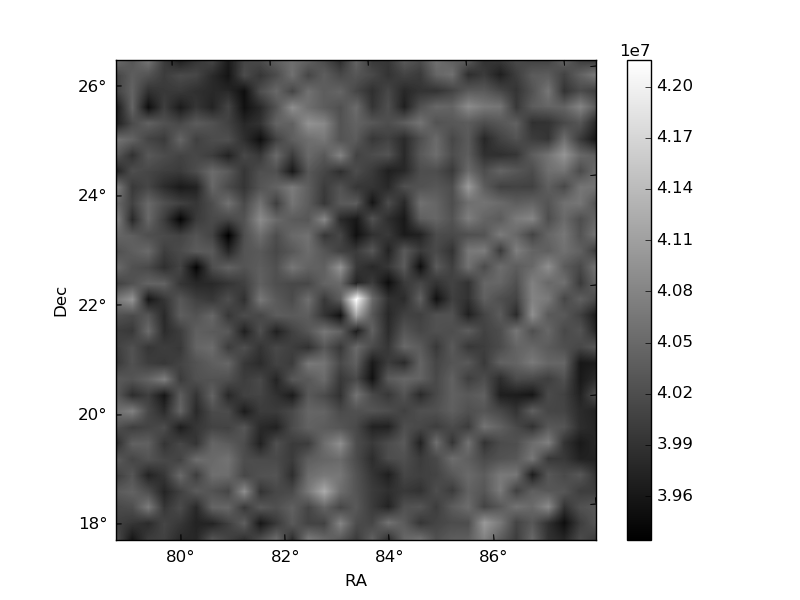
Histogram calculated using DETX and DETY for each event in the final _common_clean file
| Quadrant A | 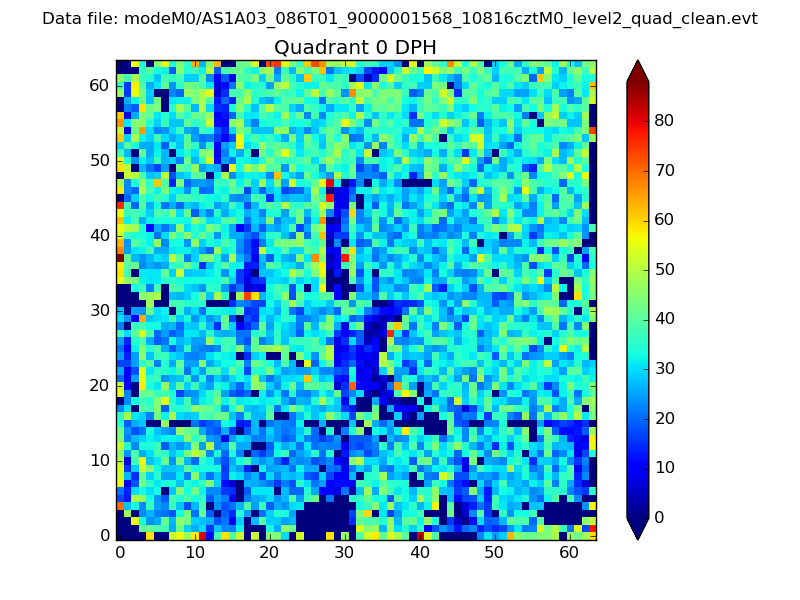 |
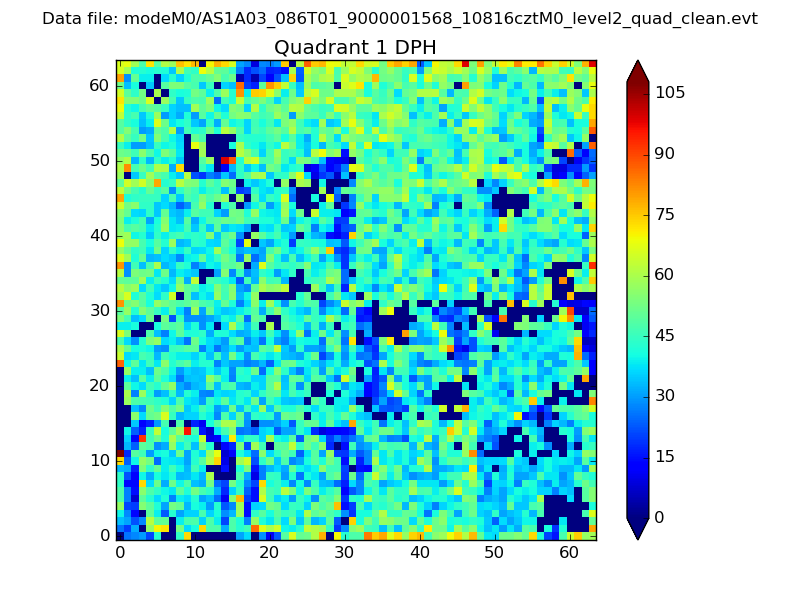 |
Quadrant B |
|---|---|---|---|
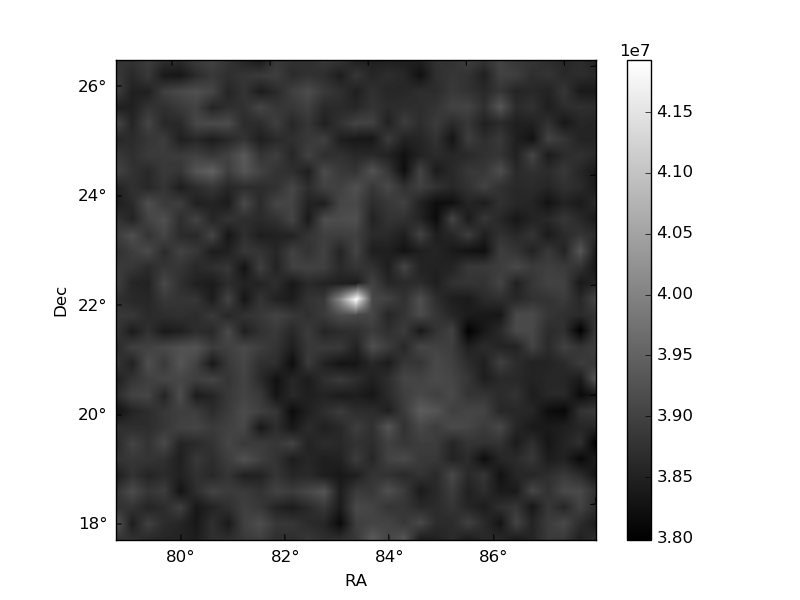
| Quadrant D | 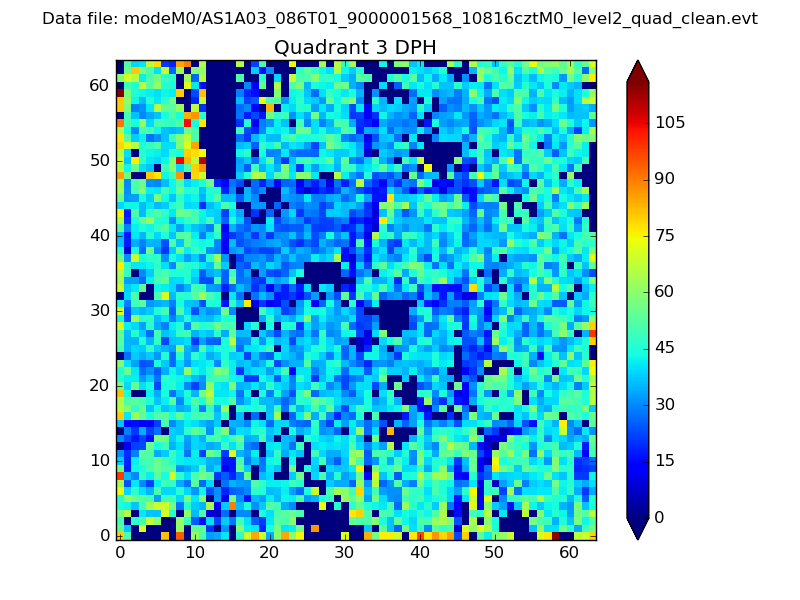 |
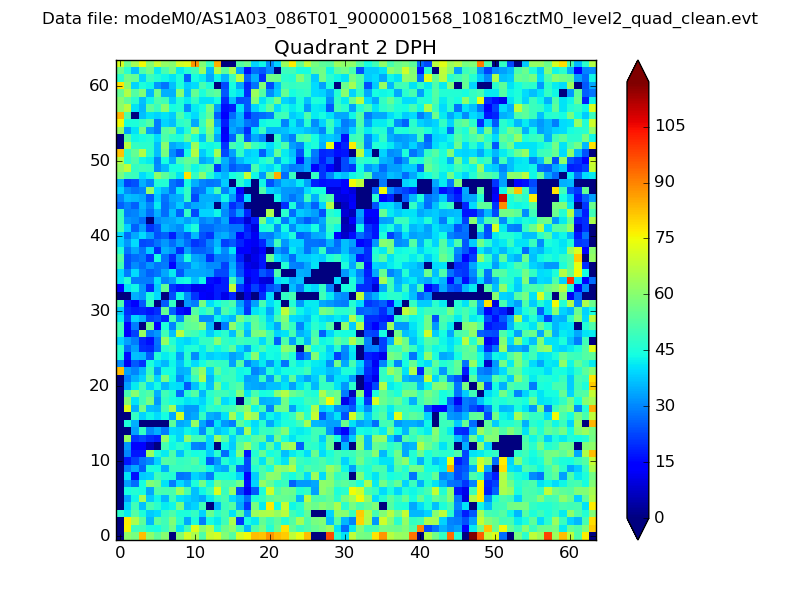 |
Quadrant C |
| Plot type | Count rate plots | Images |
|---|---|---|
| Comparison with Poisson distribution Blue bars denote a histogram of data divided into 1 sec bins. Red curve is a Poisson curve with rate = median count rate of data. |
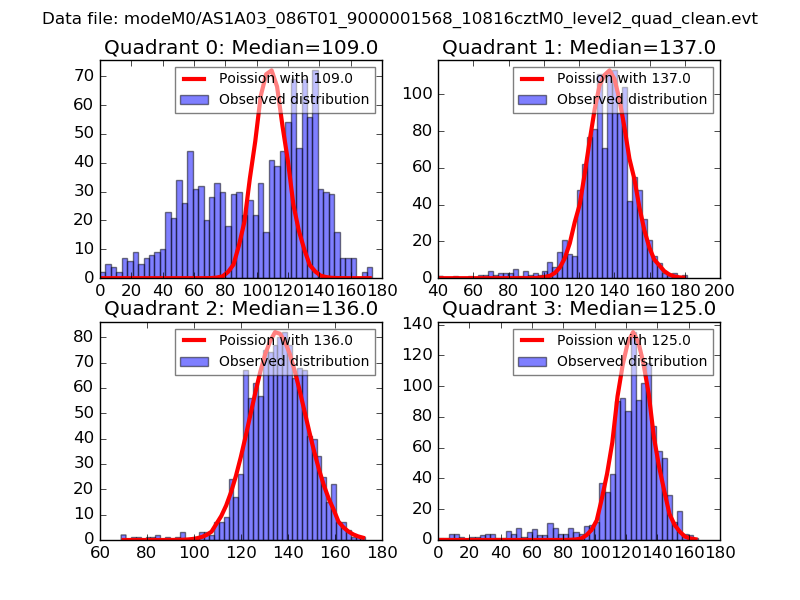 |
 |
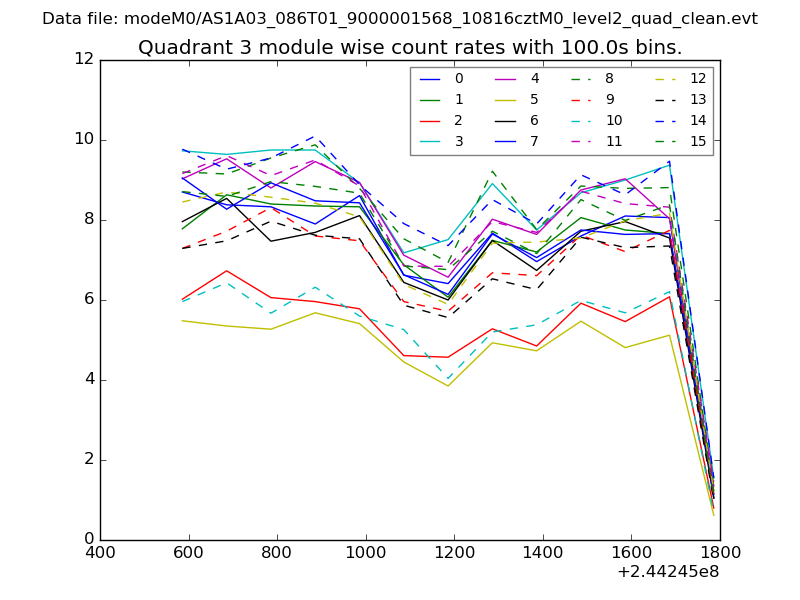
| Quadrant-wise count rates Data is divided into 100 sec bins |
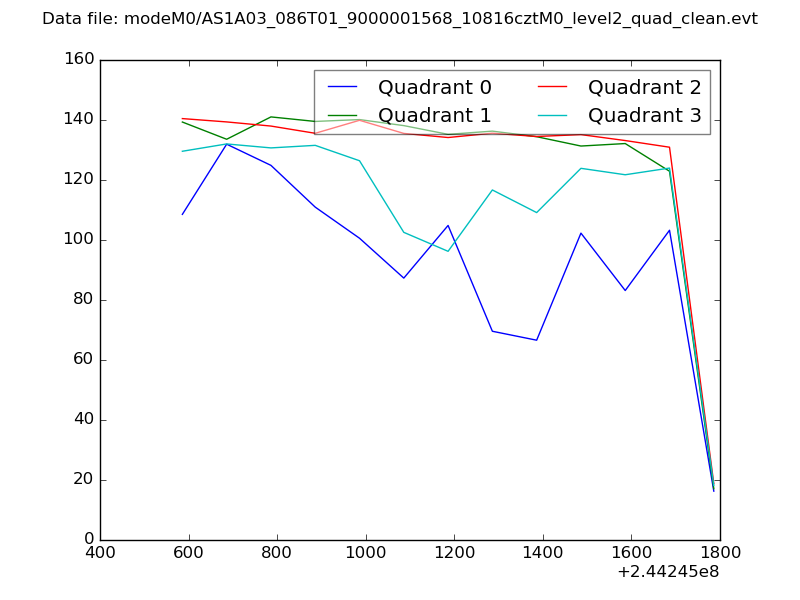 |
|
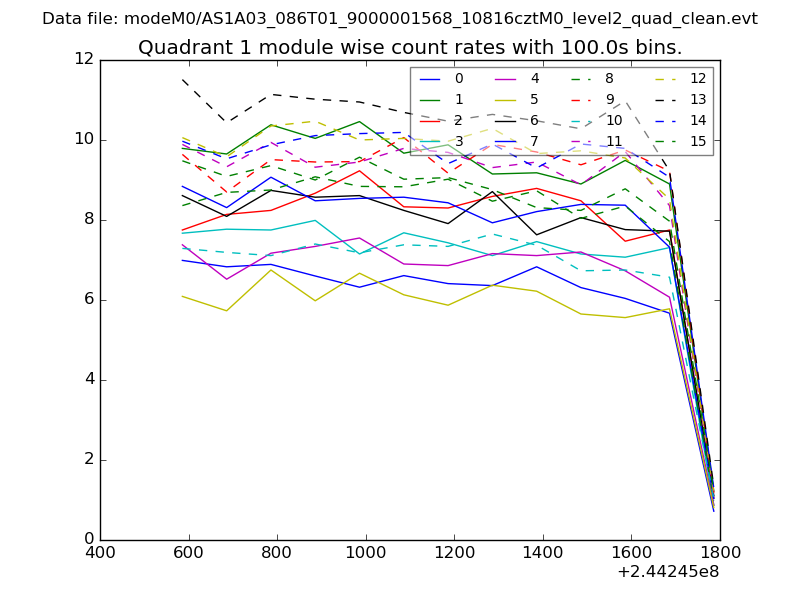
| Module-wise count rates for Quadrant A Data is divided into 100 sec bins |
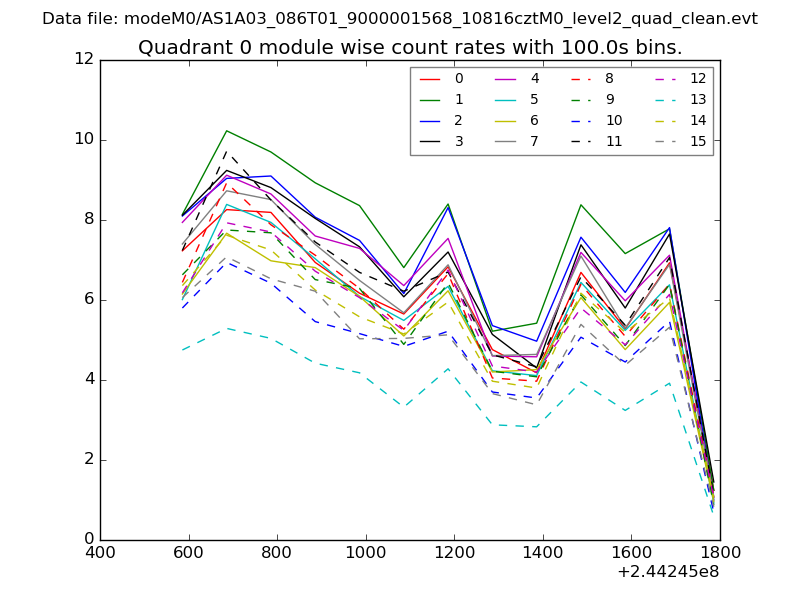 |
 |
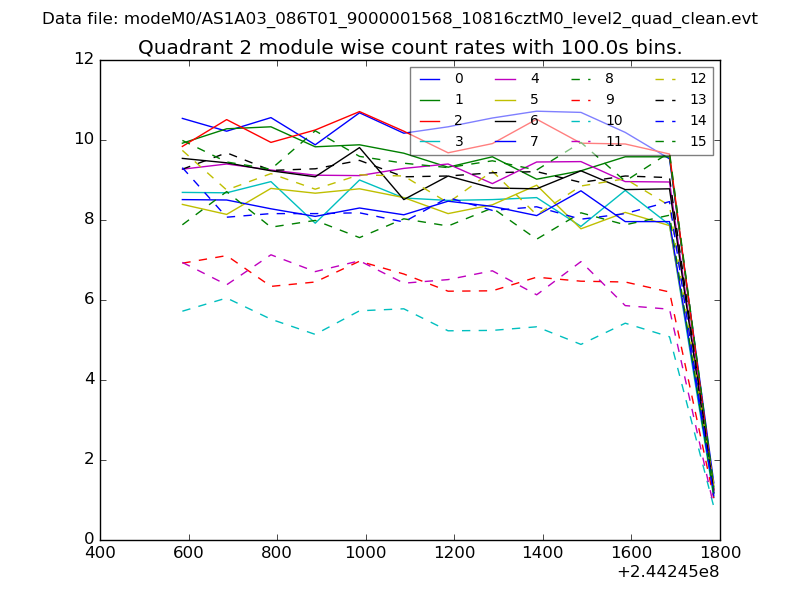
| Module-wise count rates for Quadrant B Data is divided into 100 sec bins |
 |
 |
| Module-wise count rates for Quadrant C Data is divided into 100 sec bins |
 |
 |
| Module-wise count rates for Quadrant D Data is divided into 100 sec bins |
 |
 |
| Parameter | Plot |
|---|---|
| CZT HV Monitor | 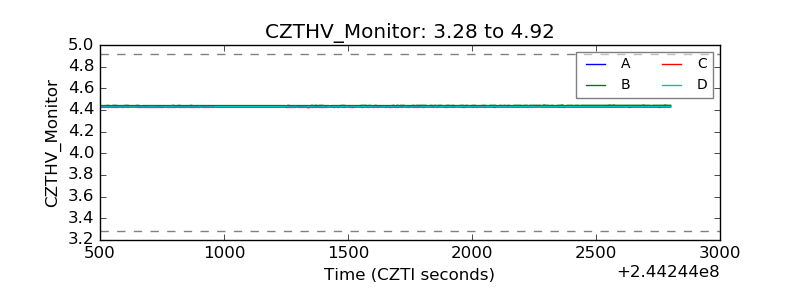 |
| D_VDD |  |
| Temperature 1 | 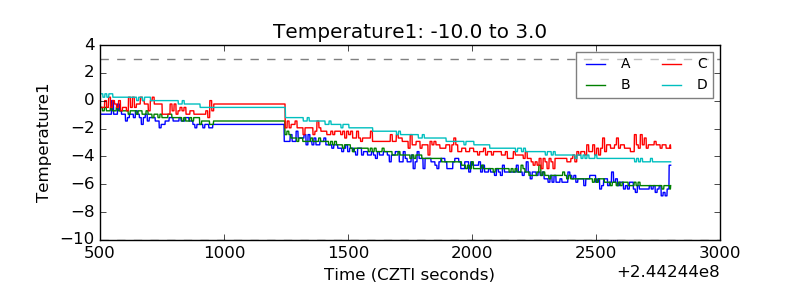 |
| Veto HV Monitor | 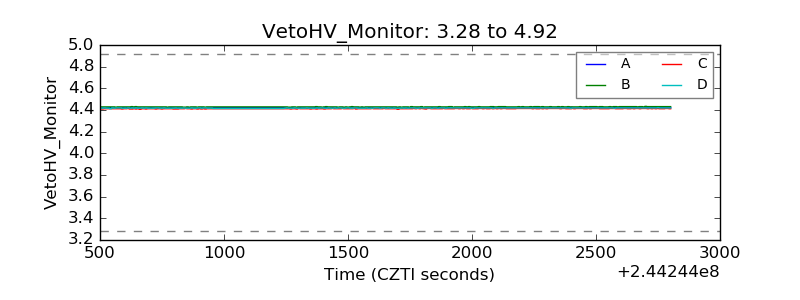 |
| Veto LLD |  |
| Alpha Counter | 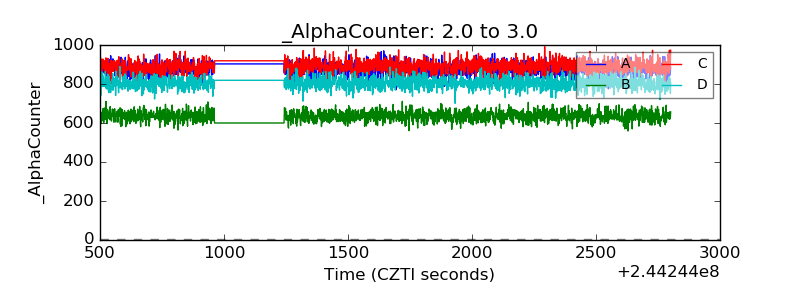 |
| _CPM_Rate | 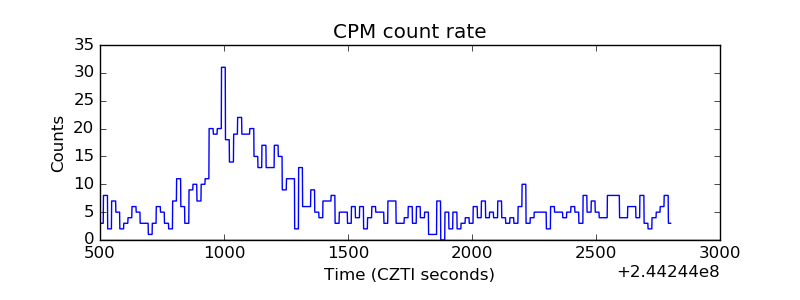 |
| CZT Counter | 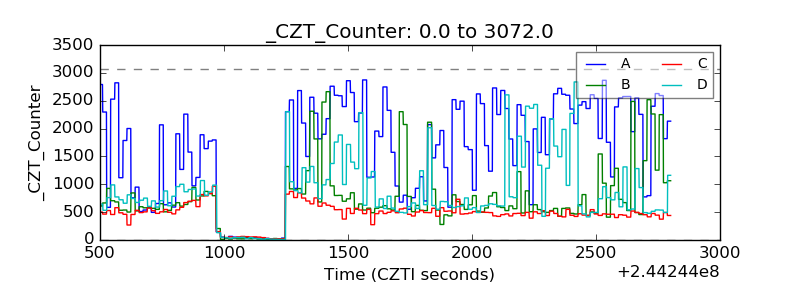 |
| +2.5 Volts monitor | 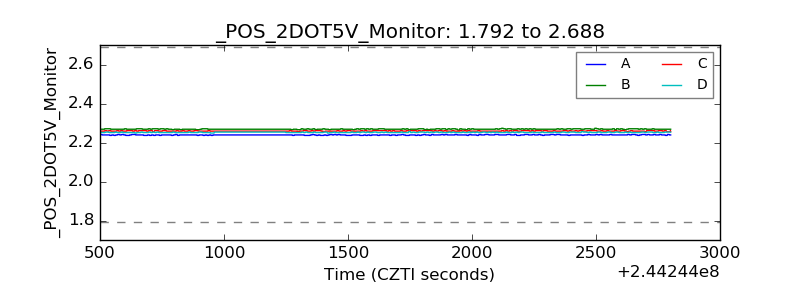 |
| +5 Volts monitor |  |
| _ROLL_ROT |  |
| _Roll_DEC | 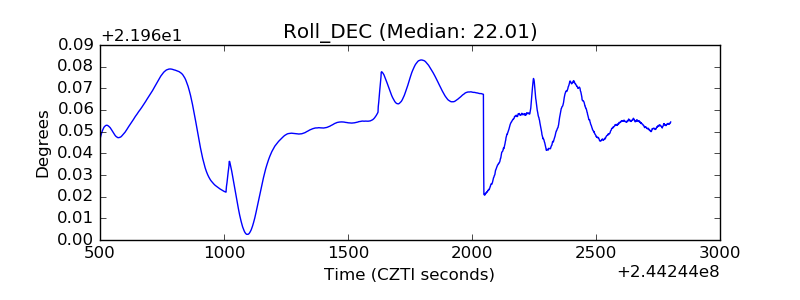 |
| _Roll_RA | 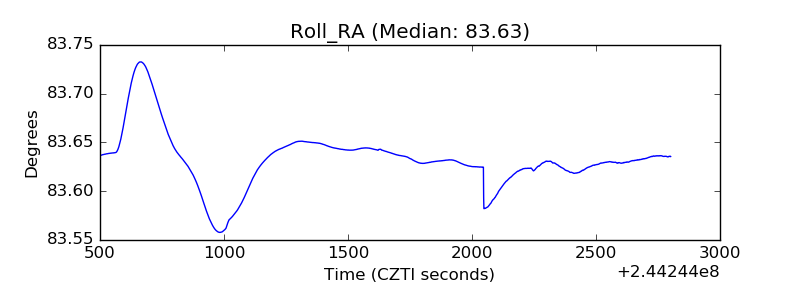 |
| Veto Counter | 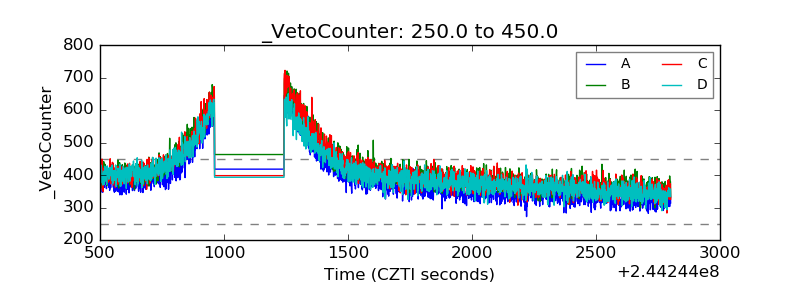 |