| Param | Original file | Final file |
|---|---|---|
| Filename | modeM0/AS1A03_086T01_9000001568_10820cztM0_level2.evt | modeM0/AS1A03_086T01_9000001568_10820cztM0_level2_quad_clean.evt |
| Size (bytes) | 18,838,080 | 1,431,360 |
| Size | 18.0 MB | 1.4 MB |
| Events in quadrant A | 143,038 | 4,211 |
| Events in quadrant B | 108,246 | 4,206 |
| Events in quadrant C | 159,451 | 5,562 |
| Events in quadrant D | 138,617 | 2,736 |
| Mode M9 | |||
|---|---|---|---|
| Quadrant | BADHDUFLAG | Total packets | Discarded packets |
| A | 0 | 13 | 12 |
| B | 0 | 13 | 12 |
| C | 0 | 11 | 11 |
| D | 0 | 10 | 9 |
| Mode SS | |||
|---|---|---|---|
| Quadrant | BADHDUFLAG | Total packets | Discarded packets |
| A | 0 | 106 | 96 |
| B | 0 | 106 | 100 |
| C | 0 | 113 | 109 |
| D | 0 | 102 | 98 |
| Mode M0 | |||
|---|---|---|---|
| Quadrant | BADHDUFLAG | Total packets | Discarded packets |
| A | 0 | 15673 | 15088 |
| B | 0 | 16329 | 15903 |
| C | 0 | 10406 | 9729 |
| D | 0 | 14335 | 13784 |
| Quadrant | Total seconds | Saturated seconds | Saturation percentage |
|---|---|---|---|
| A | 271 | 1 | 0.369004% |
| B | 170 | 2 | 1.176471% |
| C | 335 | 0 | 0.000000% |
| D | 215 | 1 | 0.465116% |
Noise dominated data is calculated using 1-second bins in cleaned event files. If a bin has >2000 counts, and if more than 50% of those come from <1% of pixels, then it is considered to be noise-dominated and hence unusable.
| Quadrant | # 1 sec bins | Bins with >0 counts | Bins with >2000 counts | High rate bins dominated by noise | Noise dominated (total time) | Noise dominated (detector-on time) | Marked lightcurve |
|---|---|---|---|---|---|---|---|
| A | 2750 | 480 | 0 | 0 | 0.00% | 0.00% | 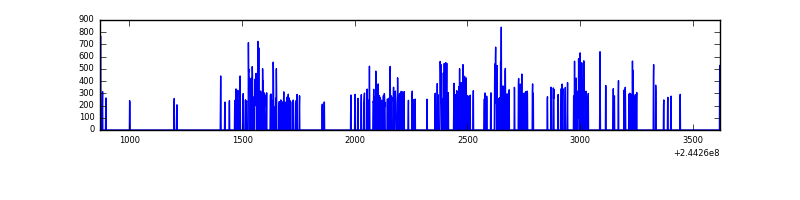 |
| B | 2615 | 303 | 0 | 0 | 0.00% | 0.00% | 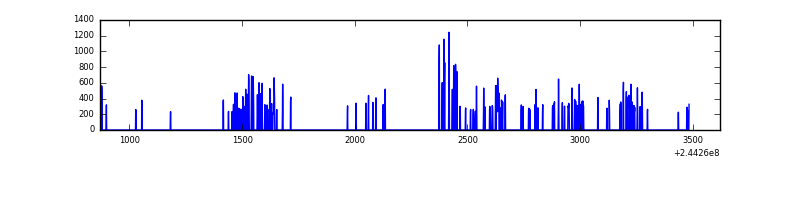 |
| C | 2689 | 593 | 0 | 0 | 0.00% | 0.00% | 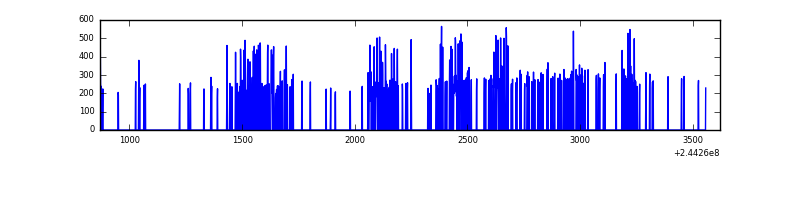 |
| D | 2648 | 396 | 0 | 0 | 0.00% | 0.00% | 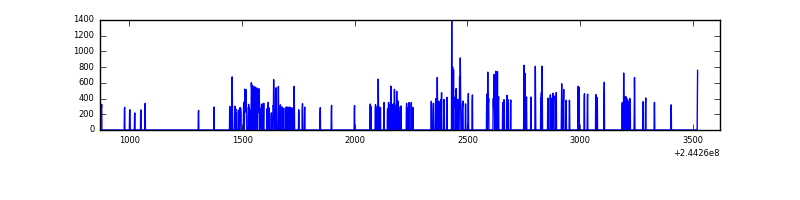 |
Top three noisy pixels from each quadrant. If the there are fewer than three noisy pixels in the level2.evt file, extra rows are filled as -1
| Pixel properties | Quadrant properties | ||||||
|---|---|---|---|---|---|---|---|
| Quadrant | DetID | PixID | Counts | Sigma | Mean | Median | Sigma |
| A | 8 | 5 | 9627 | 1045.98 | 34 | 33 | 9.2 |
| A | 15 | 174 | 547 | 56.04 | 34 | 33 | 9.2 |
| A | 0 | 226 | 315 | 30.74 | 34 | 33 | 9.2 |
| B | 4 | 239 | 16659 | 2691.22 | 21 | 20 | 6.2 |
| B | 0 | 197 | 1952 | 312.49 | 21 | 20 | 6.2 |
| B | 0 | 245 | 1635 | 261.21 | 21 | 20 | 6.2 |
| C | 13 | 61 | 313 | 24.21 | 40 | 40 | 11.3 |
| C | 8 | 222 | 239 | 17.65 | 40 | 40 | 11.3 |
| C | 3 | 202 | 109 | 6.12 | 40 | 40 | 11.3 |
| D | 8 | 195 | 19393 | 2308.77 | 26 | 25 | 8.4 |
| D | 1 | 52 | 12549 | 1492.93 | 26 | 25 | 8.4 |
| D | 7 | 71 | 1582 | 185.6 | 26 | 25 | 8.4 |
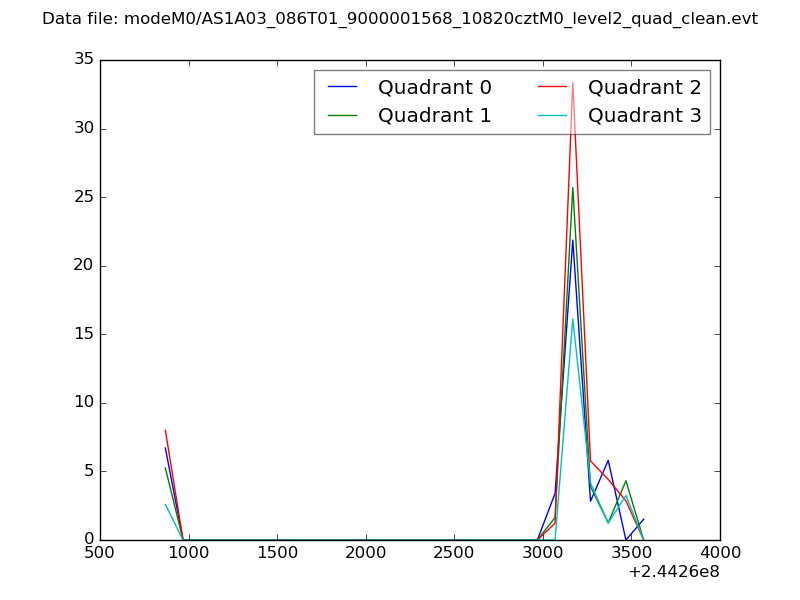
Histogram calculated using DETX and DETY for each event in the final _common_clean file
| Quadrant A | 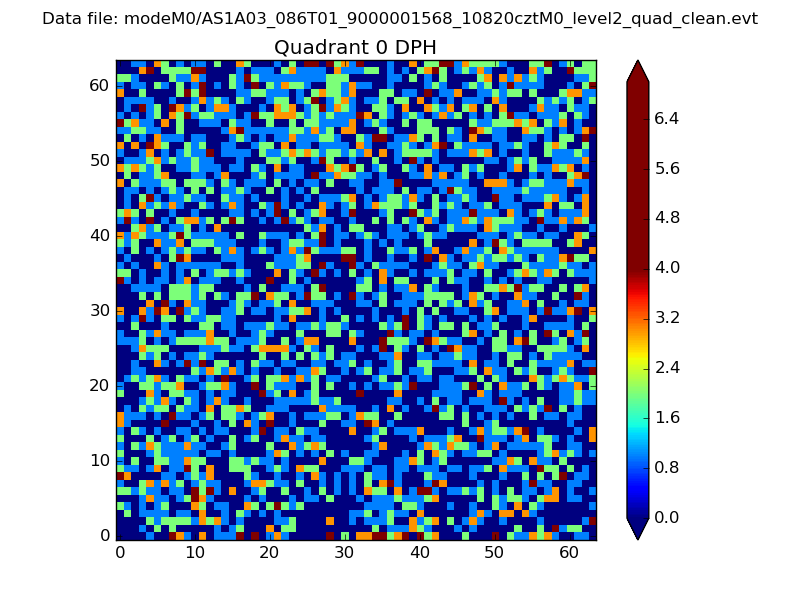 |
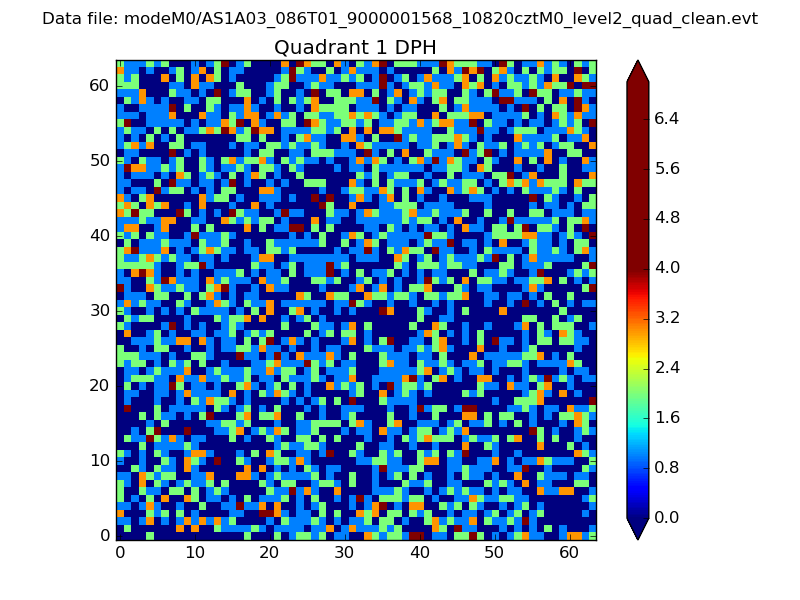 |
Quadrant B |
|---|---|---|---|
| Quadrant D |  |
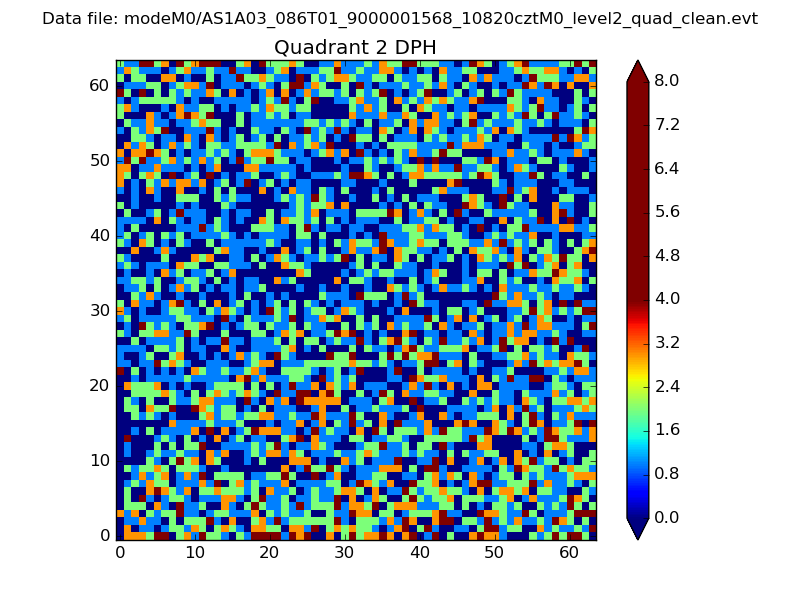 |
Quadrant C |
| Plot type | Count rate plots | Images |
|---|---|---|
| Comparison with Poisson distribution Blue bars denote a histogram of data divided into 1 sec bins. Red curve is a Poisson curve with rate = median count rate of data. |
 |
 |
| Quadrant-wise count rates Data is divided into 100 sec bins |
 |
|
| Module-wise count rates for Quadrant A Data is divided into 100 sec bins |
 |
 |
| Module-wise count rates for Quadrant B Data is divided into 100 sec bins |
 |
 |
| Module-wise count rates for Quadrant C Data is divided into 100 sec bins |
 |
 |
| Module-wise count rates for Quadrant D Data is divided into 100 sec bins |
 |
 |
| Parameter | Plot |
|---|---|
| CZT HV Monitor |  |
| D_VDD | 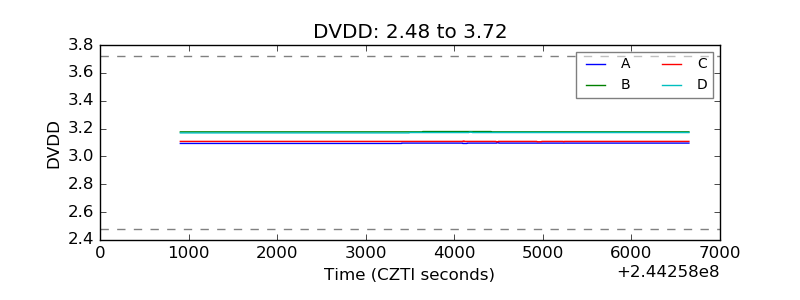 |
| Temperature 1 | 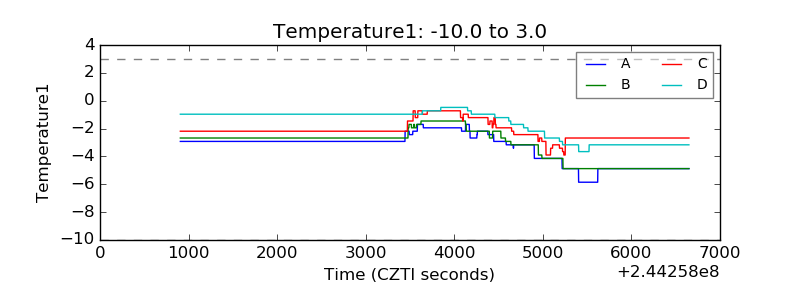 |
| Veto HV Monitor | 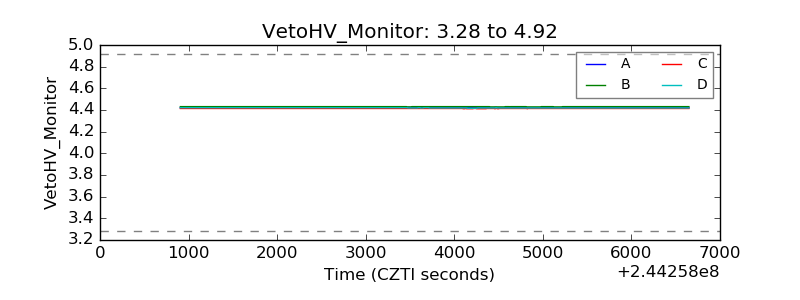 |
| Veto LLD | 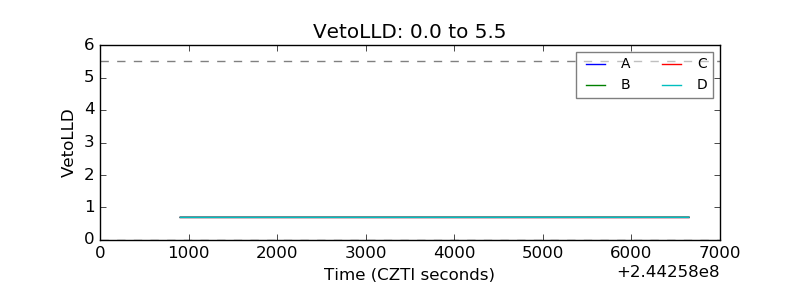 |
| Alpha Counter | 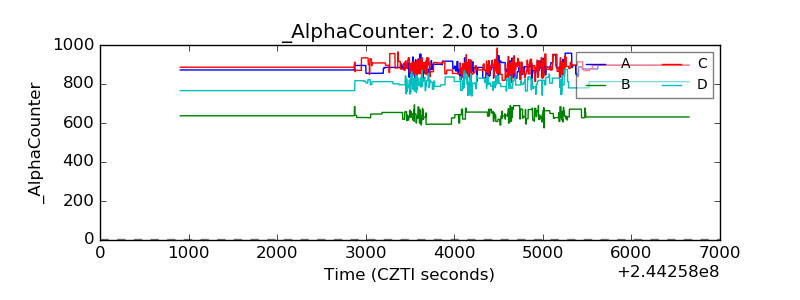 |
| _CPM_Rate | 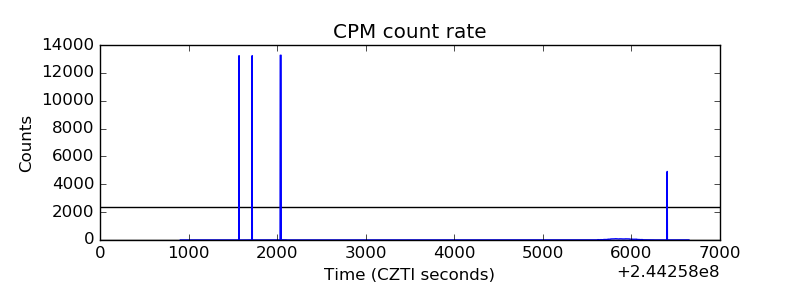 |
| CZT Counter | 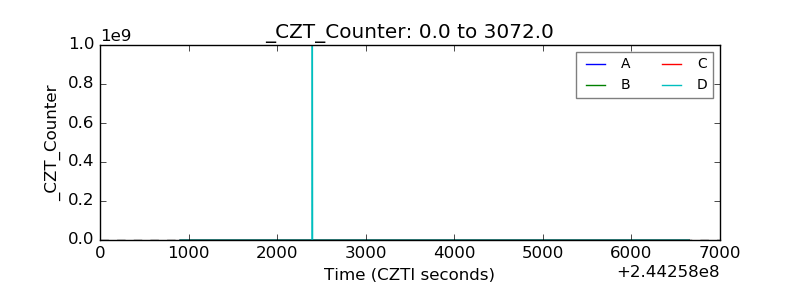 |
| +2.5 Volts monitor |  |
| +5 Volts monitor |  |
| _ROLL_ROT | 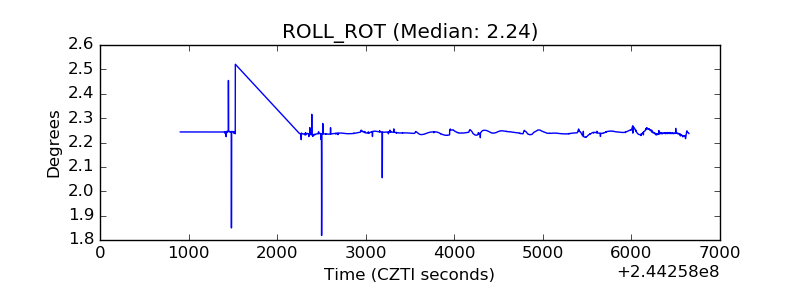 |
| _Roll_DEC | 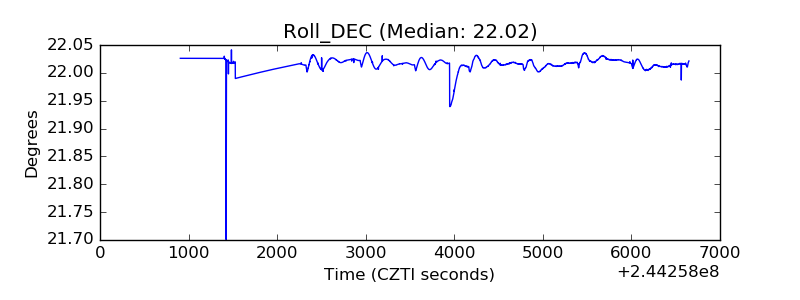 |
| _Roll_RA | 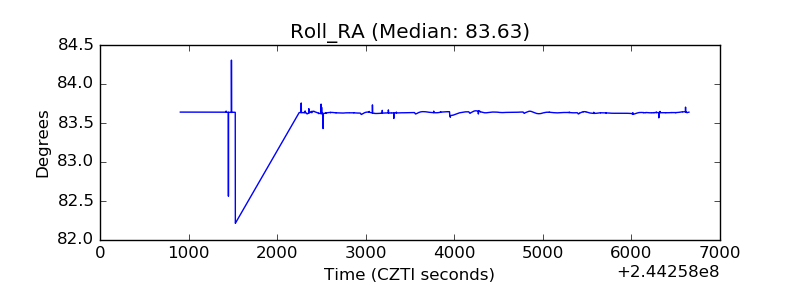 |
| Veto Counter |  |