| Param | Original file | Final file |
|---|---|---|
| Filename | modeM0/AS1A03_086T01_9000001568_10822cztM0_level2.evt | modeM0/AS1A03_086T01_9000001568_10822cztM0_level2_quad_clean.evt |
| Size (bytes) | 1,275,278,400 | 188,896,320 |
| Size | 1.2 GB | 180.1 MB |
| Events in quadrant A | 12,827,692 | 1,137,676 |
| Events in quadrant B | 9,627,300 | 1,215,016 |
| Events in quadrant C | 6,428,723 | 1,242,277 |
| Events in quadrant D | 8,824,139 | 1,188,582 |
| Mode M9 | |||
|---|---|---|---|
| Quadrant | BADHDUFLAG | Total packets | Discarded packets |
| A | 0 | 24 | 0 |
| B | 0 | 24 | 0 |
| C | 0 | 24 | 0 |
| D | 0 | 24 | 0 |
| Mode SS | |||
|---|---|---|---|
| Quadrant | BADHDUFLAG | Total packets | Discarded packets |
| A | 0 | 280 | 0 |
| B | 0 | 280 | 0 |
| C | 0 | 280 | 0 |
| D | 0 | 280 | 0 |
| Mode M0 | |||
|---|---|---|---|
| Quadrant | BADHDUFLAG | Total packets | Discarded packets |
| A | 0 | 47333 | 4 |
| B | 0 | 37385 | 3 |
| C | 0 | 28126 | 3 |
| D | 0 | 36002 | 3 |
| Quadrant | Total seconds | Saturated seconds | Saturation percentage |
|---|---|---|---|
| A | 13550 | 2054 | 15.158672% |
| B | 13550 | 918 | 6.774908% |
| C | 13550 | 131 | 0.966790% |
| D | 13550 | 246 | 1.815498% |
Noise dominated data is calculated using 1-second bins in cleaned event files. If a bin has >2000 counts, and if more than 50% of those come from <1% of pixels, then it is considered to be noise-dominated and hence unusable.
| Quadrant | # 1 sec bins | Bins with >0 counts | Bins with >2000 counts | High rate bins dominated by noise | Noise dominated (total time) | Noise dominated (detector-on time) | Marked lightcurve |
|---|---|---|---|---|---|---|---|
| A | 16075 | 13552 | 1208 | 1208 | 7.51% | 8.91% | 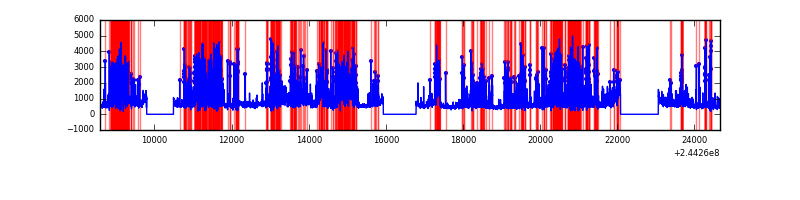 |
| B | 16075 | 13553 | 480 | 480 | 2.99% | 3.54% | 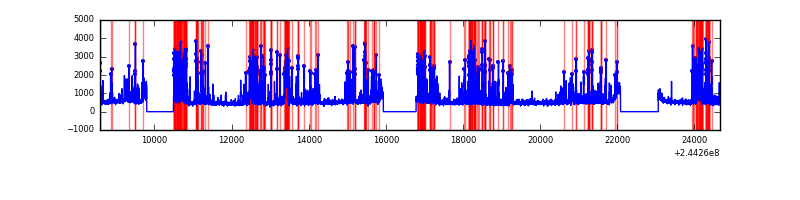 |
| C | 16075 | 13553 | 1 | 1 | 0.01% | 0.01% | 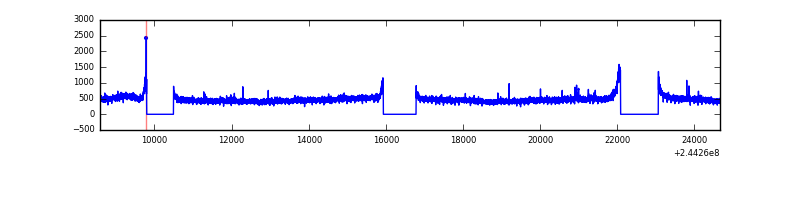 |
| D | 16075 | 13552 | 72 | 72 | 0.45% | 0.53% | 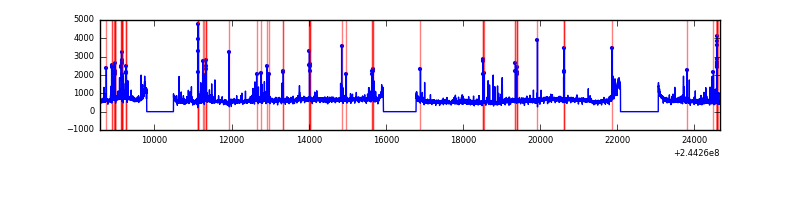 |
Top three noisy pixels from each quadrant. If the there are fewer than three noisy pixels in the level2.evt file, extra rows are filled as -1
| Pixel properties | Quadrant properties | ||||||
|---|---|---|---|---|---|---|---|
| Quadrant | DetID | PixID | Counts | Sigma | Mean | Median | Sigma |
| A | 8 | 5 | 6578122 | 20319.6 | 1593 | 1565 | 323.7 |
| A | 13 | 251 | 98500 | 299.5 | 1593 | 1565 | 323.7 |
| A | 0 | 226 | 14244 | 39.17 | 1593 | 1565 | 323.7 |
| B | 4 | 239 | 2903095 | 9147.44 | 1660 | 1629 | 317.2 |
| B | 15 | 204 | 79346 | 245.02 | 1660 | 1629 | 317.2 |
| B | 0 | 85 | 40401 | 122.23 | 1660 | 1629 | 317.2 |
| C | 3 | 254 | 23570 | 57.73 | 1640 | 1655 | 379.6 |
| C | 13 | 61 | 12161 | 27.67 | 1640 | 1655 | 379.6 |
| C | 8 | 222 | 7163 | 14.51 | 1640 | 1655 | 379.6 |
| D | 8 | 195 | 1325746 | 3343.62 | 1647 | 1608 | 396.0 |
| D | 1 | 52 | 594010 | 1495.89 | 1647 | 1608 | 396.0 |
| D | 13 | 104 | 207685 | 520.37 | 1647 | 1608 | 396.0 |
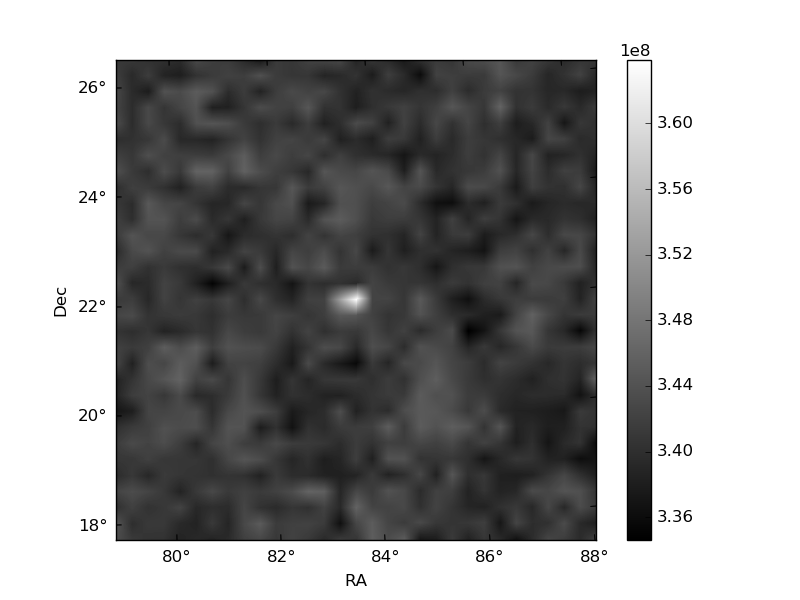
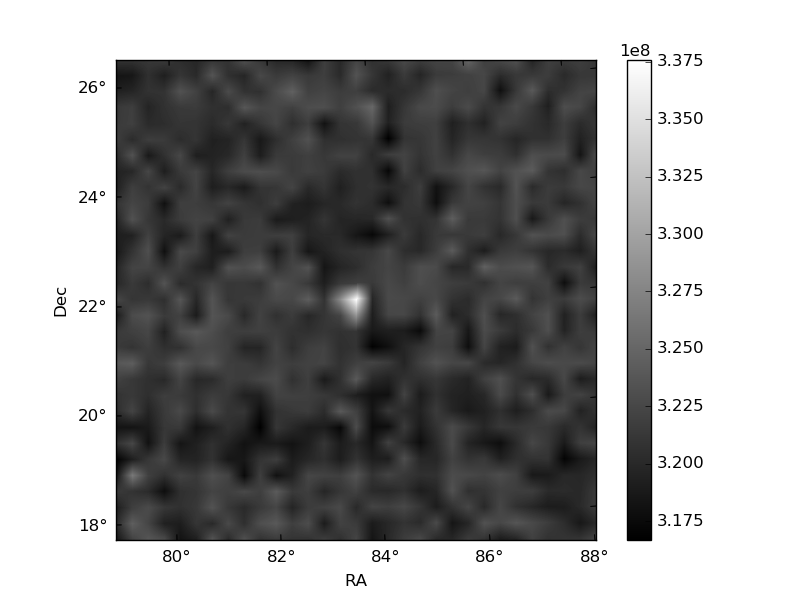
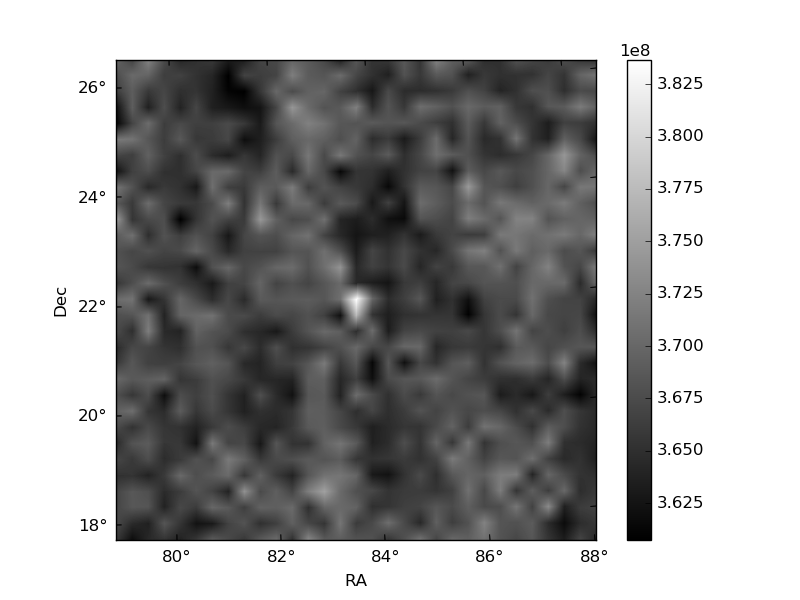
Histogram calculated using DETX and DETY for each event in the final _common_clean file
| Quadrant A | 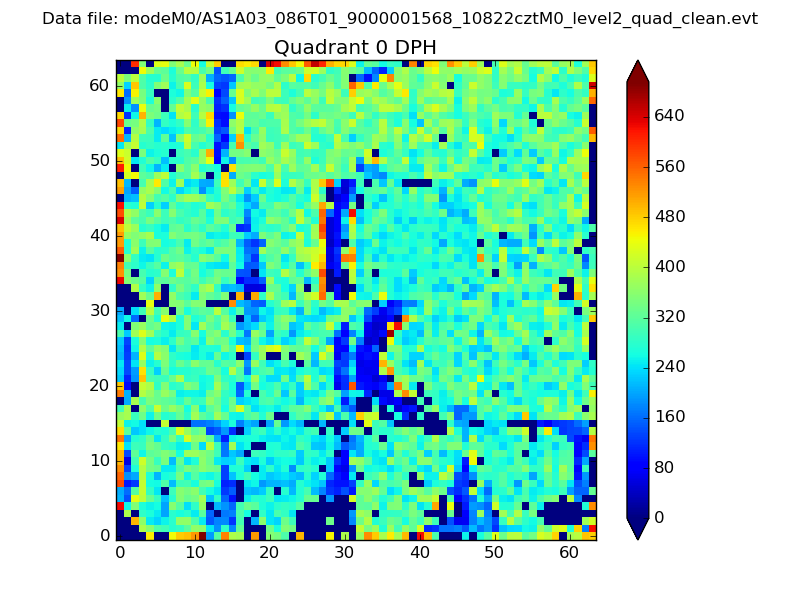 |
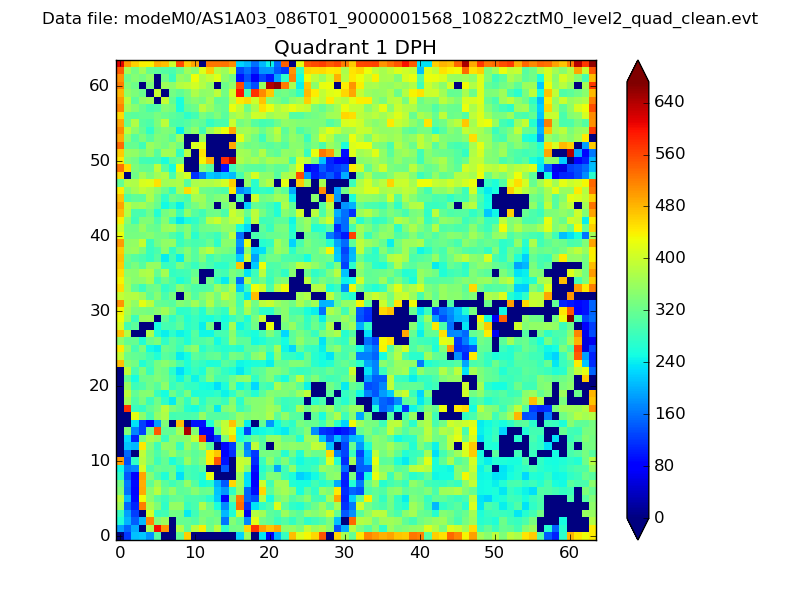 |
Quadrant B |
|---|---|---|---|
| Quadrant D | 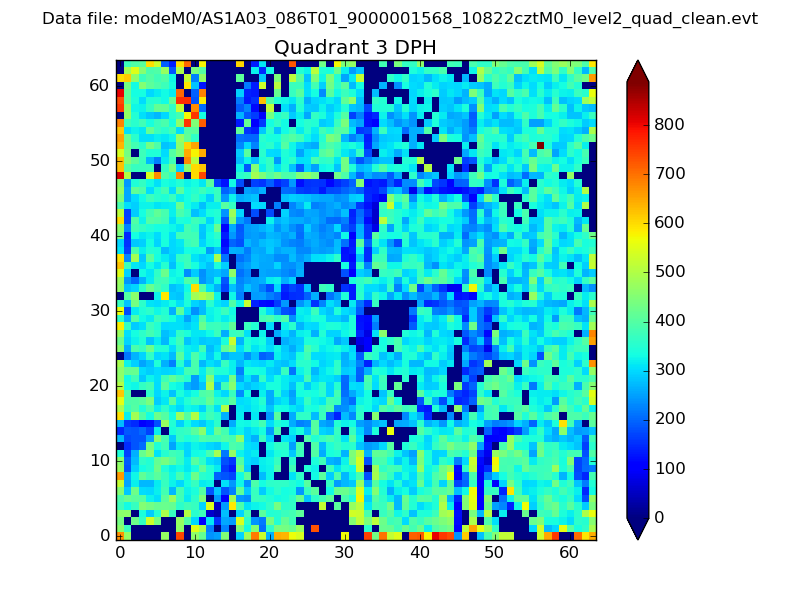 |
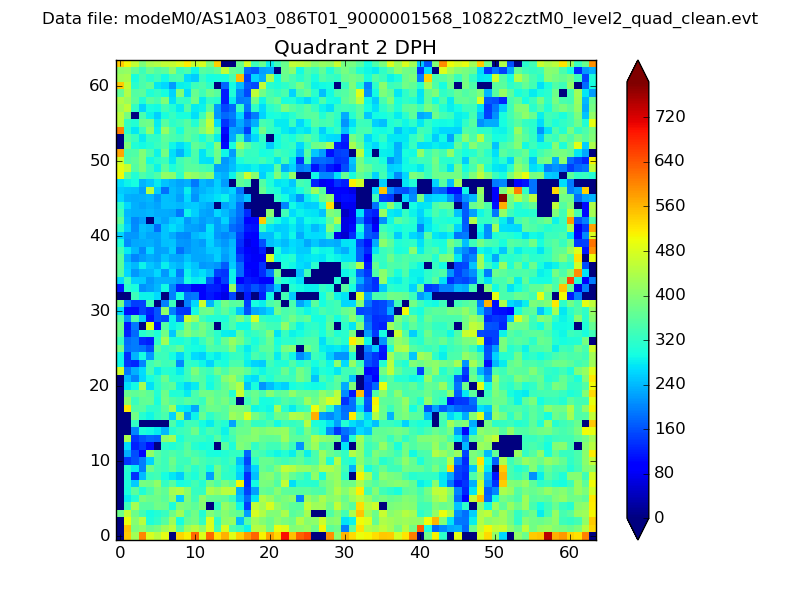 |
Quadrant C |
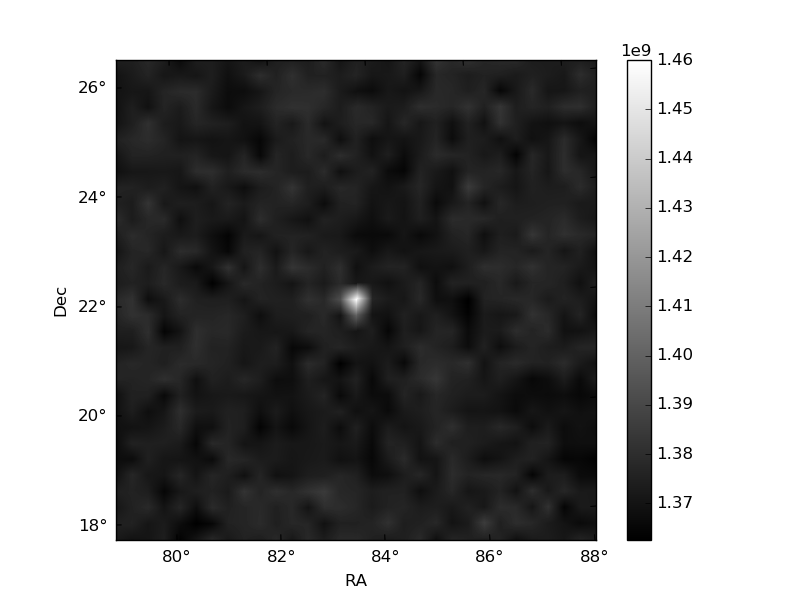
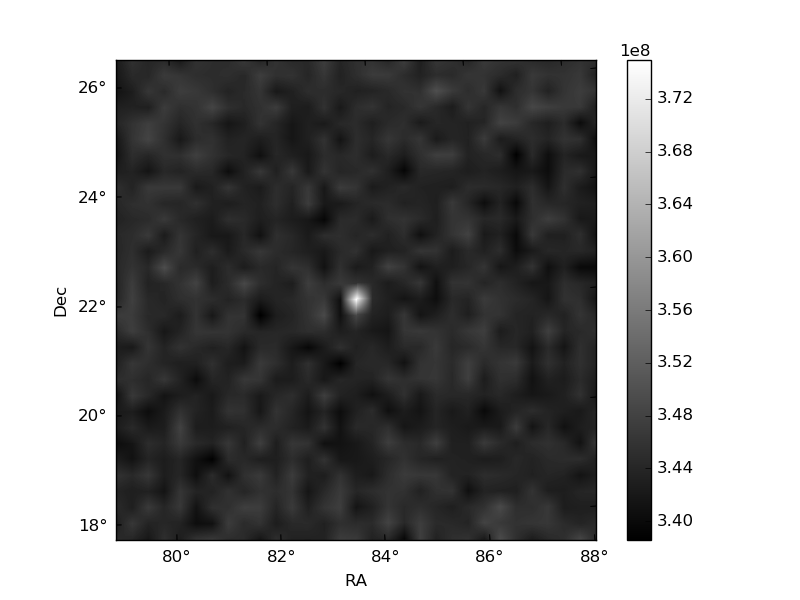
| Plot type | Count rate plots | Images |
|---|---|---|
| Comparison with Poisson distribution Blue bars denote a histogram of data divided into 1 sec bins. Red curve is a Poisson curve with rate = median count rate of data. |
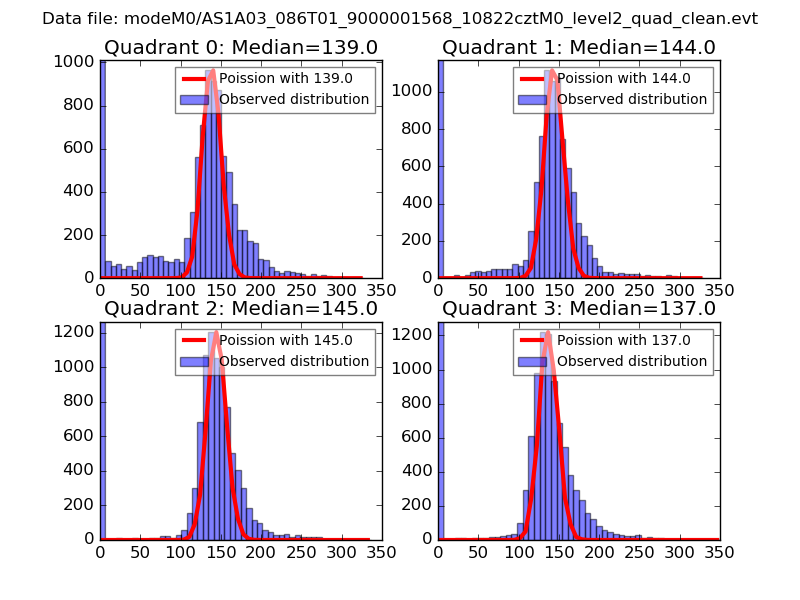 |
 |
| Quadrant-wise count rates Data is divided into 100 sec bins |
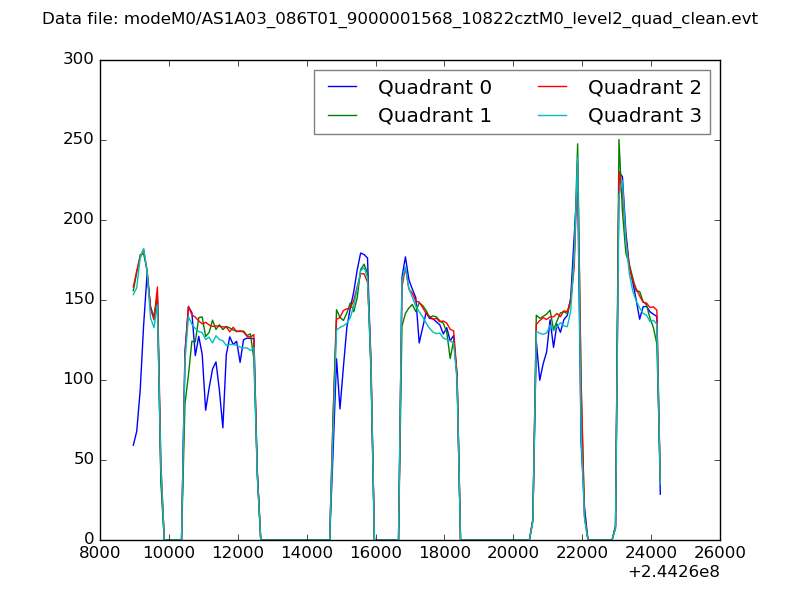 |
|
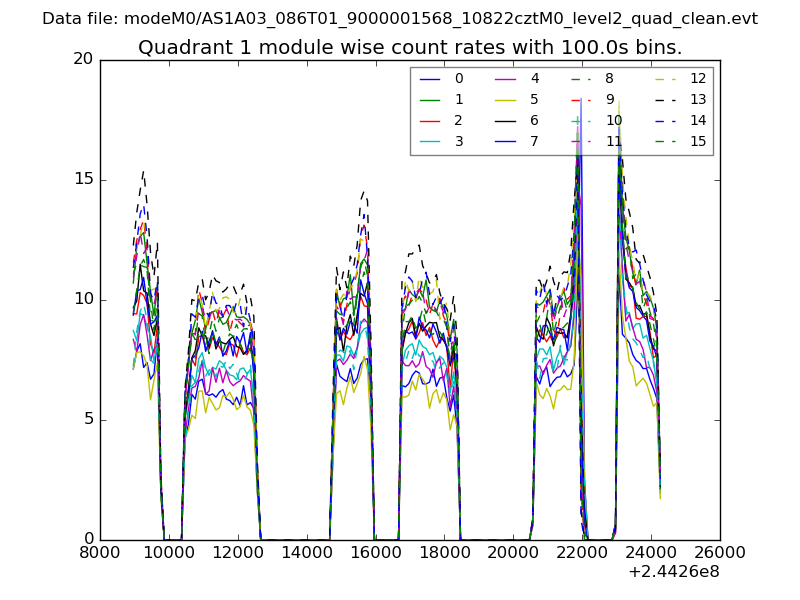
| Module-wise count rates for Quadrant A Data is divided into 100 sec bins |
 |
 |
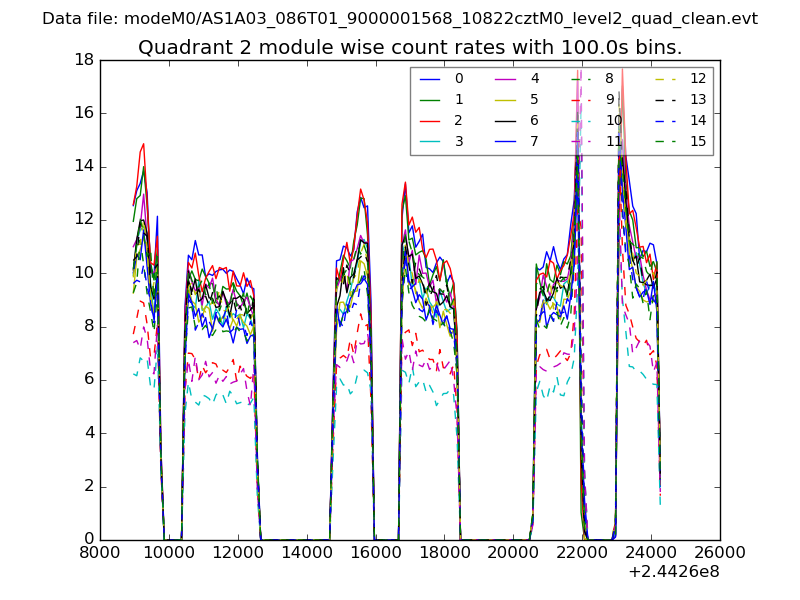
| Module-wise count rates for Quadrant B Data is divided into 100 sec bins |
 |
 |
| Module-wise count rates for Quadrant C Data is divided into 100 sec bins |
 |
 |
| Module-wise count rates for Quadrant D Data is divided into 100 sec bins |
 |
 |
| Parameter | Plot |
|---|---|
| CZT HV Monitor | 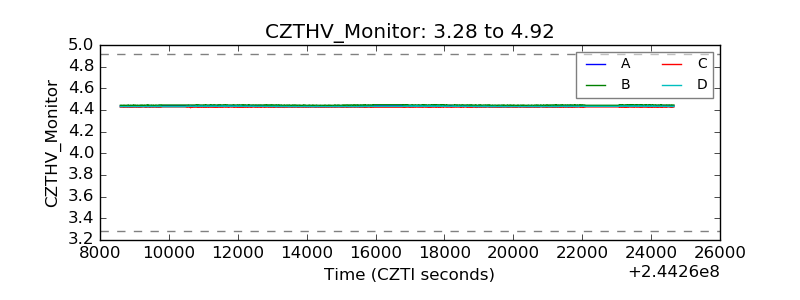 |
| D_VDD |  |
| Temperature 1 | 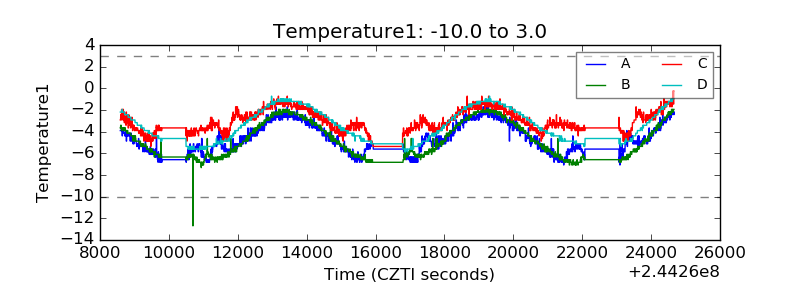 |
| Veto HV Monitor | 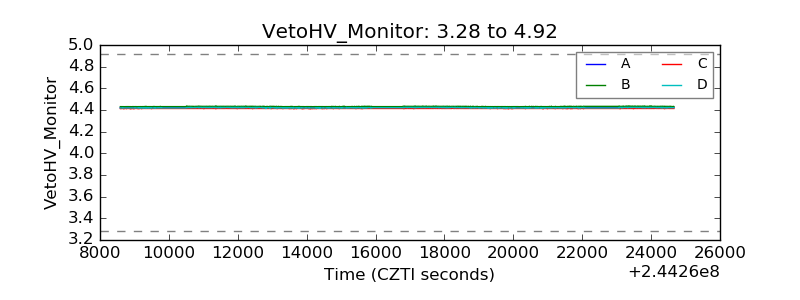 |
| Veto LLD |  |
| Alpha Counter | 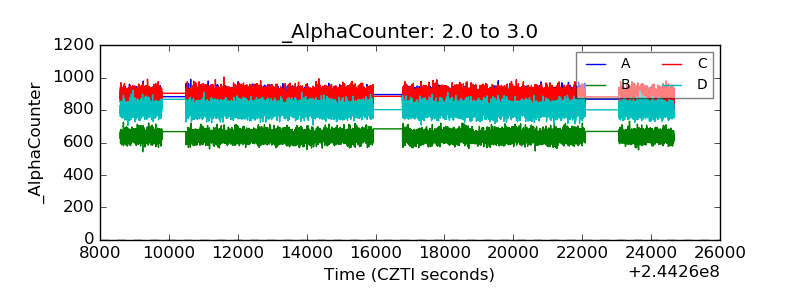 |
| _CPM_Rate | 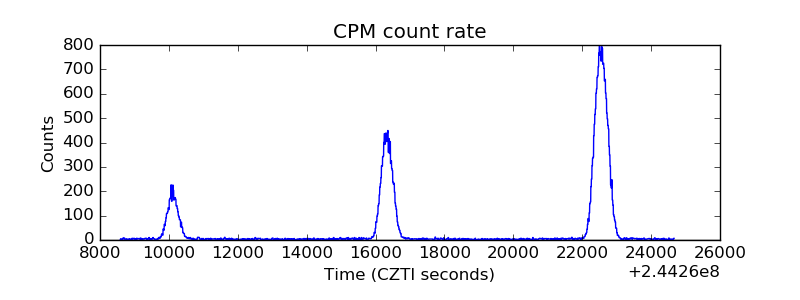 |
| CZT Counter | 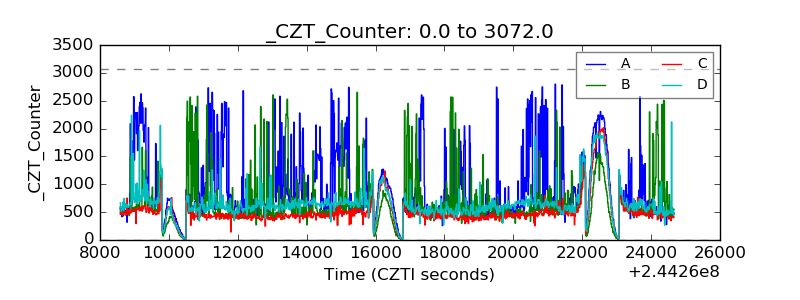 |
| +2.5 Volts monitor |  |
| +5 Volts monitor |  |
| _ROLL_ROT |  |
| _Roll_DEC | 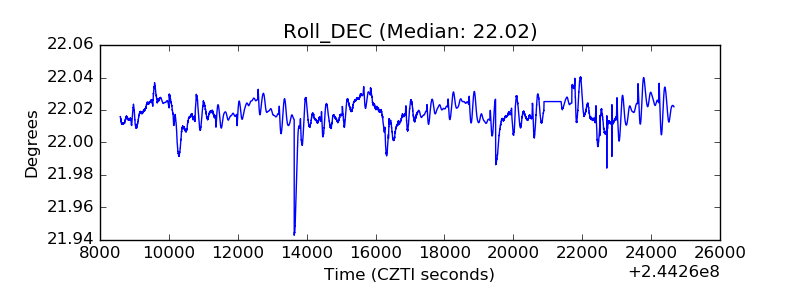 |
| _Roll_RA | 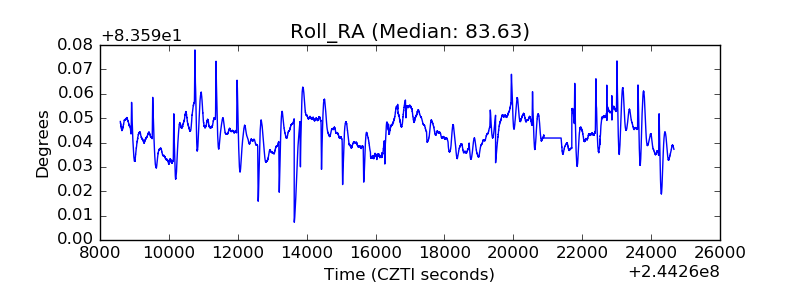 |
| Veto Counter | 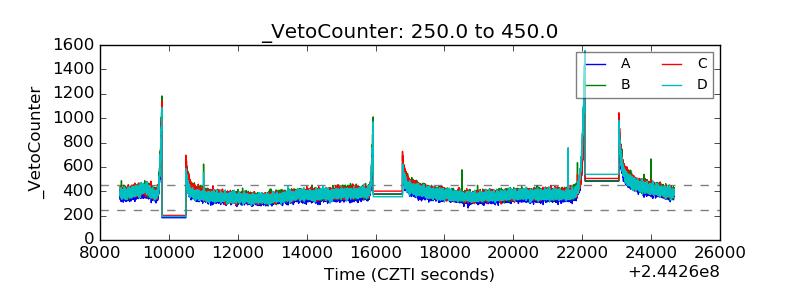 |