| Param | Original file | Final file |
|---|---|---|
| Filename | modeM0/AS1A03_086T01_9000001568_10824cztM0_level2.evt | modeM0/AS1A03_086T01_9000001568_10824cztM0_level2_quad_clean.evt |
| Size (bytes) | 502,626,240 | 76,515,840 |
| Size | 479.3 MB | 73.0 MB |
| Events in quadrant A | 4,099,279 | 477,995 |
| Events in quadrant B | 4,320,659 | 477,299 |
| Events in quadrant C | 2,767,162 | 489,494 |
| Events in quadrant D | 3,639,266 | 464,057 |
| Mode M9 | |||
|---|---|---|---|
| Quadrant | BADHDUFLAG | Total packets | Discarded packets |
| A | 0 | 11 | 0 |
| B | 0 | 11 | 0 |
| C | 0 | 11 | 0 |
| D | 0 | 11 | 0 |
| Mode SS | |||
|---|---|---|---|
| Quadrant | BADHDUFLAG | Total packets | Discarded packets |
| A | 0 | 118 | 0 |
| B | 0 | 118 | 0 |
| C | 0 | 118 | 0 |
| D | 0 | 118 | 0 |
| Mode M0 | |||
|---|---|---|---|
| Quadrant | BADHDUFLAG | Total packets | Discarded packets |
| A | 0 | 15929 | 2 |
| B | 0 | 16624 | 1 |
| C | 0 | 12005 | 3 |
| D | 0 | 14533 | 1 |
| Quadrant | Total seconds | Saturated seconds | Saturation percentage |
|---|---|---|---|
| A | 5838 | 301 | 5.155875% |
| B | 5838 | 421 | 7.211374% |
| C | 5837 | 36 | 0.616755% |
| D | 5838 | 97 | 1.661528% |
Noise dominated data is calculated using 1-second bins in cleaned event files. If a bin has >2000 counts, and if more than 50% of those come from <1% of pixels, then it is considered to be noise-dominated and hence unusable.
| Quadrant | # 1 sec bins | Bins with >0 counts | Bins with >2000 counts | High rate bins dominated by noise | Noise dominated (total time) | Noise dominated (detector-on time) | Marked lightcurve |
|---|---|---|---|---|---|---|---|
| A | 6948 | 5839 | 153 | 153 | 2.20% | 2.62% | 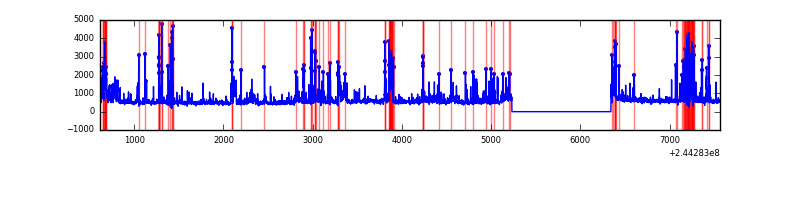 |
| B | 6948 | 5839 | 229 | 229 | 3.30% | 3.92% |  |
| C | 6948 | 5839 | 0 | 0 | 0.00% | 0.00% | 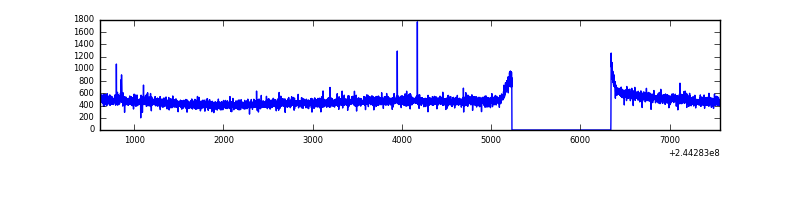 |
| D | 6948 | 5839 | 37 | 37 | 0.53% | 0.63% | 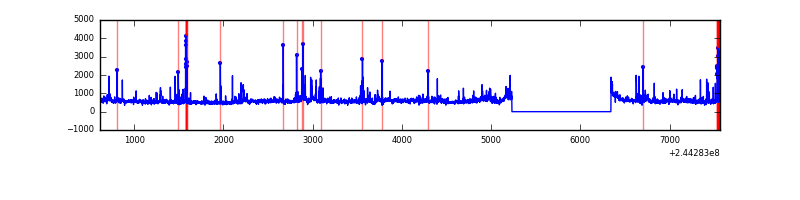 |
Top three noisy pixels from each quadrant. If the there are fewer than three noisy pixels in the level2.evt file, extra rows are filled as -1
| Pixel properties | Quadrant properties | ||||||
|---|---|---|---|---|---|---|---|
| Quadrant | DetID | PixID | Counts | Sigma | Mean | Median | Sigma |
| A | 8 | 5 | 1119901 | 7504.03 | 725 | 713 | 149.1 |
| A | 15 | 174 | 102755 | 684.18 | 725 | 713 | 149.1 |
| A | 13 | 251 | 79981 | 531.48 | 725 | 713 | 149.1 |
| B | 4 | 239 | 1316509 | 9584.07 | 714 | 699 | 137.3 |
| B | 10 | 245 | 97184 | 702.78 | 714 | 699 | 137.3 |
| B | 0 | 214 | 43776 | 313.76 | 714 | 699 | 137.3 |
| C | 13 | 61 | 5229 | 27.4 | 708 | 714 | 164.8 |
| C | 3 | 254 | 3838 | 18.96 | 708 | 714 | 164.8 |
| C | 14 | 234 | 3369 | 16.12 | 708 | 714 | 164.8 |
| D | 8 | 195 | 409687 | 2384.73 | 709 | 693 | 171.5 |
| D | 1 | 52 | 288609 | 1678.75 | 709 | 693 | 171.5 |
| D | 2 | 14 | 68398 | 394.77 | 709 | 693 | 171.5 |
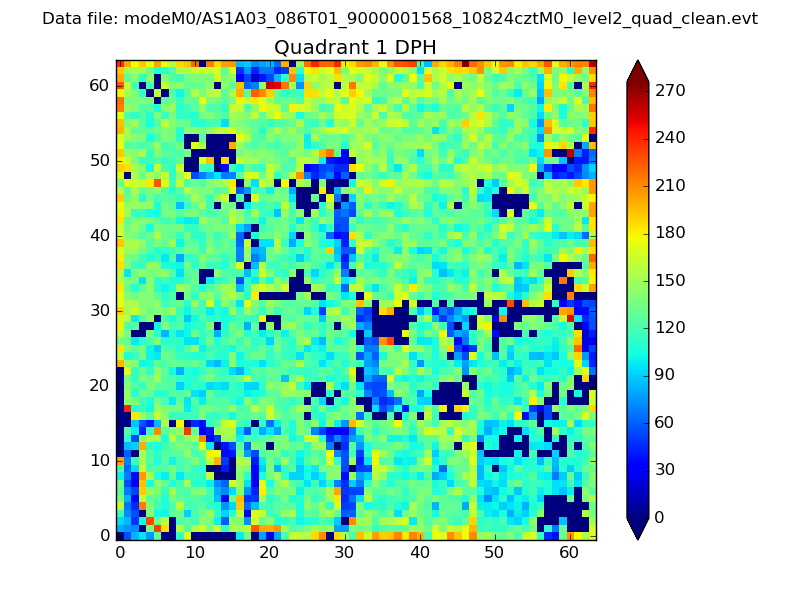
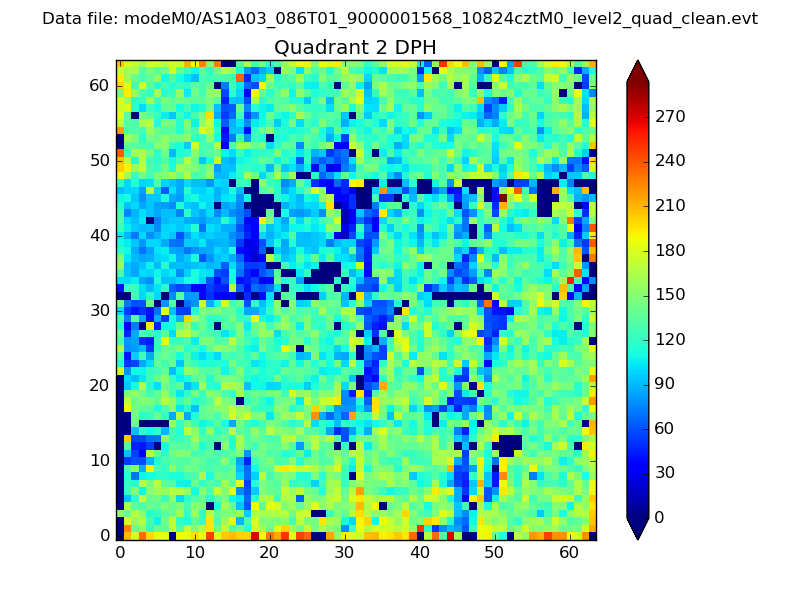
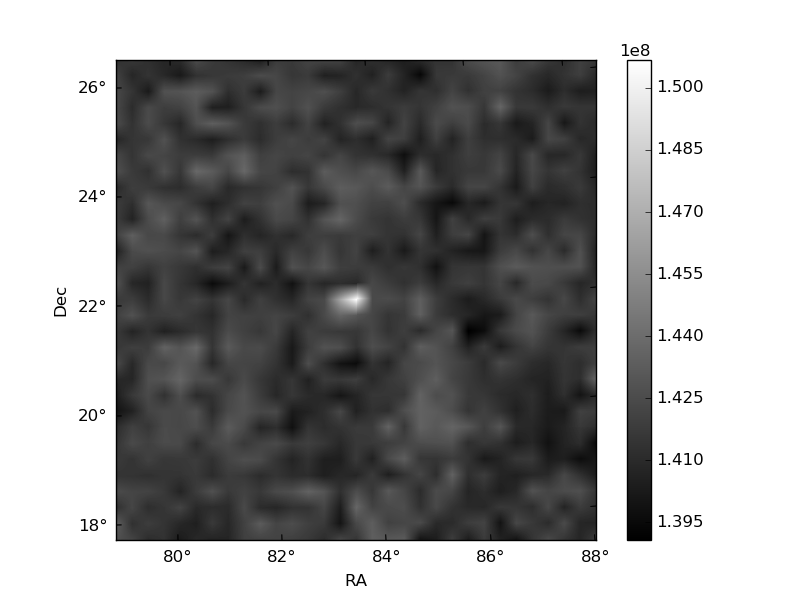
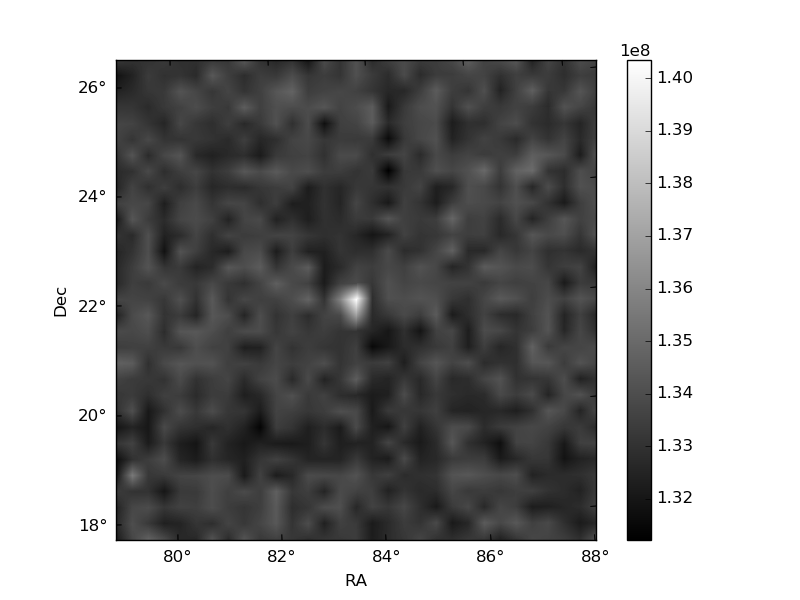
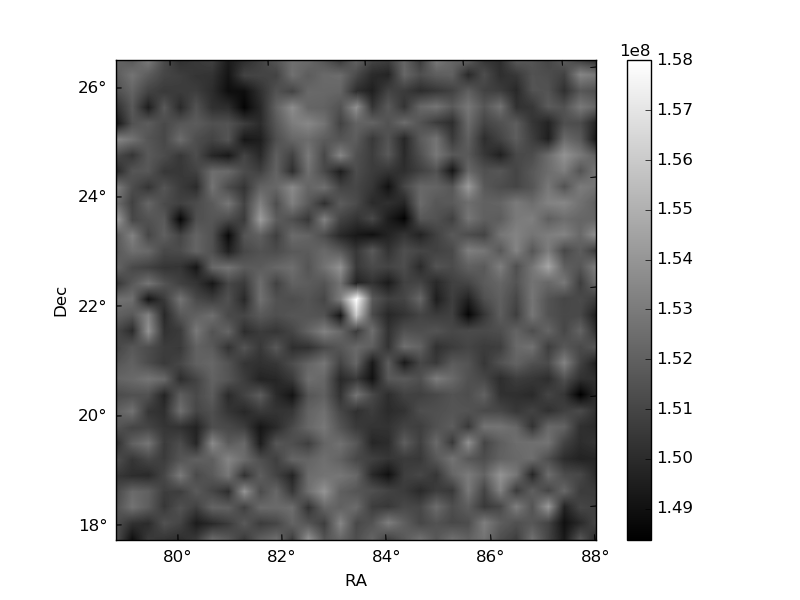
Histogram calculated using DETX and DETY for each event in the final _common_clean file
| Quadrant A | 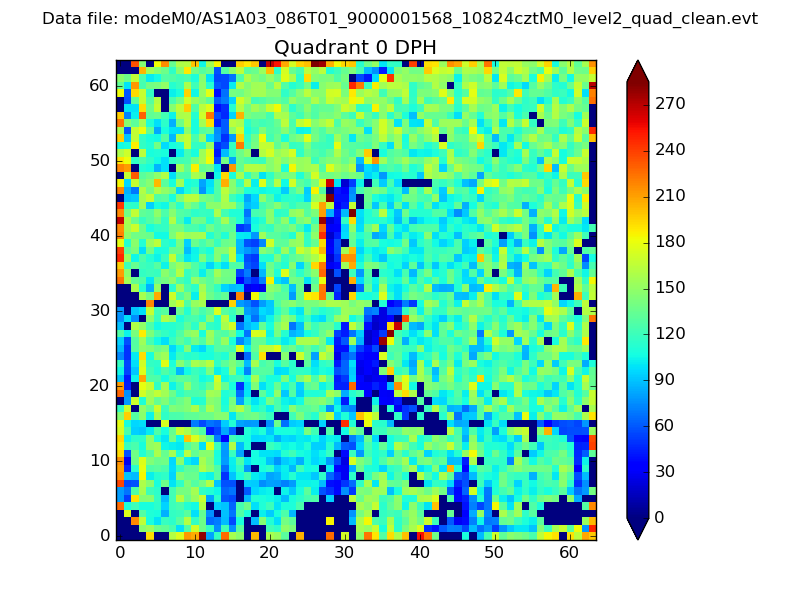 |
 |
Quadrant B |
|---|---|---|---|
| Quadrant D | 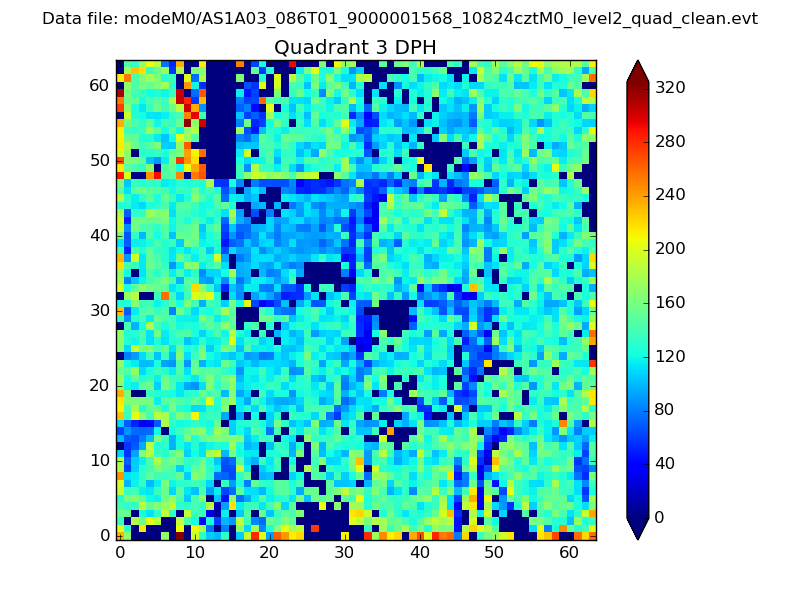 |
 |
Quadrant C |
| Plot type | Count rate plots | Images |
|---|---|---|
| Comparison with Poisson distribution Blue bars denote a histogram of data divided into 1 sec bins. Red curve is a Poisson curve with rate = median count rate of data. |
 |
 |
| Quadrant-wise count rates Data is divided into 100 sec bins |
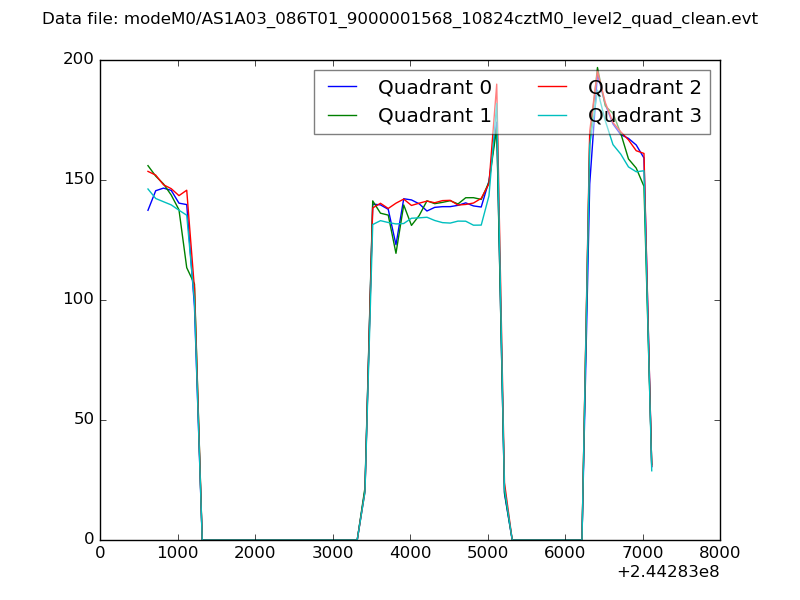 |
|
| Module-wise count rates for Quadrant A Data is divided into 100 sec bins |
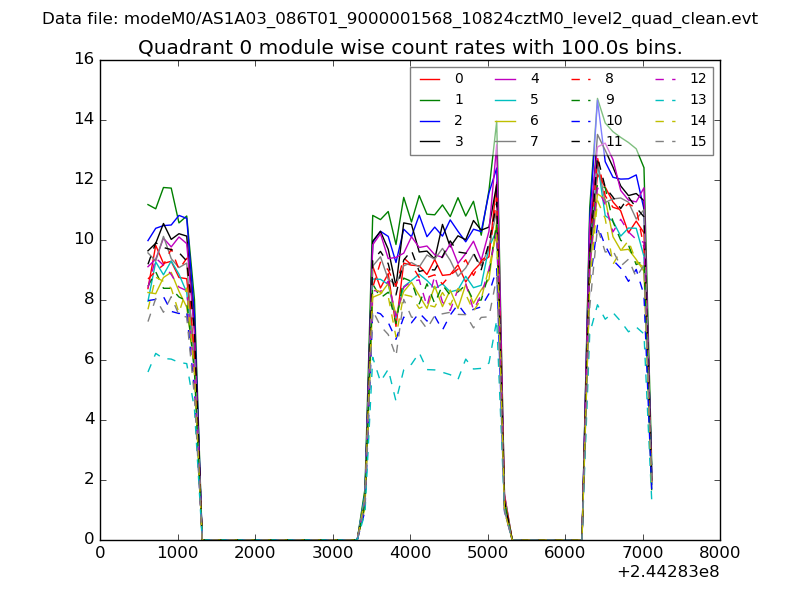 |
 |
| Module-wise count rates for Quadrant B Data is divided into 100 sec bins |
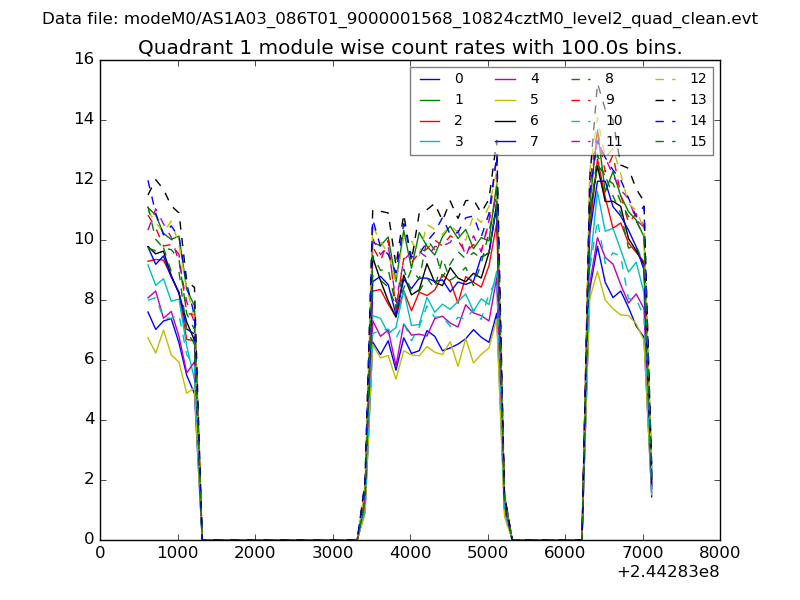 |
 |
| Module-wise count rates for Quadrant C Data is divided into 100 sec bins |
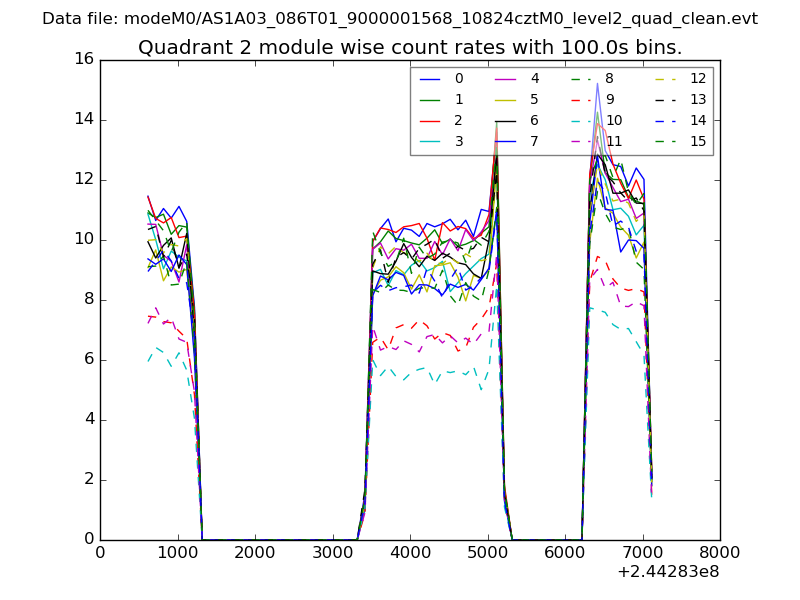 |
 |
| Module-wise count rates for Quadrant D Data is divided into 100 sec bins |
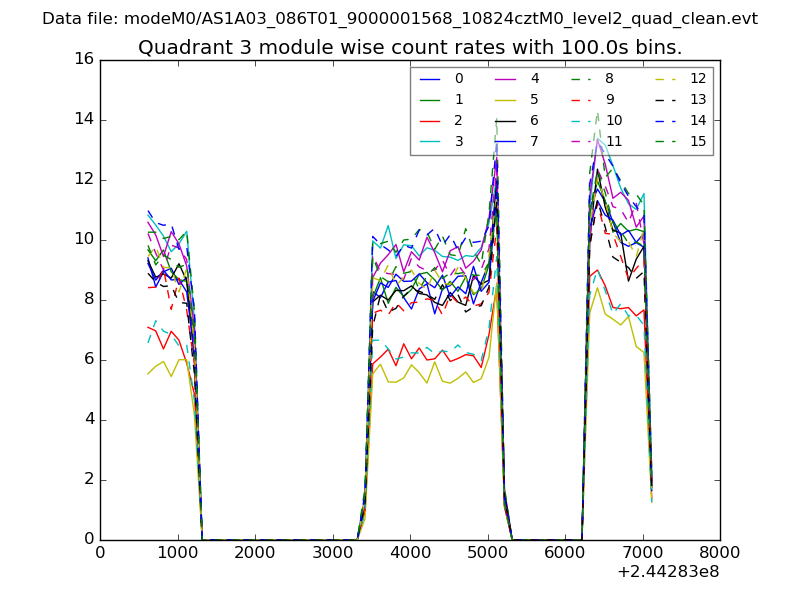 |
 |
| Parameter | Plot |
|---|---|
| CZT HV Monitor | 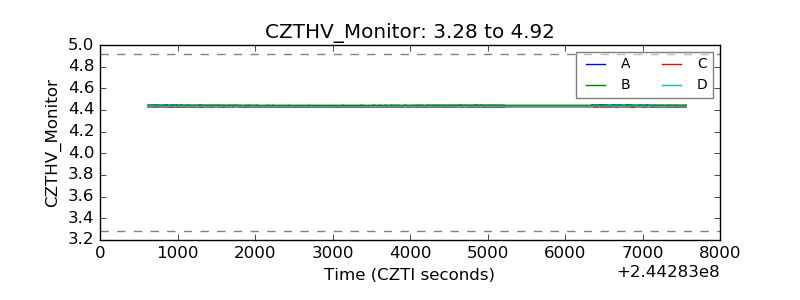 |
| D_VDD | 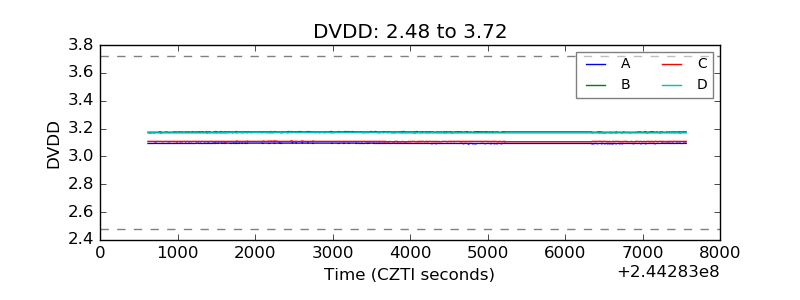 |
| Temperature 1 | 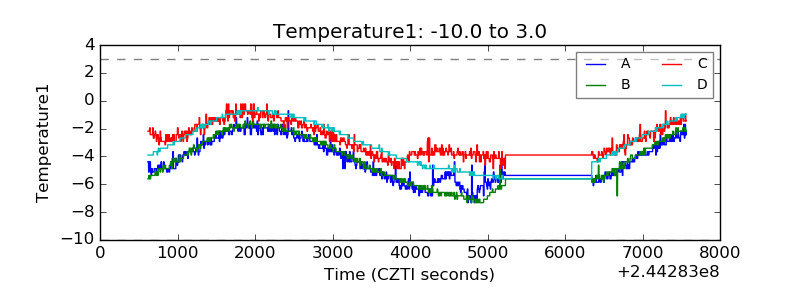 |
| Veto HV Monitor | 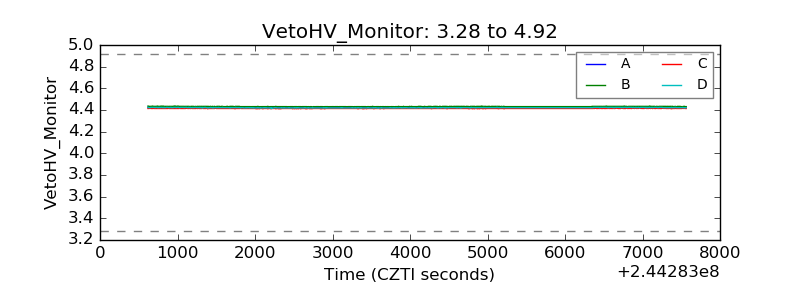 |
| Veto LLD | 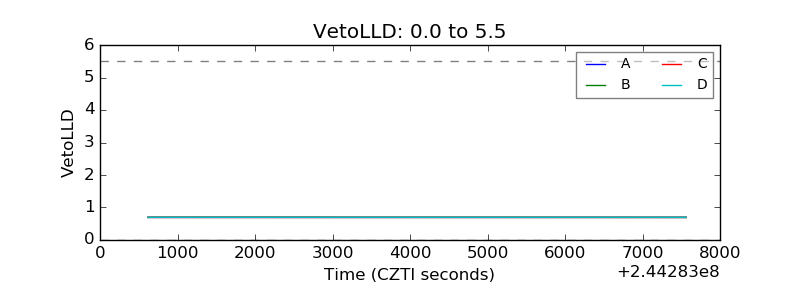 |
| Alpha Counter | 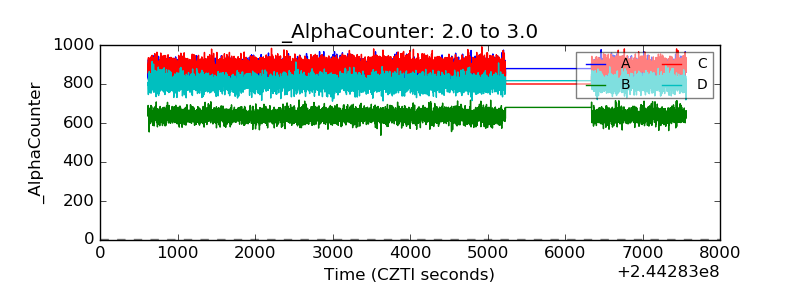 |
| _CPM_Rate | 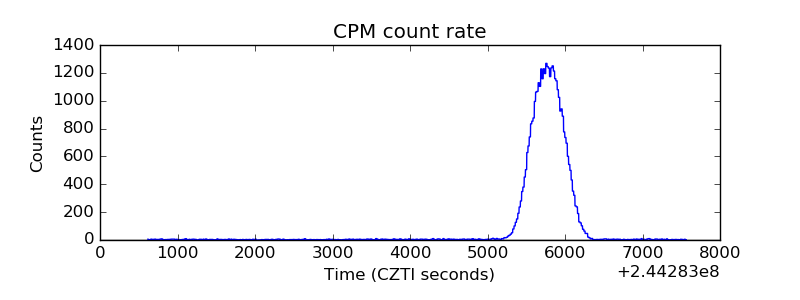 |
| CZT Counter | 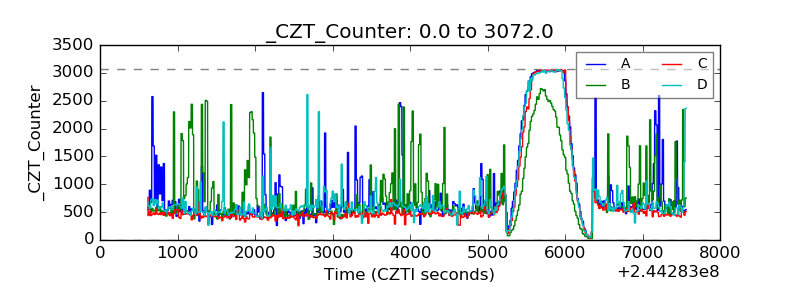 |
| +2.5 Volts monitor |  |
| +5 Volts monitor |  |
| _ROLL_ROT | 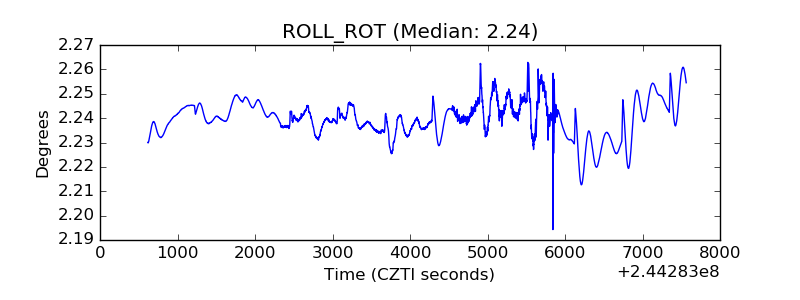 |
| _Roll_DEC | 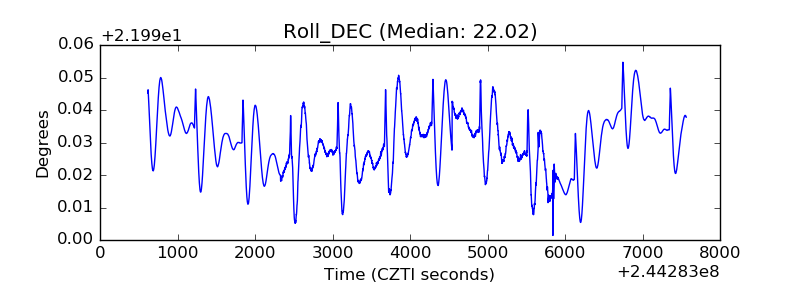 |
| _Roll_RA | 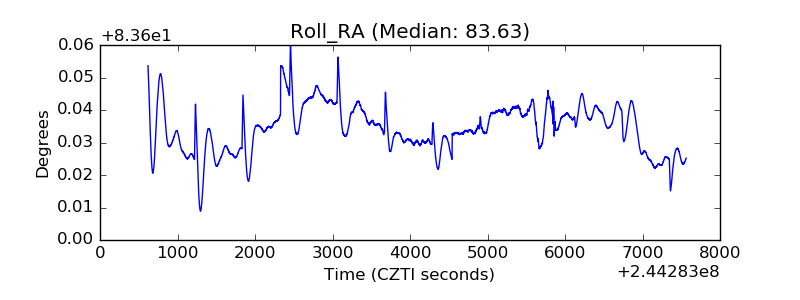 |
| Veto Counter | 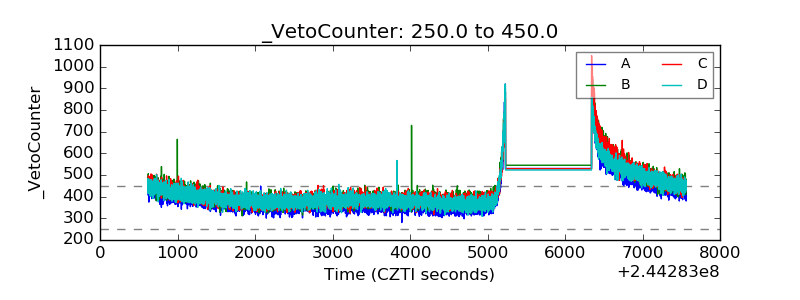 |