| Param | Original file | Final file |
|---|---|---|
| Filename | modeM0/AS1A03_086T01_9000001568_10825cztM0_level2.evt | modeM0/AS1A03_086T01_9000001568_10825cztM0_level2_quad_clean.evt |
| Size (bytes) | 621,207,360 | 81,659,520 |
| Size | 592.4 MB | 77.9 MB |
| Events in quadrant A | 5,489,589 | 499,164 |
| Events in quadrant B | 5,465,141 | 501,980 |
| Events in quadrant C | 3,317,350 | 514,831 |
| Events in quadrant D | 4,089,684 | 491,381 |
| Mode M9 | |||
|---|---|---|---|
| Quadrant | BADHDUFLAG | Total packets | Discarded packets |
| A | 0 | 13 | 0 |
| B | 0 | 13 | 0 |
| C | 0 | 13 | 0 |
| D | 0 | 13 | 0 |
| Mode SS | |||
|---|---|---|---|
| Quadrant | BADHDUFLAG | Total packets | Discarded packets |
| A | 0 | 136 | 0 |
| B | 0 | 136 | 0 |
| C | 0 | 136 | 0 |
| D | 0 | 136 | 0 |
| Mode M0 | |||
|---|---|---|---|
| Quadrant | BADHDUFLAG | Total packets | Discarded packets |
| A | 0 | 20992 | 3 |
| B | 0 | 20663 | 2 |
| C | 0 | 13978 | 2 |
| D | 0 | 16385 | 2 |
| Quadrant | Total seconds | Saturated seconds | Saturation percentage |
|---|---|---|---|
| A | 6678 | 385 | 5.765199% |
| B | 6678 | 688 | 10.302486% |
| C | 6678 | 54 | 0.808625% |
| D | 6679 | 136 | 2.036233% |
Noise dominated data is calculated using 1-second bins in cleaned event files. If a bin has >2000 counts, and if more than 50% of those come from <1% of pixels, then it is considered to be noise-dominated and hence unusable.
| Quadrant | # 1 sec bins | Bins with >0 counts | Bins with >2000 counts | High rate bins dominated by noise | Noise dominated (total time) | Noise dominated (detector-on time) | Marked lightcurve |
|---|---|---|---|---|---|---|---|
| A | 7898 | 6679 | 222 | 222 | 2.81% | 3.32% | 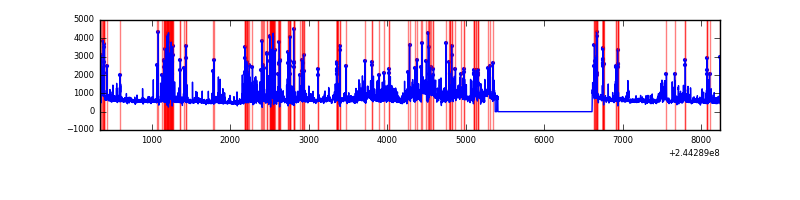 |
| B | 7898 | 6679 | 415 | 415 | 5.25% | 6.21% | 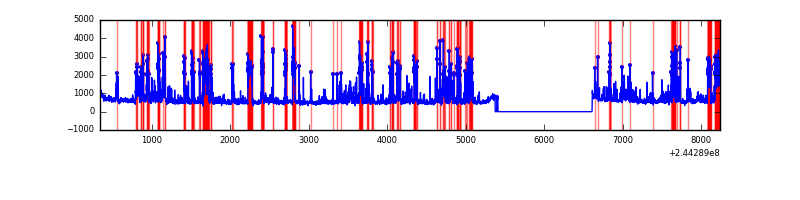 |
| C | 7898 | 6680 | 0 | 0 | 0.00% | 0.00% | 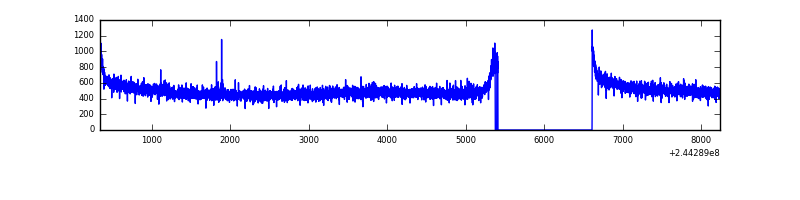 |
| D | 7899 | 6680 | 57 | 57 | 0.72% | 0.85% | 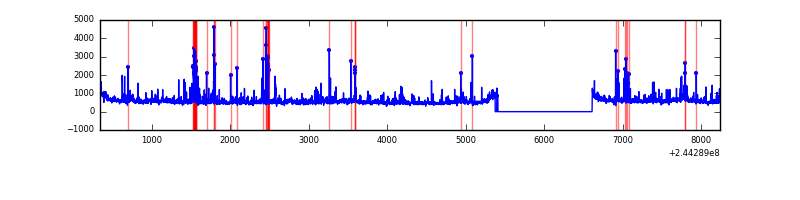 |
Top three noisy pixels from each quadrant. If the there are fewer than three noisy pixels in the level2.evt file, extra rows are filled as -1
| Pixel properties | Quadrant properties | ||||||
|---|---|---|---|---|---|---|---|
| Quadrant | DetID | PixID | Counts | Sigma | Mean | Median | Sigma |
| A | 8 | 5 | 1984730 | 11345.47 | 865 | 849 | 174.9 |
| A | 13 | 251 | 139156 | 790.95 | 865 | 849 | 174.9 |
| A | 15 | 174 | 29325 | 162.85 | 865 | 849 | 174.9 |
| B | 4 | 239 | 1812718 | 11337.09 | 845 | 830 | 159.8 |
| B | 10 | 245 | 200023 | 1246.36 | 845 | 830 | 159.8 |
| B | 0 | 214 | 44136 | 270.97 | 845 | 830 | 159.8 |
| C | 13 | 61 | 6288 | 27.75 | 850 | 858 | 195.7 |
| C | 14 | 234 | 3669 | 14.36 | 850 | 858 | 195.7 |
| C | 3 | 202 | 2216 | 6.94 | 850 | 858 | 195.7 |
| D | 8 | 195 | 307906 | 1499.38 | 851 | 832 | 204.8 |
| D | 1 | 52 | 231329 | 1125.47 | 851 | 832 | 204.8 |
| D | 5 | 222 | 75835 | 366.22 | 851 | 832 | 204.8 |
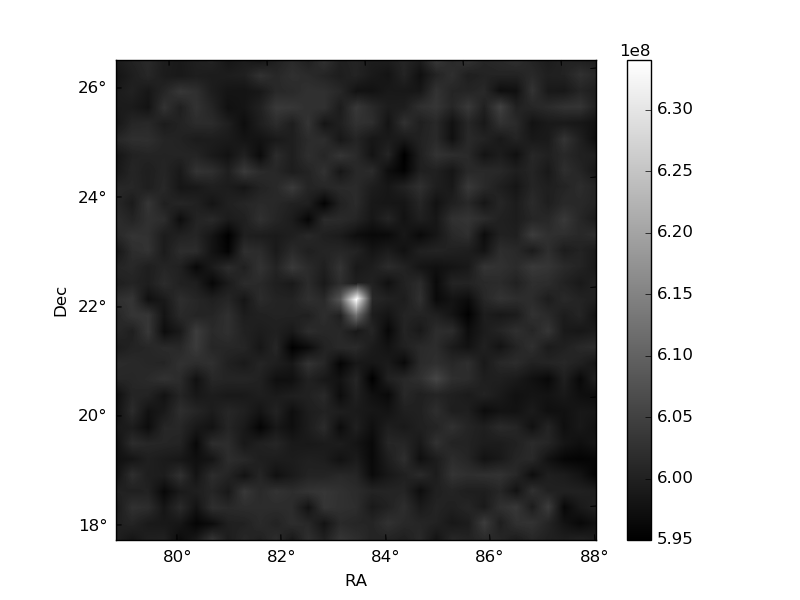
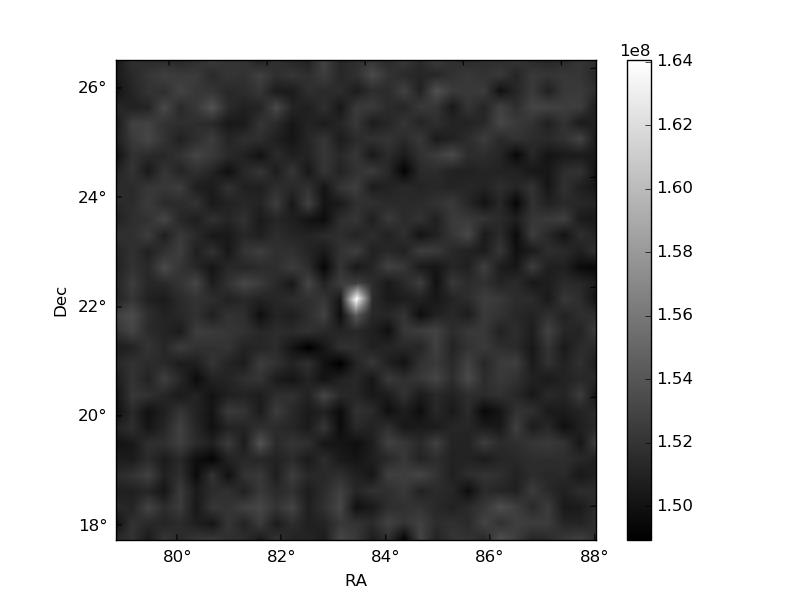
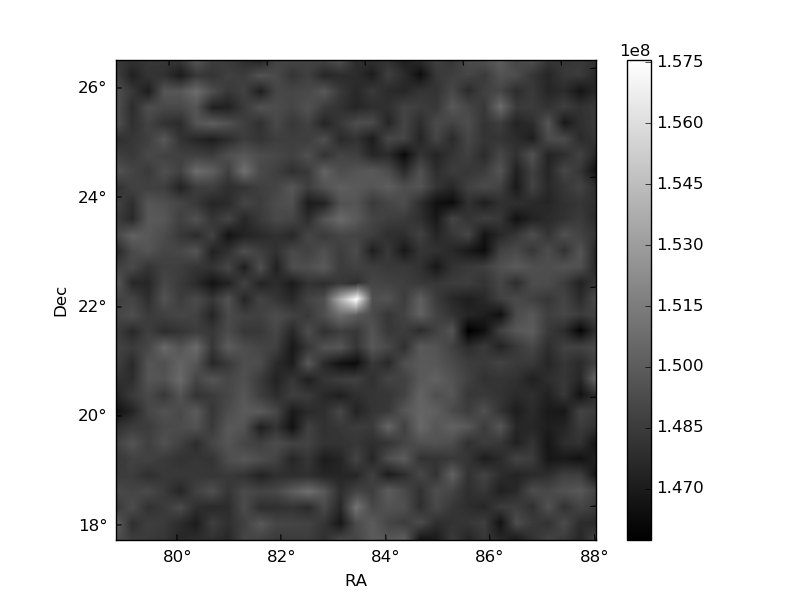
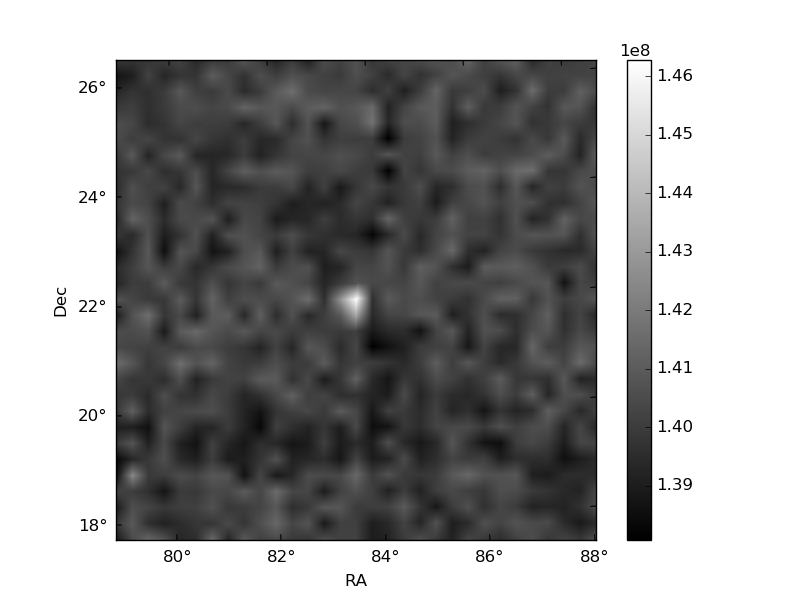
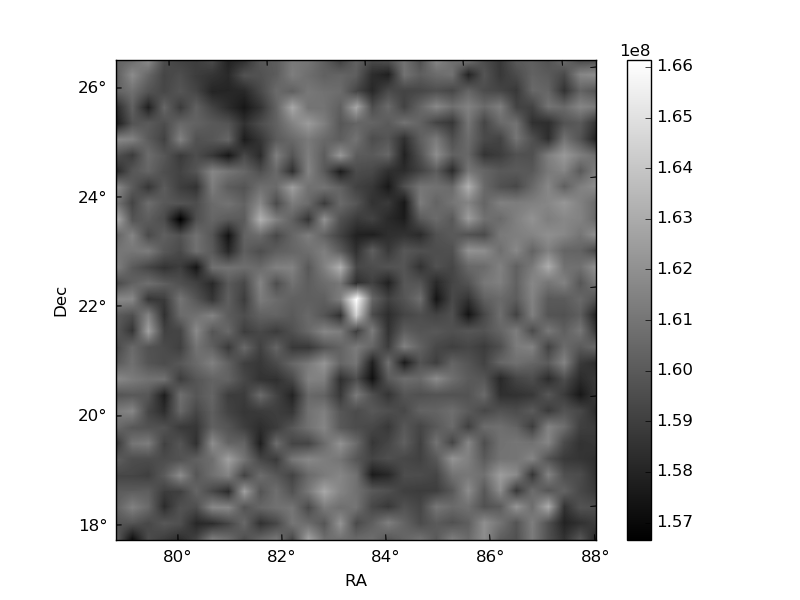
Histogram calculated using DETX and DETY for each event in the final _common_clean file
| Quadrant A | 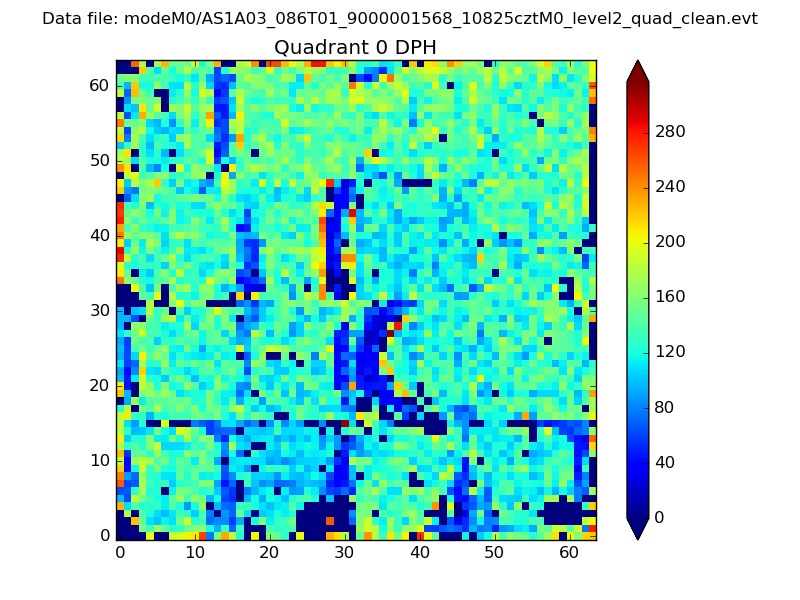 |
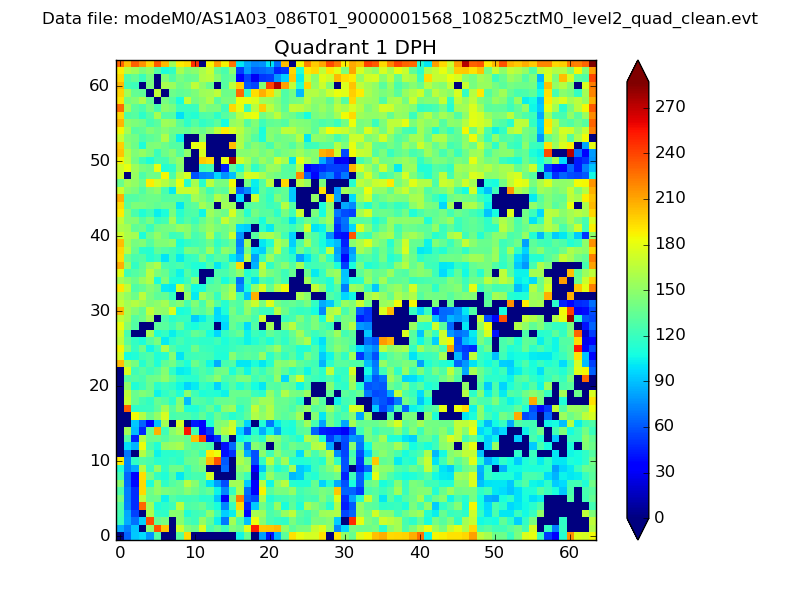 |
Quadrant B |
|---|---|---|---|
| Quadrant D | 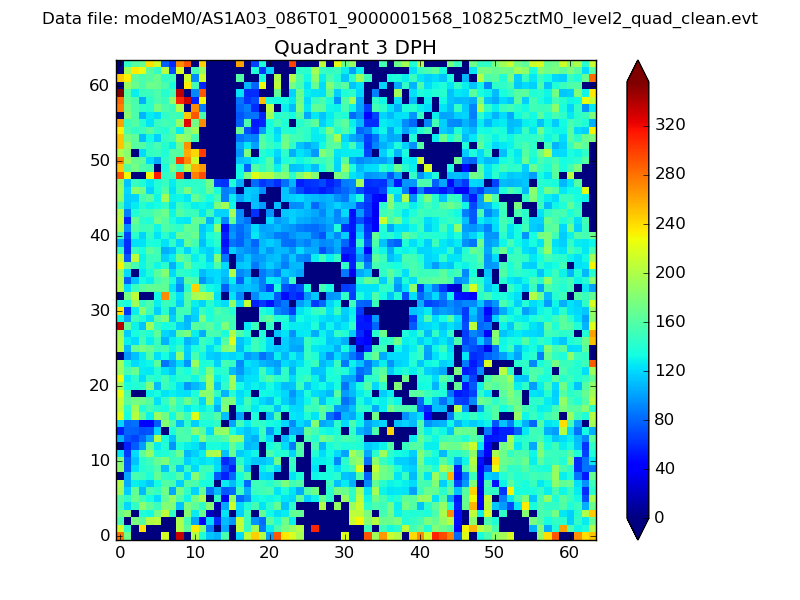 |
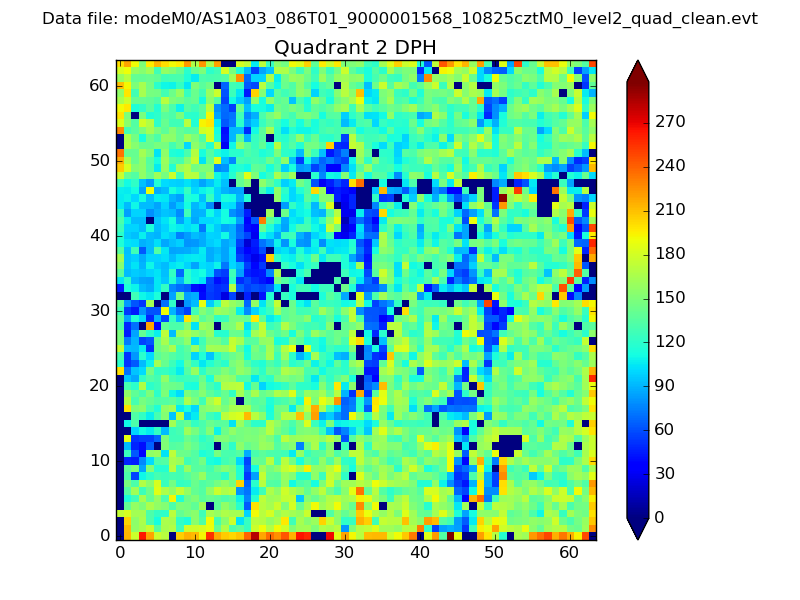 |
Quadrant C |
| Plot type | Count rate plots | Images |
|---|---|---|
| Comparison with Poisson distribution Blue bars denote a histogram of data divided into 1 sec bins. Red curve is a Poisson curve with rate = median count rate of data. |
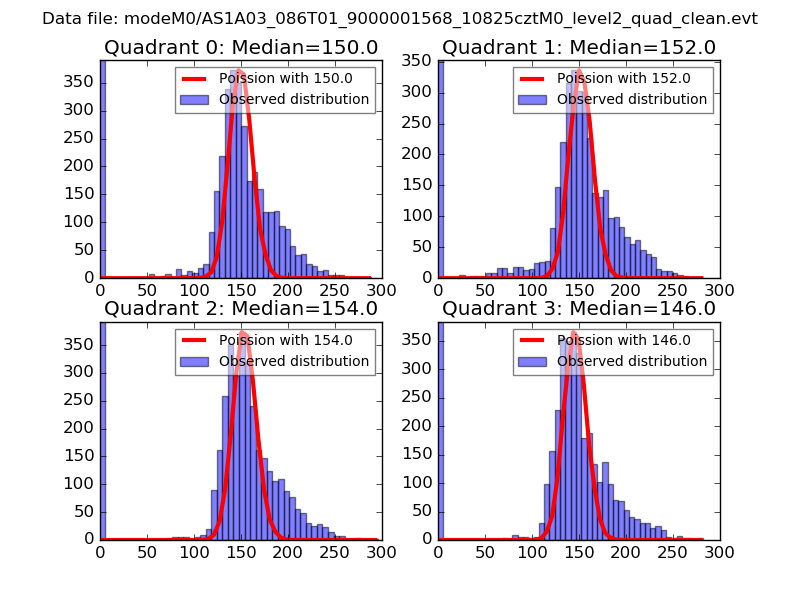 |
 |
| Quadrant-wise count rates Data is divided into 100 sec bins |
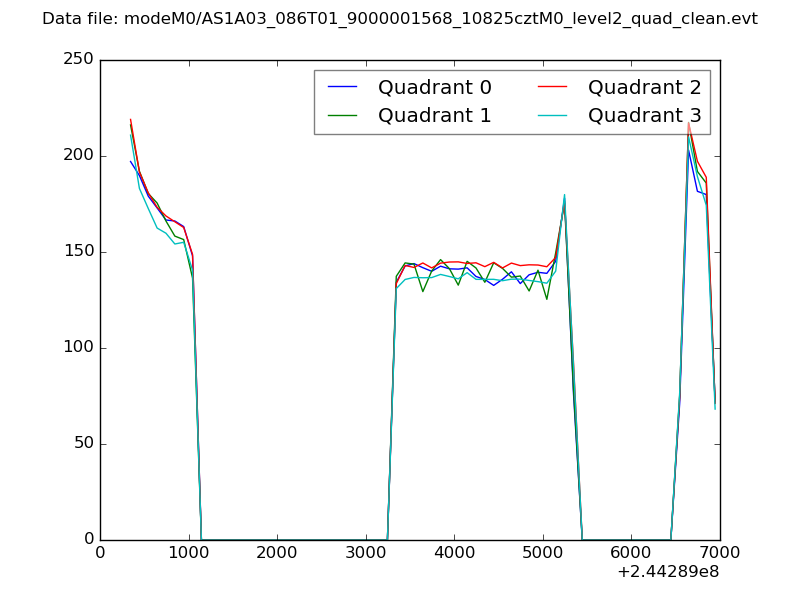 |
|
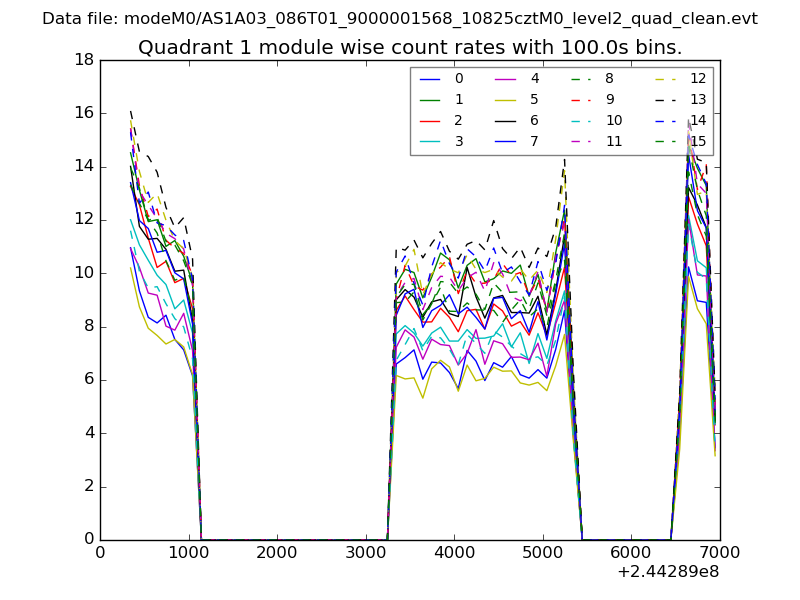
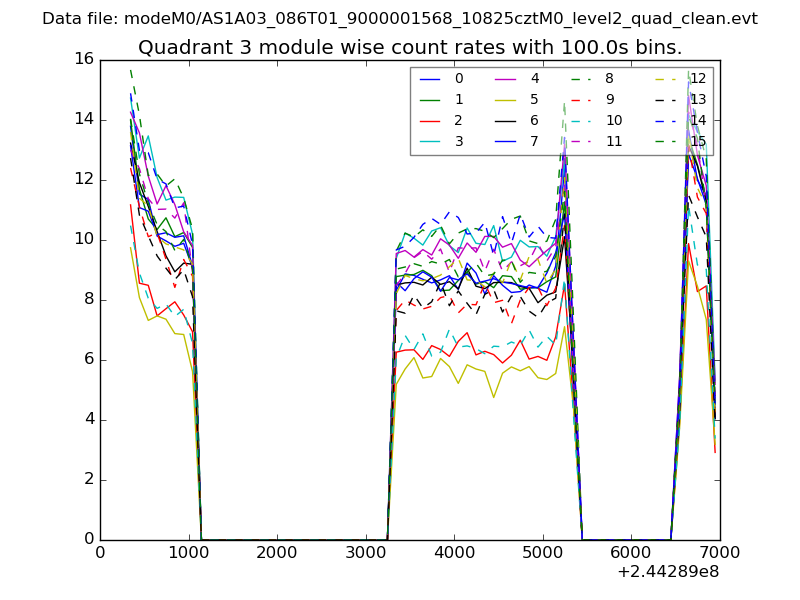
| Module-wise count rates for Quadrant A Data is divided into 100 sec bins |
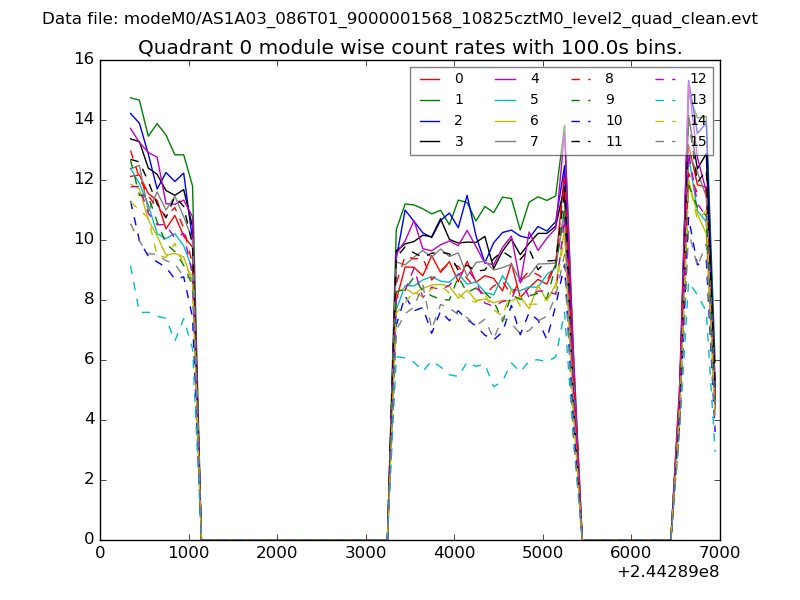 |
 |
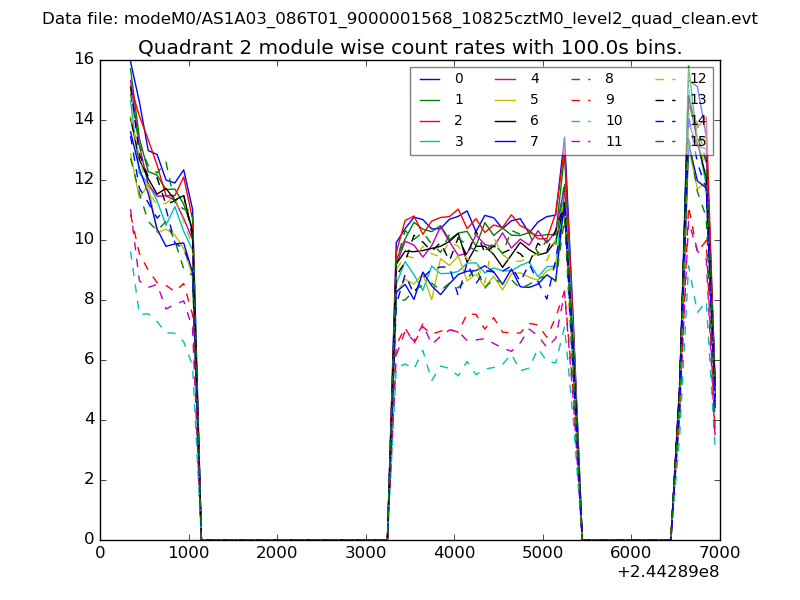
| Module-wise count rates for Quadrant B Data is divided into 100 sec bins |
 |
 |
| Module-wise count rates for Quadrant C Data is divided into 100 sec bins |
 |
 |
| Module-wise count rates for Quadrant D Data is divided into 100 sec bins |
 |
 |
| Parameter | Plot |
|---|---|
| CZT HV Monitor | 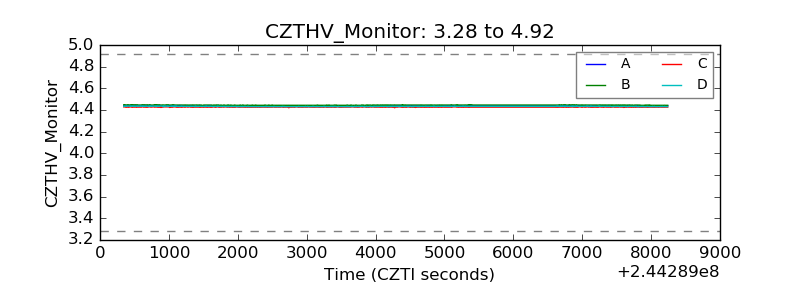 |
| D_VDD | 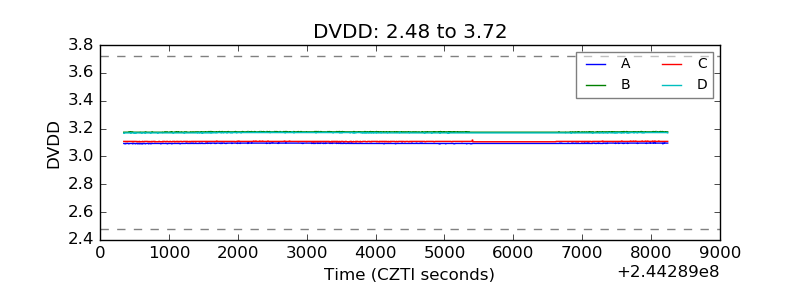 |
| Temperature 1 | 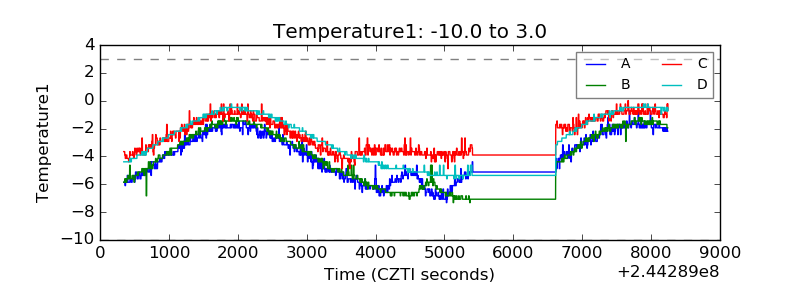 |
| Veto HV Monitor | 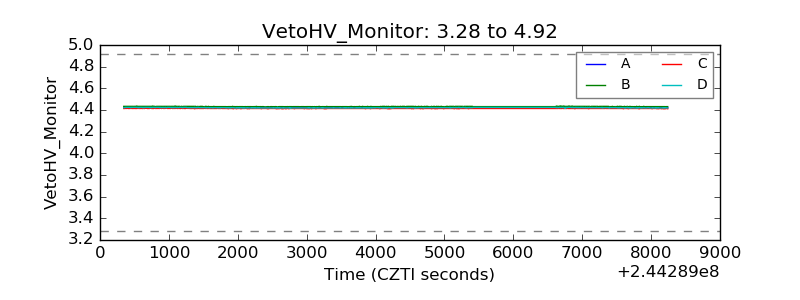 |
| Veto LLD |  |
| Alpha Counter | 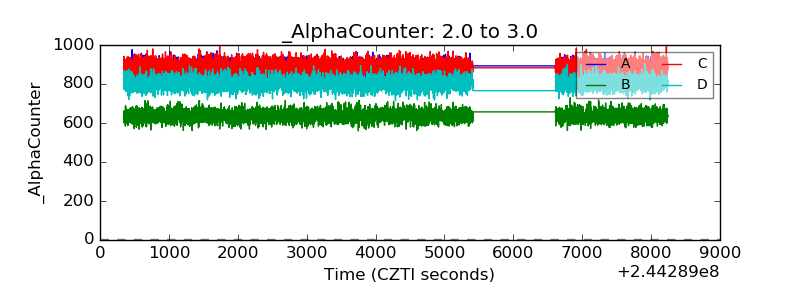 |
| _CPM_Rate | 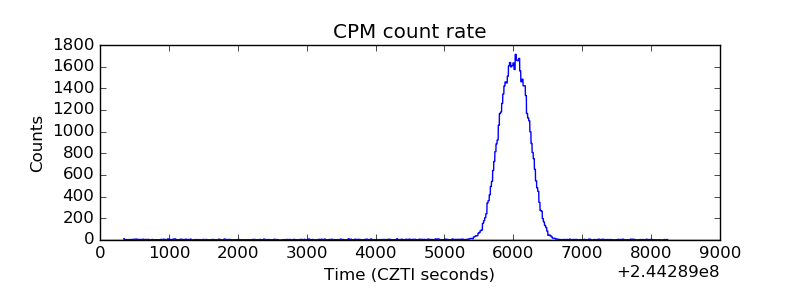 |
| CZT Counter | 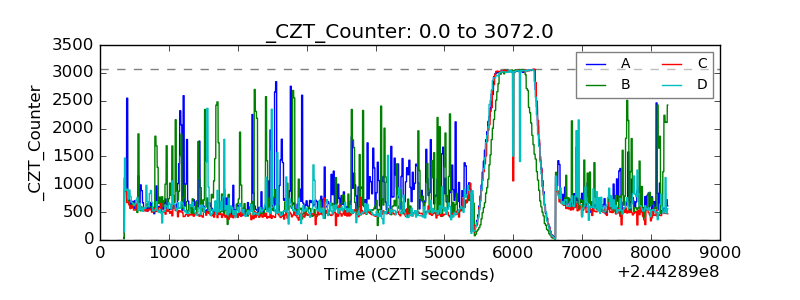 |
| +2.5 Volts monitor |  |
| +5 Volts monitor |  |
| _ROLL_ROT | 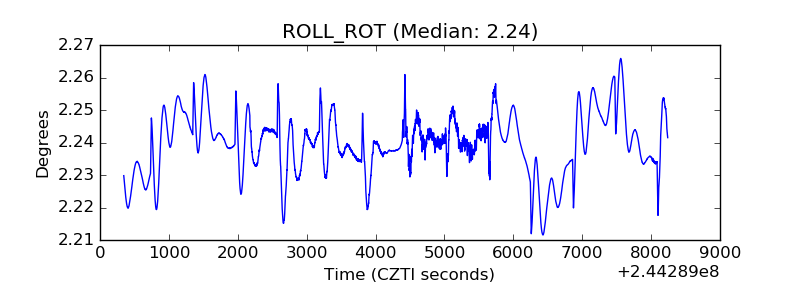 |
| _Roll_DEC |  |
| _Roll_RA | 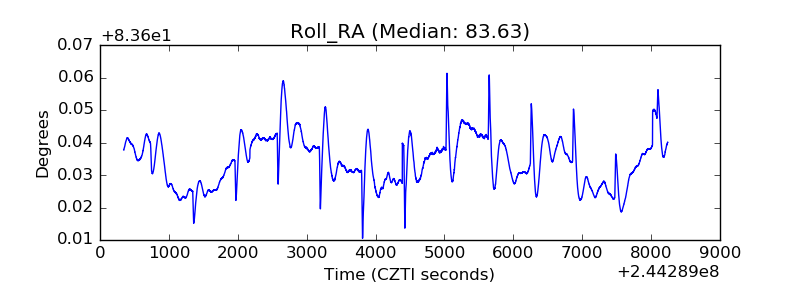 |
| Veto Counter | 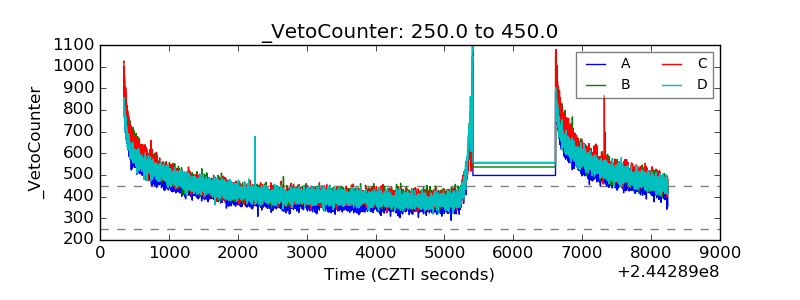 |