| Param | Original file | Final file |
|---|---|---|
| Filename | modeM0/AS1A03_086T01_9000001568_10827cztM0_level2.evt | modeM0/AS1A03_086T01_9000001568_10827cztM0_level2_quad_clean.evt |
| Size (bytes) | 647,493,120 | 70,041,600 |
| Size | 617.5 MB | 66.8 MB |
| Events in quadrant A | 5,528,125 | 418,299 |
| Events in quadrant B | 5,039,777 | 417,123 |
| Events in quadrant C | 3,302,176 | 429,174 |
| Events in quadrant D | 5,301,993 | 404,467 |
| Mode M9 | |||
|---|---|---|---|
| Quadrant | BADHDUFLAG | Total packets | Discarded packets |
| A | 0 | 17 | 0 |
| B | 0 | 17 | 0 |
| C | 0 | 17 | 0 |
| D | 0 | 18 | 0 |
| Mode SS | |||
|---|---|---|---|
| Quadrant | BADHDUFLAG | Total packets | Discarded packets |
| A | 0 | 130 | 0 |
| B | 0 | 130 | 0 |
| C | 0 | 130 | 0 |
| D | 0 | 130 | 0 |
| Mode M0 | |||
|---|---|---|---|
| Quadrant | BADHDUFLAG | Total packets | Discarded packets |
| A | 0 | 21026 | 3 |
| B | 0 | 19291 | 2 |
| C | 0 | 13649 | 2 |
| D | 0 | 20496 | 2 |
| Quadrant | Total seconds | Saturated seconds | Saturation percentage |
|---|---|---|---|
| A | 6475 | 521 | 8.046332% |
| B | 6475 | 532 | 8.216216% |
| C | 6475 | 91 | 1.405405% |
| D | 6475 | 263 | 4.061776% |
Noise dominated data is calculated using 1-second bins in cleaned event files. If a bin has >2000 counts, and if more than 50% of those come from <1% of pixels, then it is considered to be noise-dominated and hence unusable.
| Quadrant | # 1 sec bins | Bins with >0 counts | Bins with >2000 counts | High rate bins dominated by noise | Noise dominated (total time) | Noise dominated (detector-on time) | Marked lightcurve |
|---|---|---|---|---|---|---|---|
| A | 7710 | 6475 | 302 | 302 | 3.92% | 4.66% | 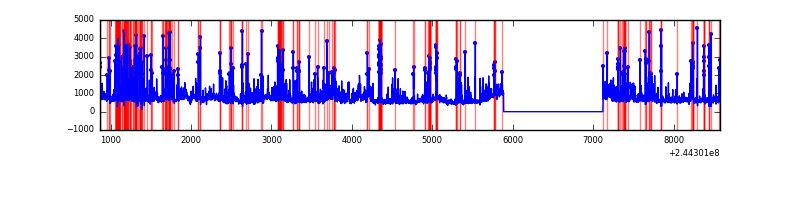 |
| B | 7710 | 6476 | 269 | 269 | 3.49% | 4.15% | 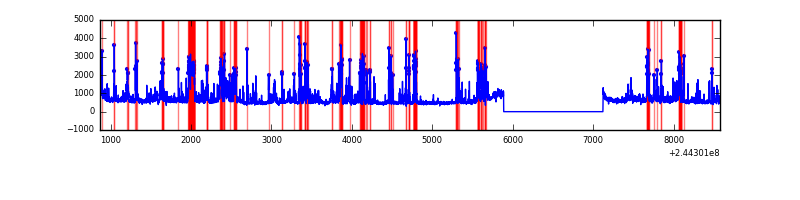 |
| C | 7710 | 6476 | 0 | 0 | 0.00% | 0.00% | 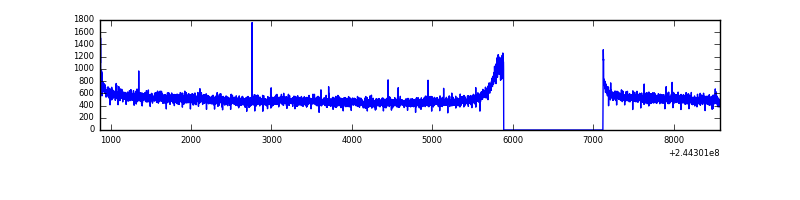 |
| D | 7710 | 6475 | 161 | 161 | 2.09% | 2.49% | 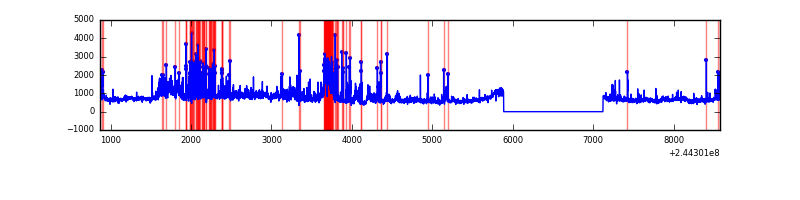 |
Top three noisy pixels from each quadrant. If the there are fewer than three noisy pixels in the level2.evt file, extra rows are filled as -1
| Pixel properties | Quadrant properties | ||||||
|---|---|---|---|---|---|---|---|
| Quadrant | DetID | PixID | Counts | Sigma | Mean | Median | Sigma |
| A | 8 | 5 | 2111498 | 12480.9 | 839 | 824 | 169.1 |
| A | 15 | 174 | 102429 | 600.81 | 839 | 824 | 169.1 |
| A | 13 | 251 | 81212 | 475.35 | 839 | 824 | 169.1 |
| B | 4 | 239 | 1523646 | 9476.61 | 842 | 827 | 160.7 |
| B | 10 | 245 | 102785 | 634.49 | 842 | 827 | 160.7 |
| B | 4 | 173 | 44294 | 270.5 | 842 | 827 | 160.7 |
| C | 5 | 207 | 6804 | 30.61 | 844 | 848 | 194.6 |
| C | 13 | 61 | 6228 | 27.65 | 844 | 848 | 194.6 |
| C | 14 | 234 | 4218 | 17.32 | 844 | 848 | 194.6 |
| D | 5 | 222 | 1054832 | 5238.35 | 837 | 816 | 201.2 |
| D | 8 | 195 | 818869 | 4065.64 | 837 | 816 | 201.2 |
| D | 12 | 227 | 52243 | 255.58 | 837 | 816 | 201.2 |
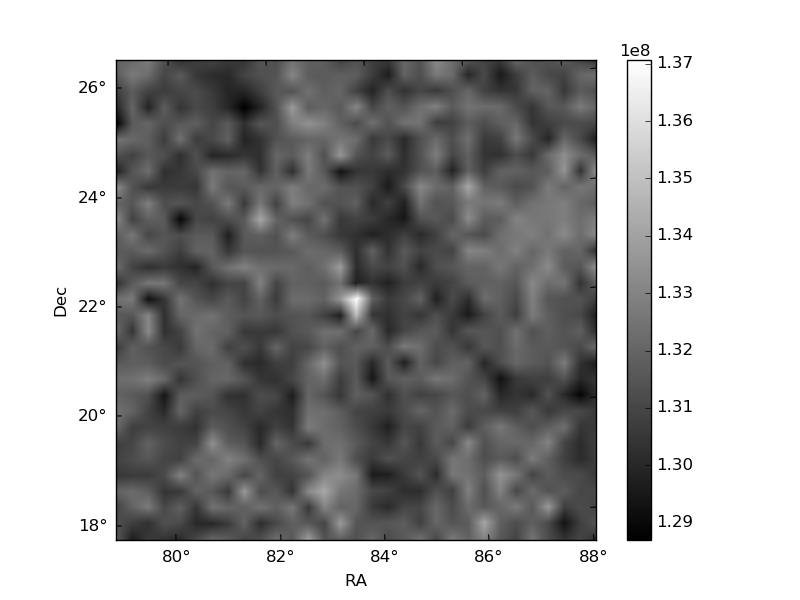
Histogram calculated using DETX and DETY for each event in the final _common_clean file
| Quadrant A | 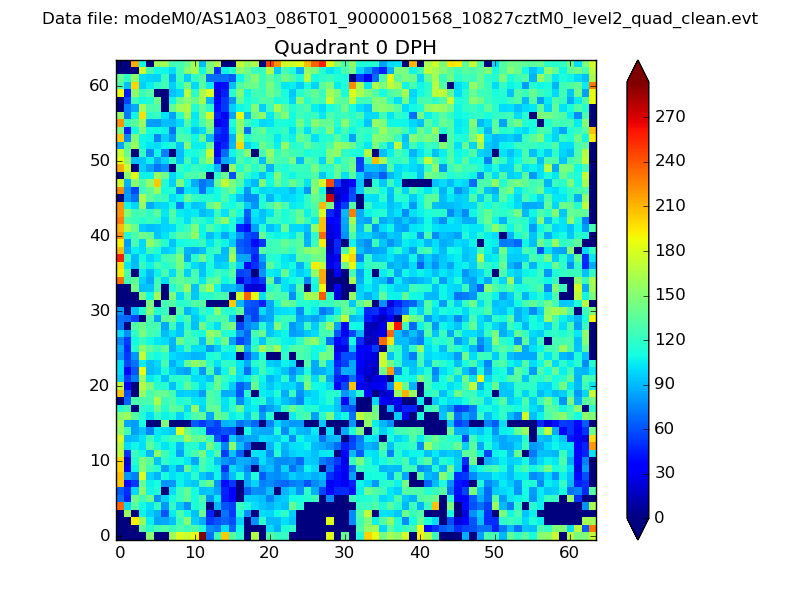 |
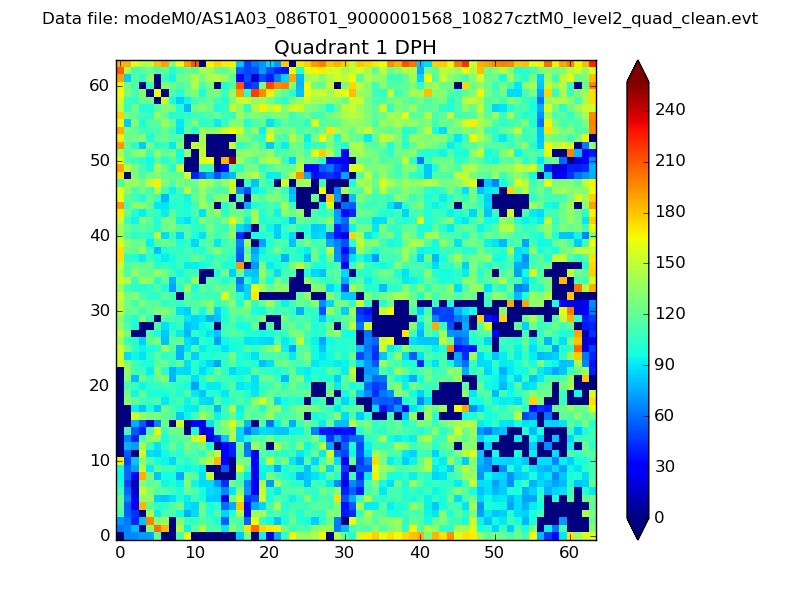 |
Quadrant B |
|---|---|---|---|
| Quadrant D | 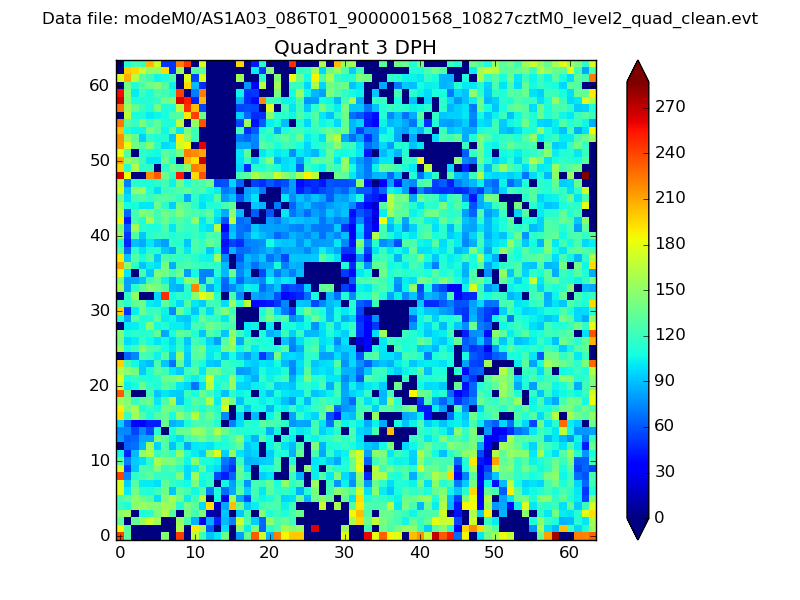 |
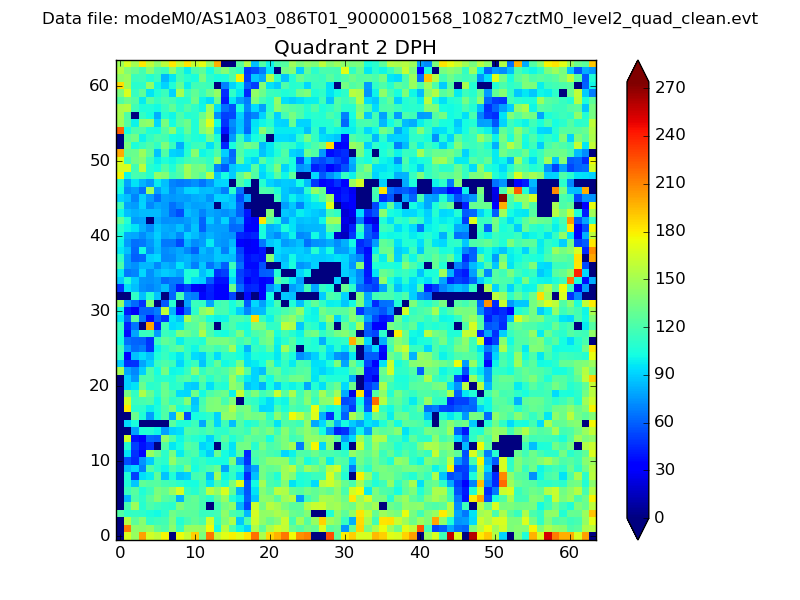 |
Quadrant C |
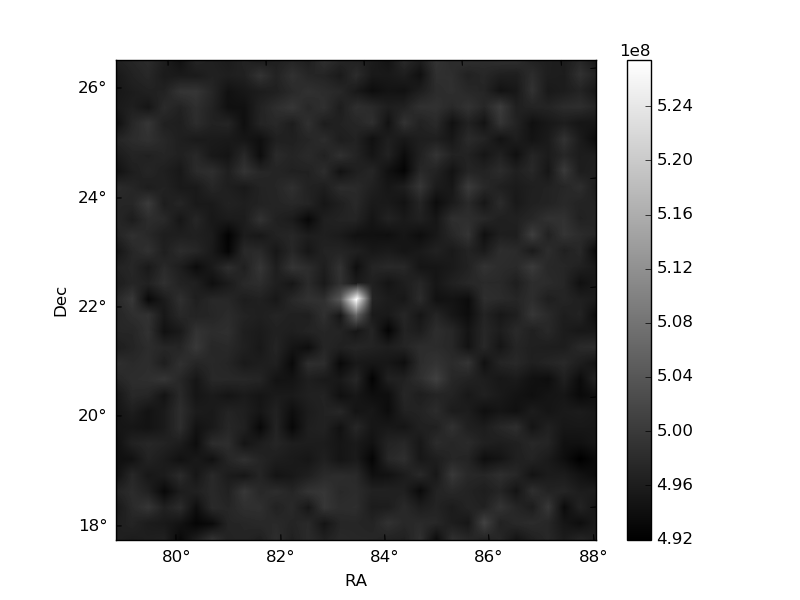
| Plot type | Count rate plots | Images |
|---|---|---|
| Comparison with Poisson distribution Blue bars denote a histogram of data divided into 1 sec bins. Red curve is a Poisson curve with rate = median count rate of data. |
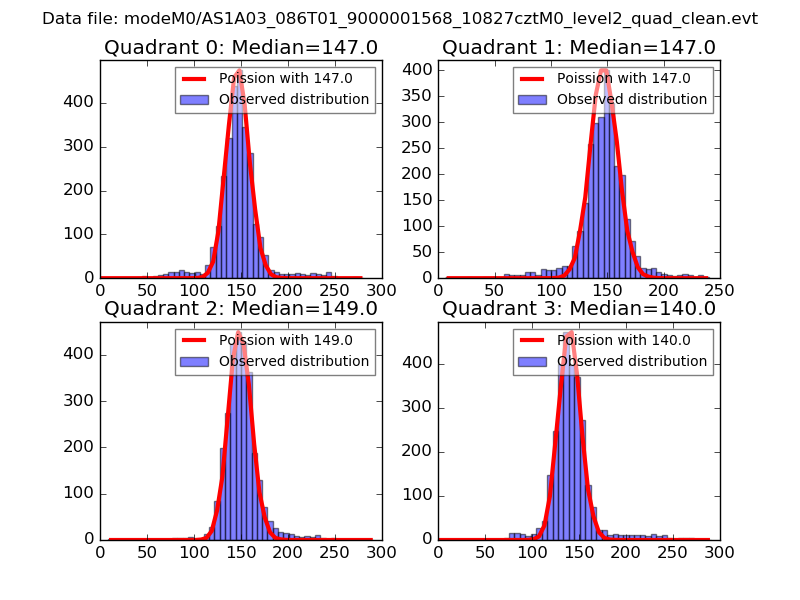 |
 |
| Quadrant-wise count rates Data is divided into 100 sec bins |
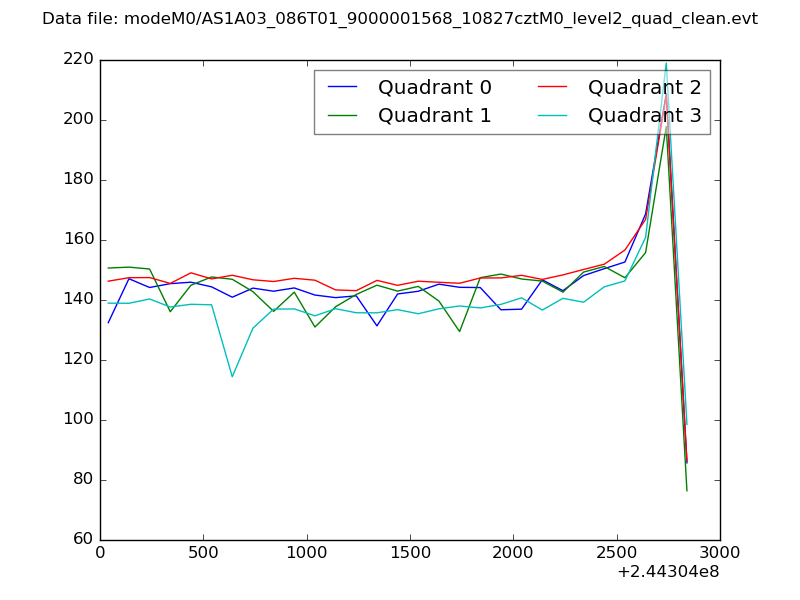 |
|
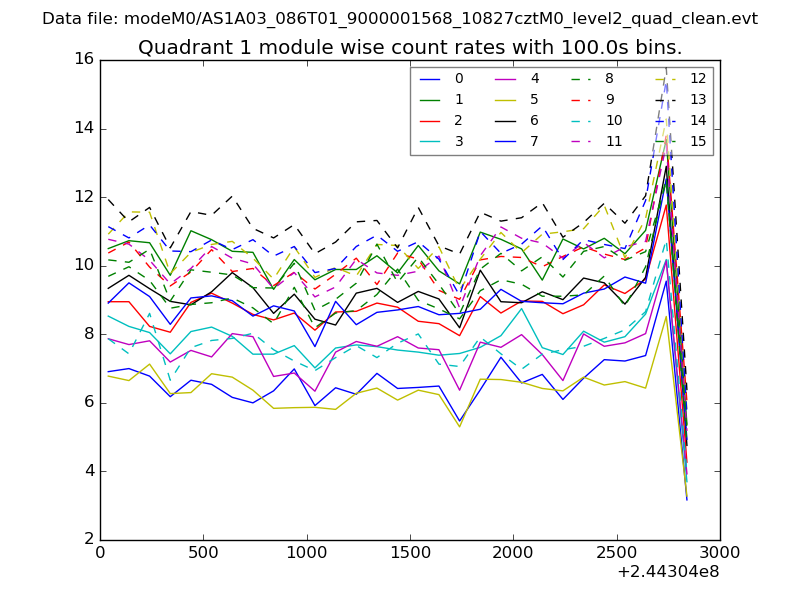
| Module-wise count rates for Quadrant A Data is divided into 100 sec bins |
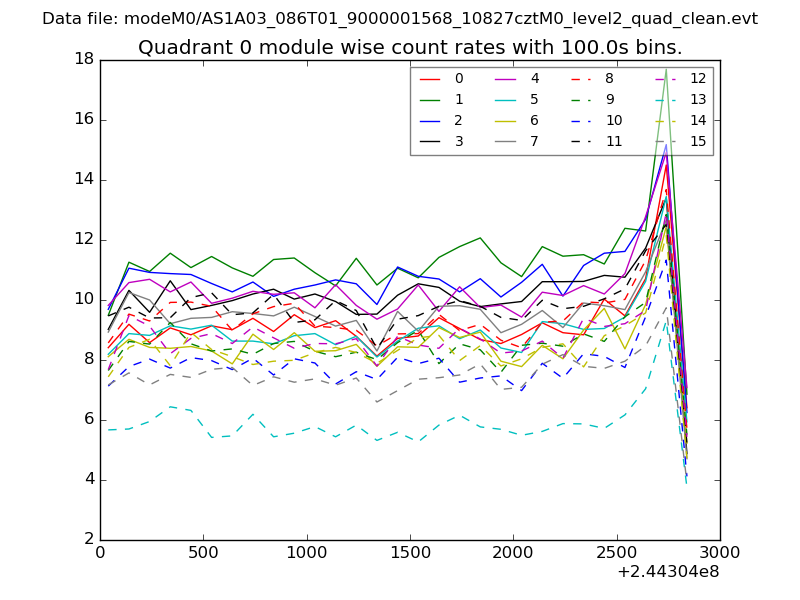 |
 |
| Module-wise count rates for Quadrant B Data is divided into 100 sec bins |
 |
 |
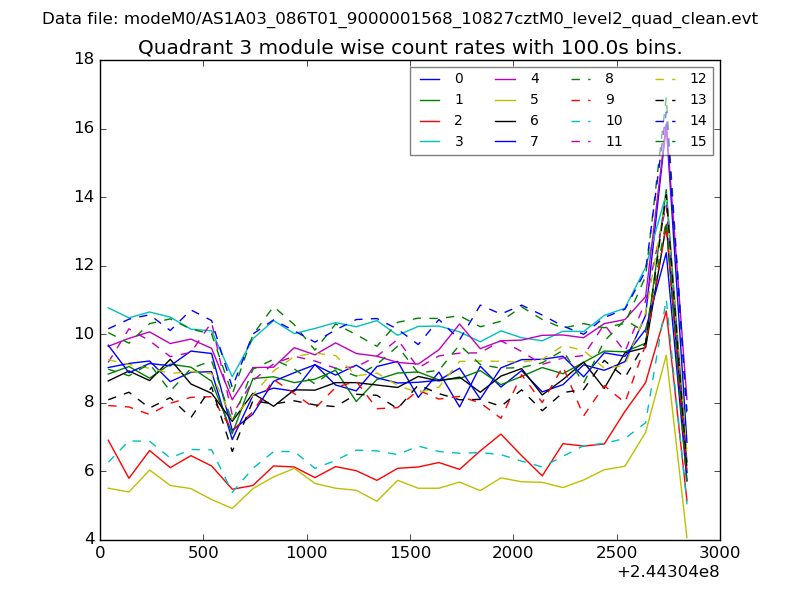
| Module-wise count rates for Quadrant C Data is divided into 100 sec bins |
 |
 |
| Module-wise count rates for Quadrant D Data is divided into 100 sec bins |
 |
 |
| Parameter | Plot |
|---|---|
| CZT HV Monitor |  |
| D_VDD | 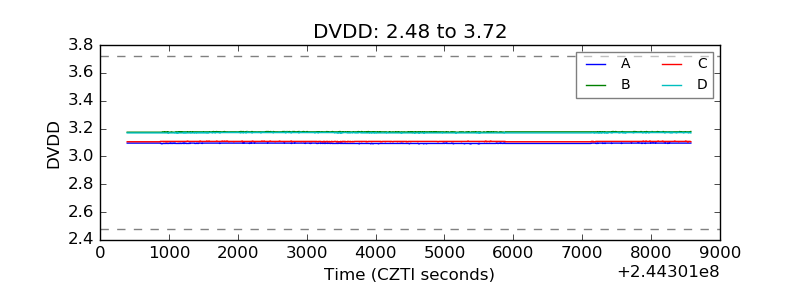 |
| Temperature 1 | 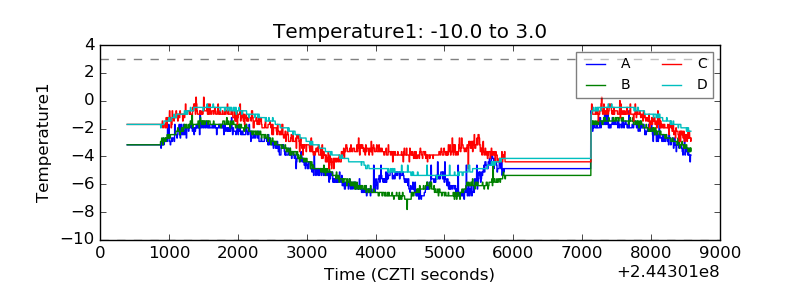 |
| Veto HV Monitor | 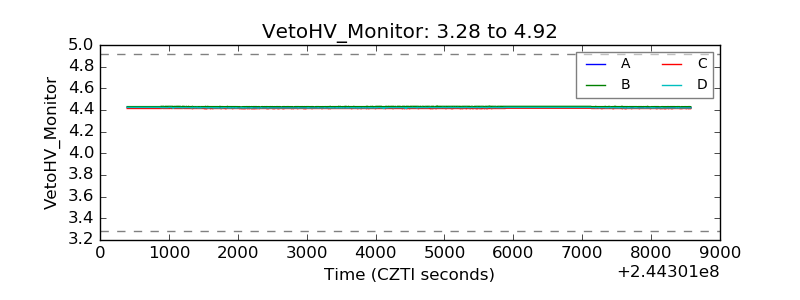 |
| Veto LLD | 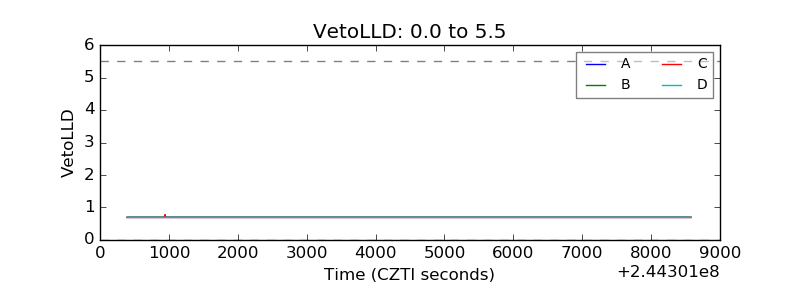 |
| Alpha Counter | 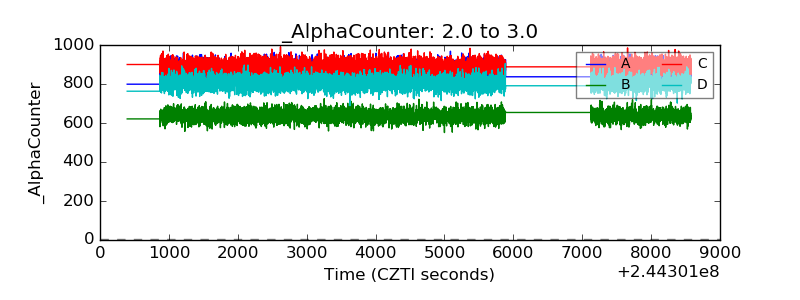 |
| _CPM_Rate | 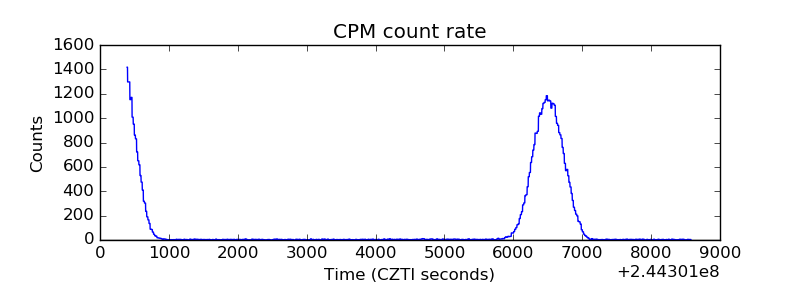 |
| CZT Counter | 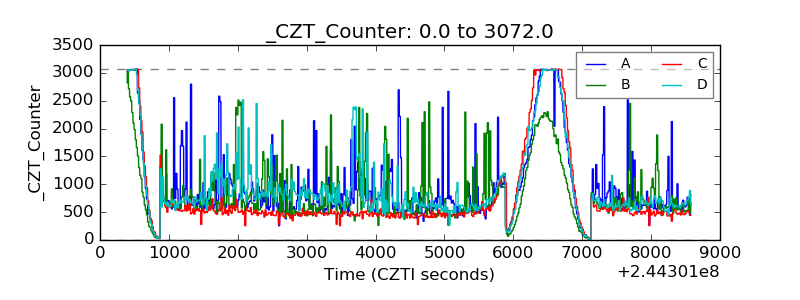 |
| +2.5 Volts monitor |  |
| +5 Volts monitor |  |
| _ROLL_ROT | 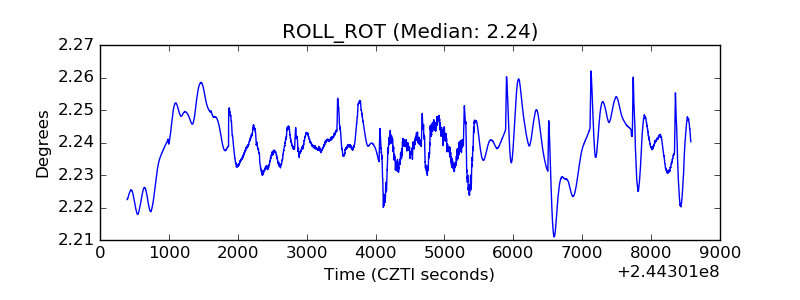 |
| _Roll_DEC | 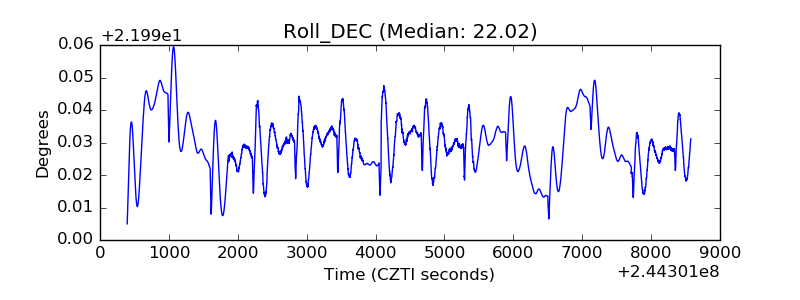 |
| _Roll_RA | 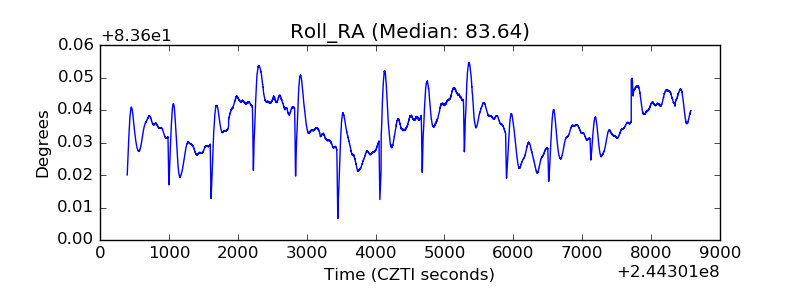 |
| Veto Counter | 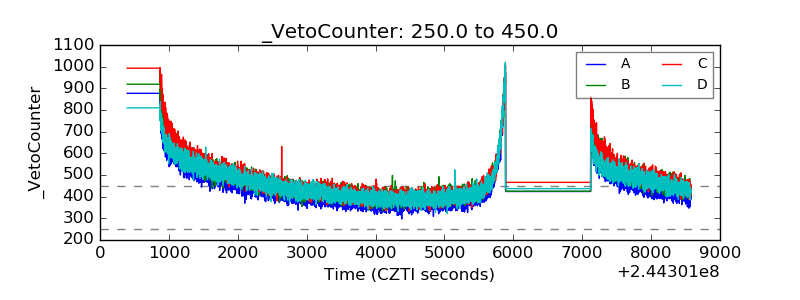 |