| Param | Original file | Final file |
|---|---|---|
| Filename | modeM0/AS1A03_086T01_9000001568_10828cztM0_level2.evt | modeM0/AS1A03_086T01_9000001568_10828cztM0_level2_quad_clean.evt |
| Size (bytes) | 568,304,640 | 78,249,600 |
| Size | 542.0 MB | 74.6 MB |
| Events in quadrant A | 4,568,683 | 485,156 |
| Events in quadrant B | 4,936,009 | 473,761 |
| Events in quadrant C | 3,199,761 | 491,208 |
| Events in quadrant D | 4,067,756 | 467,001 |
| Mode M9 | |||
|---|---|---|---|
| Quadrant | BADHDUFLAG | Total packets | Discarded packets |
| A | 0 | 16 | 0 |
| B | 0 | 16 | 0 |
| C | 0 | 16 | 0 |
| D | 0 | 17 | 0 |
| Mode SS | |||
|---|---|---|---|
| Quadrant | BADHDUFLAG | Total packets | Discarded packets |
| A | 0 | 132 | 0 |
| B | 0 | 132 | 0 |
| C | 0 | 132 | 0 |
| D | 0 | 132 | 0 |
| Mode M0 | |||
|---|---|---|---|
| Quadrant | BADHDUFLAG | Total packets | Discarded packets |
| A | 0 | 17969 | 3 |
| B | 0 | 19031 | 2 |
| C | 0 | 13510 | 2 |
| D | 0 | 16725 | 2 |
| Quadrant | Total seconds | Saturated seconds | Saturation percentage |
|---|---|---|---|
| A | 6481 | 293 | 4.520907% |
| B | 6481 | 528 | 8.146891% |
| C | 6481 | 68 | 1.049221% |
| D | 6481 | 91 | 1.404104% |
Noise dominated data is calculated using 1-second bins in cleaned event files. If a bin has >2000 counts, and if more than 50% of those come from <1% of pixels, then it is considered to be noise-dominated and hence unusable.
| Quadrant | # 1 sec bins | Bins with >0 counts | Bins with >2000 counts | High rate bins dominated by noise | Noise dominated (total time) | Noise dominated (detector-on time) | Marked lightcurve |
|---|---|---|---|---|---|---|---|
| A | 7601 | 6482 | 139 | 139 | 1.83% | 2.14% | 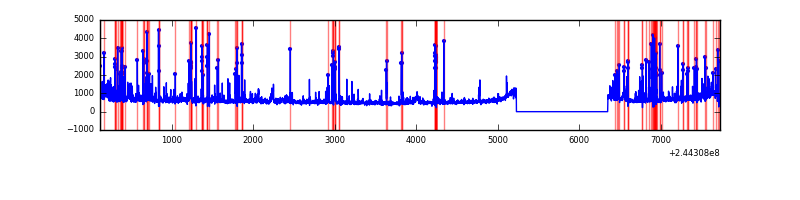 |
| B | 7601 | 6482 | 229 | 229 | 3.01% | 3.53% | 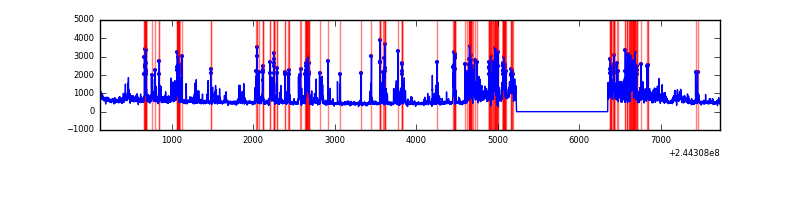 |
| C | 7601 | 6482 | 0 | 0 | 0.00% | 0.00% | 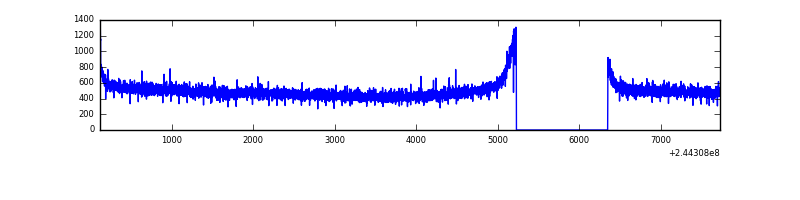 |
| D | 7601 | 6482 | 17 | 17 | 0.22% | 0.26% |  |
Top three noisy pixels from each quadrant. If the there are fewer than three noisy pixels in the level2.evt file, extra rows are filled as -1
| Pixel properties | Quadrant properties | ||||||
|---|---|---|---|---|---|---|---|
| Quadrant | DetID | PixID | Counts | Sigma | Mean | Median | Sigma |
| A | 8 | 5 | 1235645 | 7331.02 | 827 | 812 | 168.4 |
| A | 13 | 251 | 129926 | 766.53 | 827 | 812 | 168.4 |
| A | 11 | 29 | 14744 | 82.71 | 827 | 812 | 168.4 |
| B | 4 | 239 | 1616966 | 10341.3 | 816 | 800 | 156.3 |
| B | 4 | 173 | 27103 | 168.3 | 816 | 800 | 156.3 |
| B | 0 | 214 | 23326 | 144.14 | 816 | 800 | 156.3 |
| C | 13 | 61 | 6188 | 28.22 | 819 | 828 | 189.9 |
| C | 5 | 207 | 3517 | 14.16 | 819 | 828 | 189.9 |
| C | 8 | 222 | 3127 | 12.11 | 819 | 828 | 189.9 |
| D | 8 | 195 | 653715 | 3316.21 | 816 | 796 | 196.9 |
| D | 1 | 52 | 79017 | 397.29 | 816 | 796 | 196.9 |
| D | 12 | 227 | 60902 | 305.28 | 816 | 796 | 196.9 |
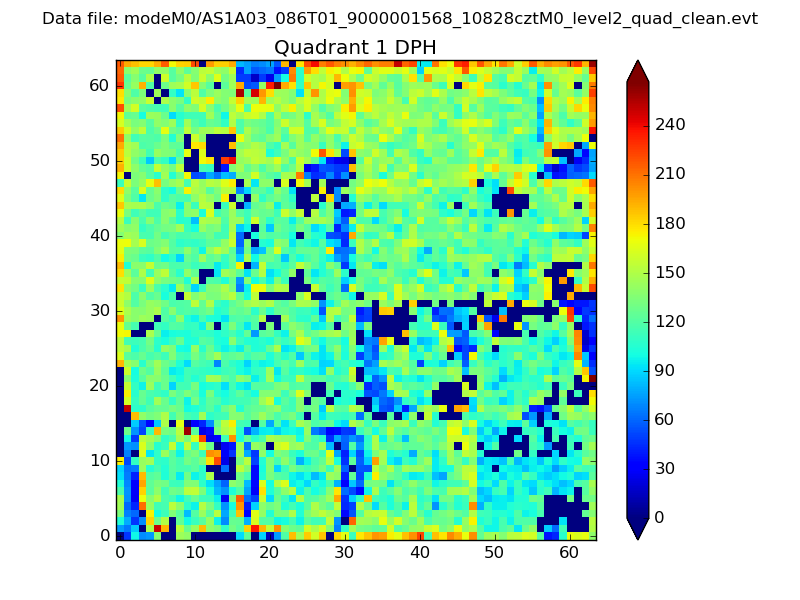
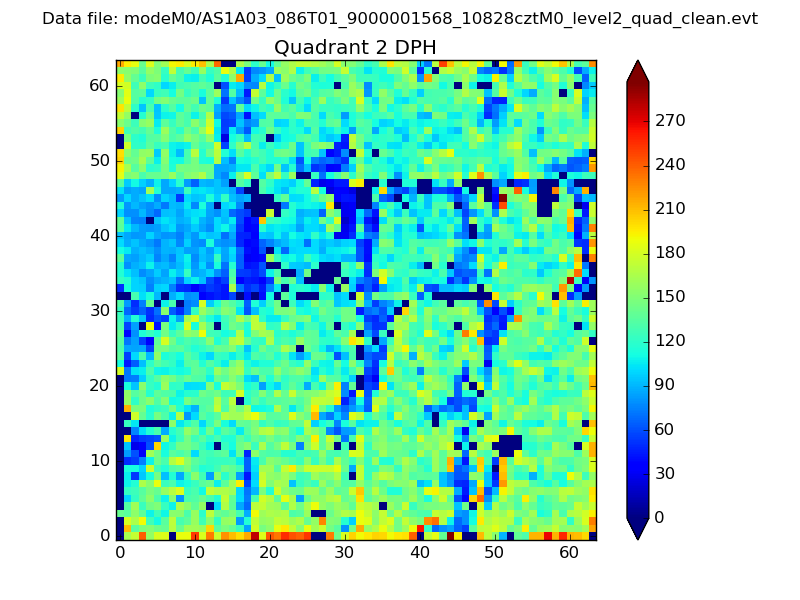
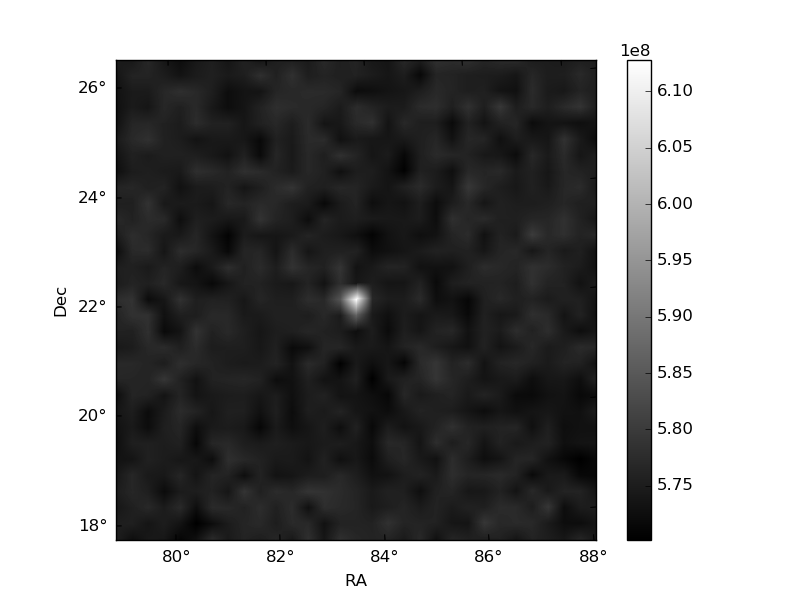
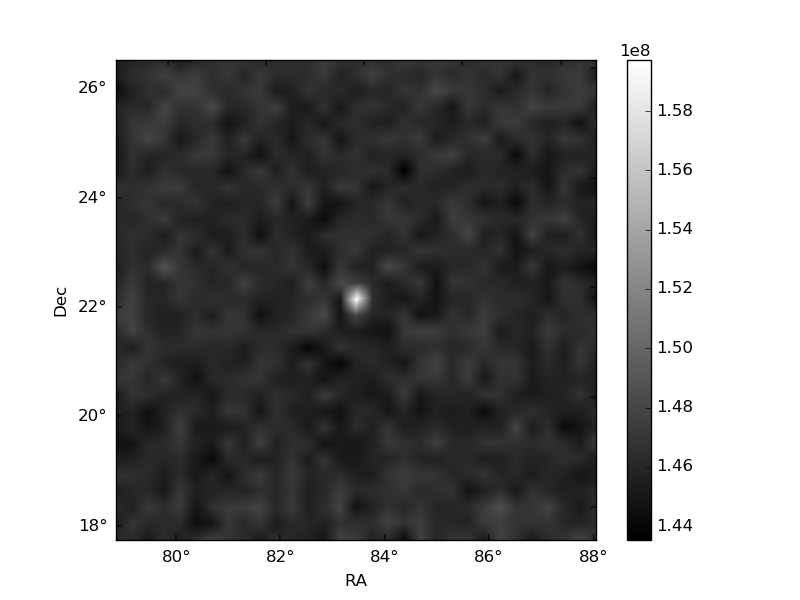
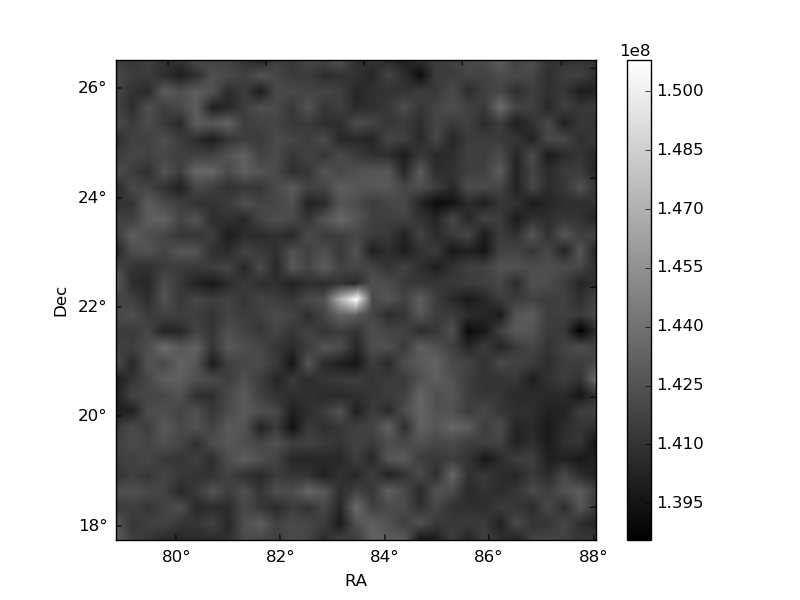
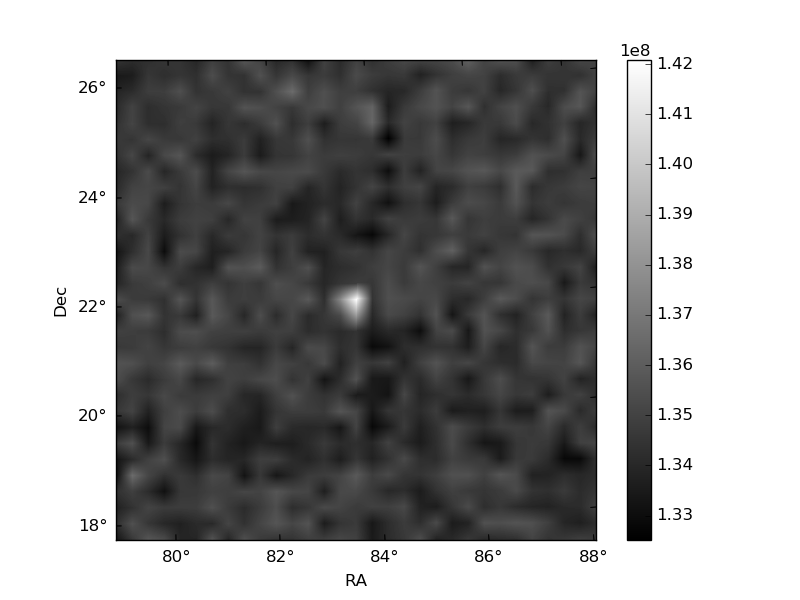
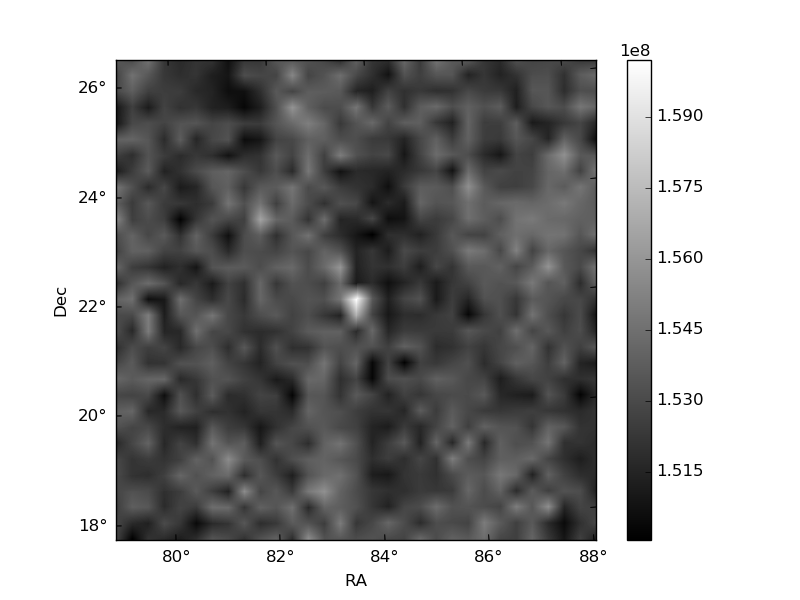
Histogram calculated using DETX and DETY for each event in the final _common_clean file
| Quadrant A | 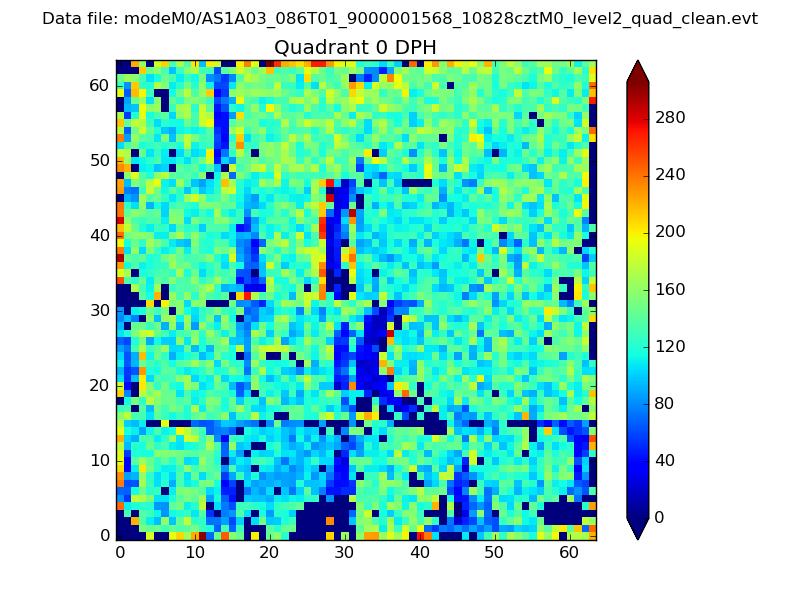 |
 |
Quadrant B |
|---|---|---|---|
| Quadrant D | 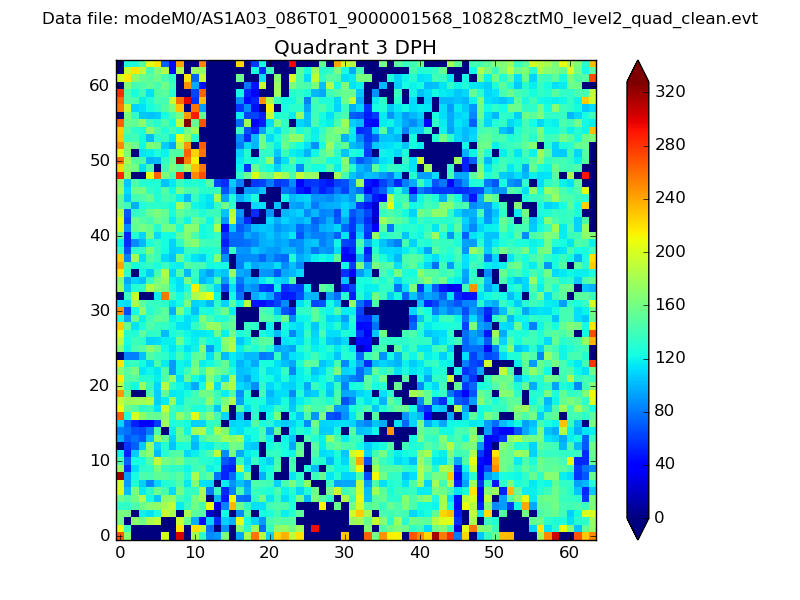 |
 |
Quadrant C |
| Plot type | Count rate plots | Images |
|---|---|---|
| Comparison with Poisson distribution Blue bars denote a histogram of data divided into 1 sec bins. Red curve is a Poisson curve with rate = median count rate of data. |
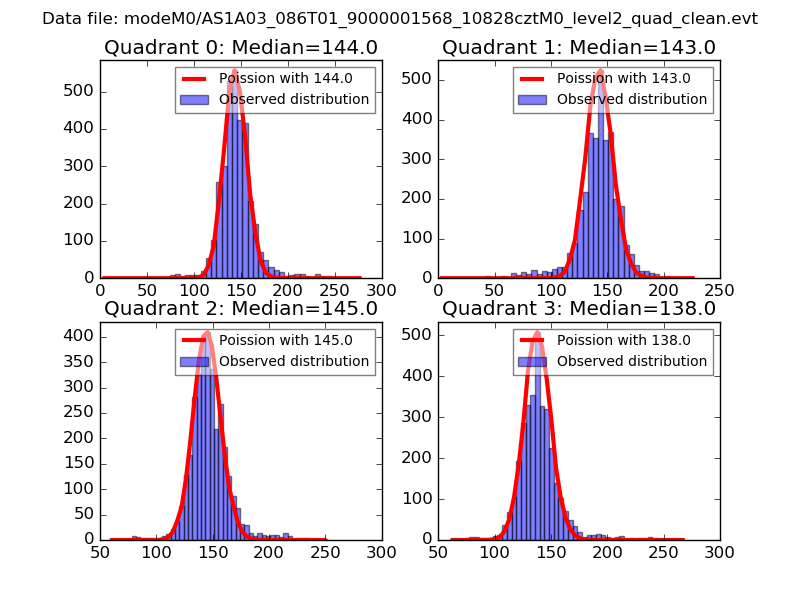 |
 |
| Quadrant-wise count rates Data is divided into 100 sec bins |
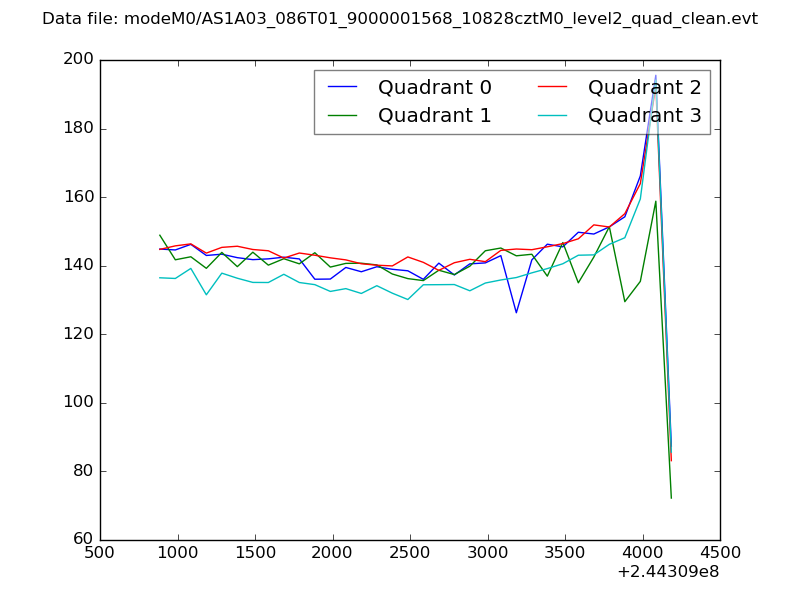 |
|
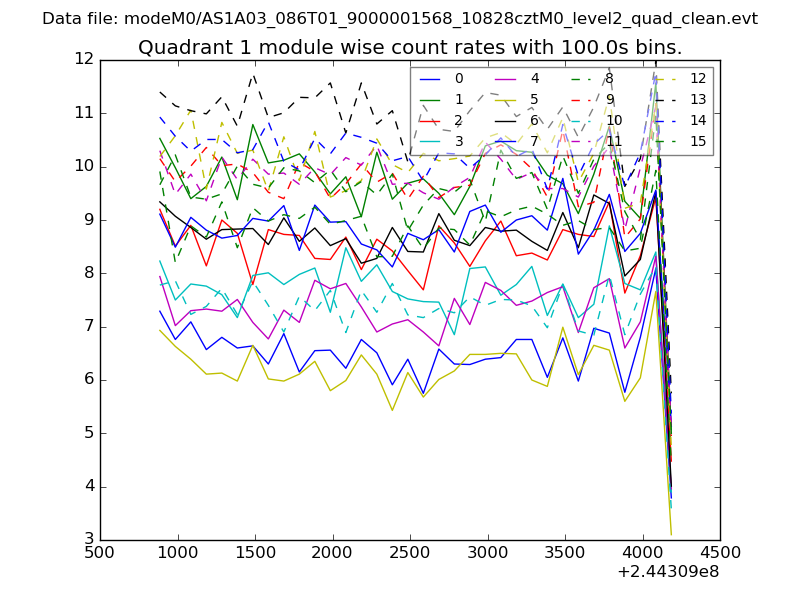
| Module-wise count rates for Quadrant A Data is divided into 100 sec bins |
 |
 |
| Module-wise count rates for Quadrant B Data is divided into 100 sec bins |
 |
 |
| Module-wise count rates for Quadrant C Data is divided into 100 sec bins |
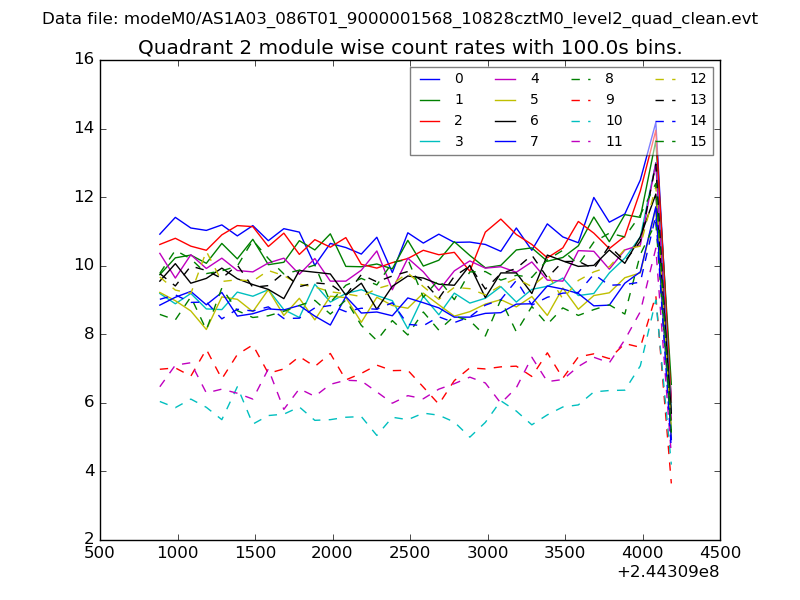 |
 |
| Module-wise count rates for Quadrant D Data is divided into 100 sec bins |
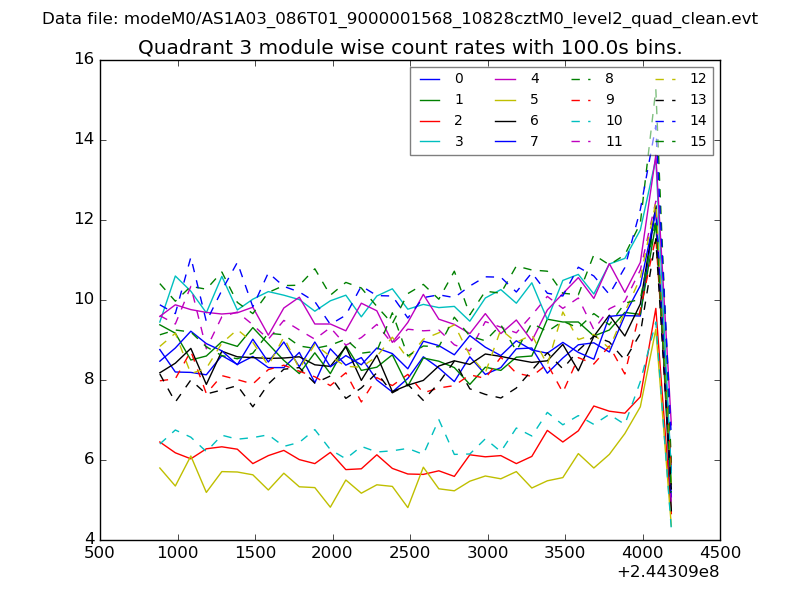 |
 |
| Parameter | Plot |
|---|---|
| CZT HV Monitor | 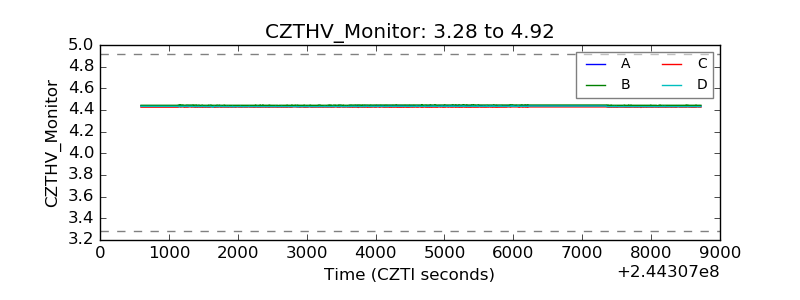 |
| D_VDD | 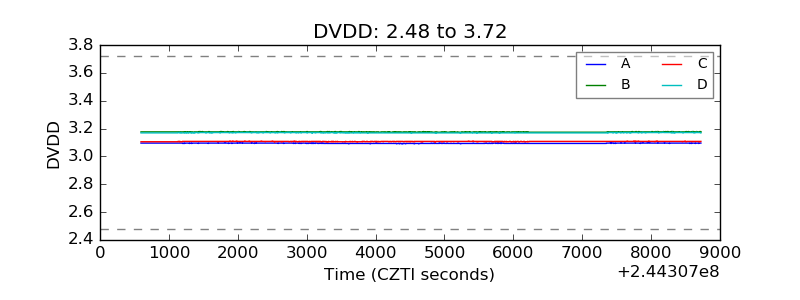 |
| Temperature 1 | 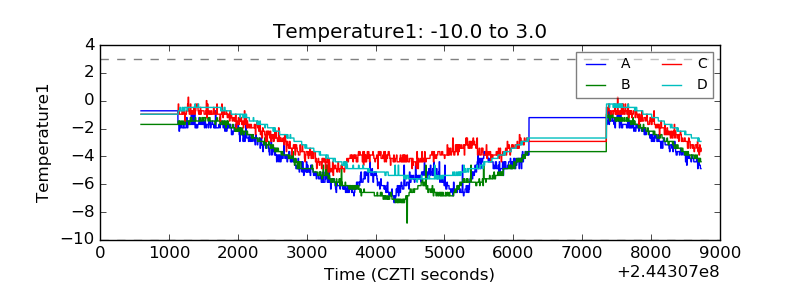 |
| Veto HV Monitor | 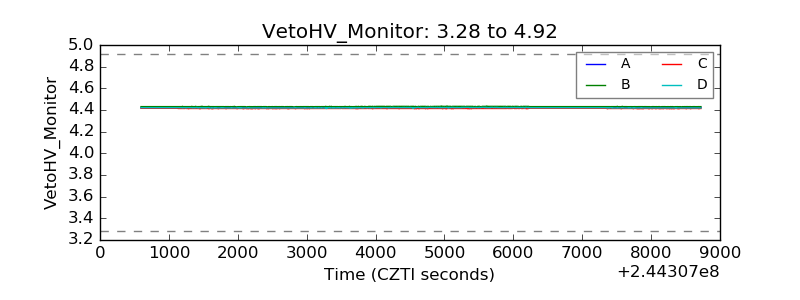 |
| Veto LLD |  |
| Alpha Counter | 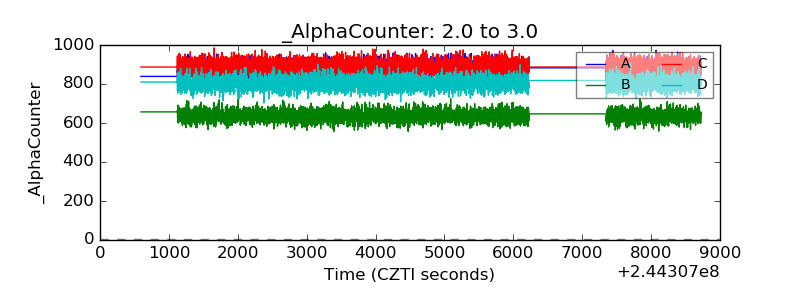 |
| _CPM_Rate | 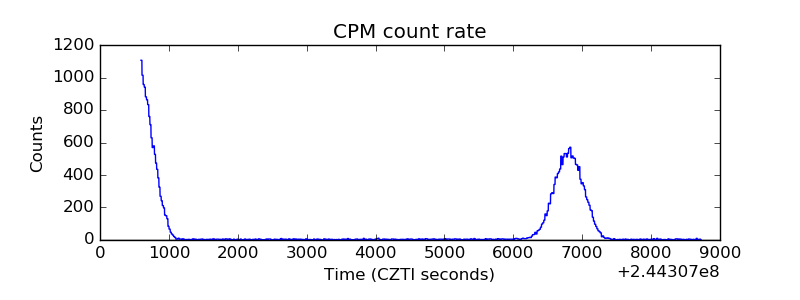 |
| CZT Counter | 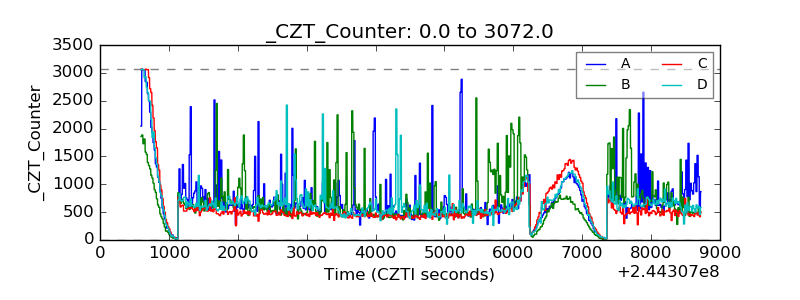 |
| +2.5 Volts monitor |  |
| +5 Volts monitor |  |
| _ROLL_ROT |  |
| _Roll_DEC | 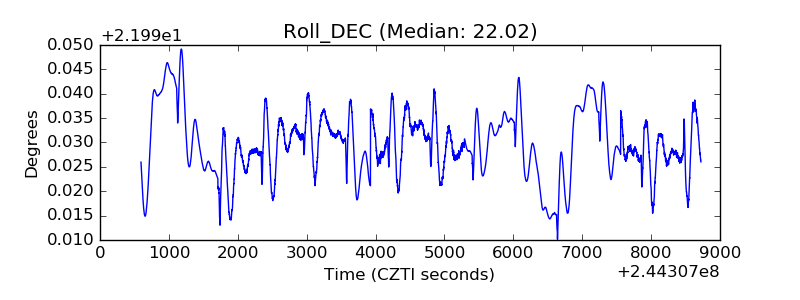 |
| _Roll_RA | 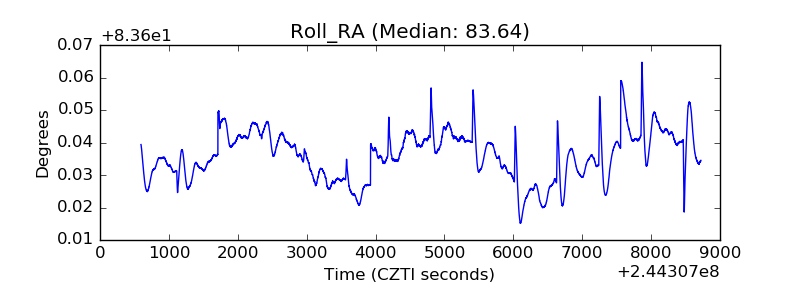 |
| Veto Counter | 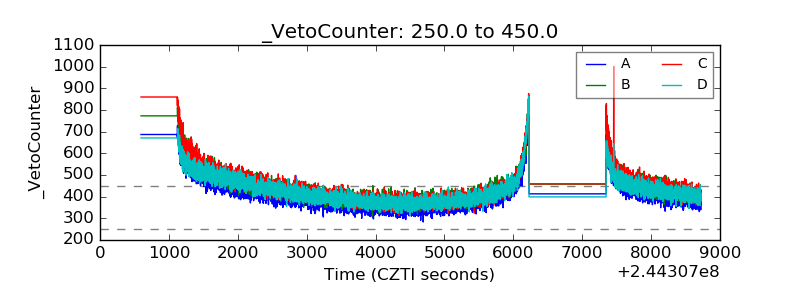 |