| Param | Original file | Final file |
|---|---|---|
| Filename | modeM0/AS1A03_086T01_9000001568_10829cztM0_level2.evt | modeM0/AS1A03_086T01_9000001568_10829cztM0_level2_quad_clean.evt |
| Size (bytes) | 630,408,960 | 88,560,000 |
| Size | 601.2 MB | 84.5 MB |
| Events in quadrant A | 5,641,360 | 556,229 |
| Events in quadrant B | 4,636,632 | 566,506 |
| Events in quadrant C | 3,271,024 | 572,095 |
| Events in quadrant D | 5,079,855 | 509,997 |
| Mode M9 | |||
|---|---|---|---|
| Quadrant | BADHDUFLAG | Total packets | Discarded packets |
| A | 0 | 9 | 0 |
| B | 0 | 9 | 0 |
| C | 0 | 9 | 0 |
| D | 0 | 10 | 0 |
| Mode SS | |||
|---|---|---|---|
| Quadrant | BADHDUFLAG | Total packets | Discarded packets |
| A | 0 | 140 | 0 |
| B | 0 | 140 | 0 |
| C | 0 | 140 | 0 |
| D | 0 | 140 | 0 |
| Mode M0 | |||
|---|---|---|---|
| Quadrant | BADHDUFLAG | Total packets | Discarded packets |
| A | 0 | 21499 | 3 |
| B | 0 | 18257 | 2 |
| C | 0 | 14118 | 2 |
| D | 0 | 19726 | 2 |
| Quadrant | Total seconds | Saturated seconds | Saturation percentage |
|---|---|---|---|
| A | 6840 | 594 | 8.684211% |
| B | 6840 | 348 | 5.087719% |
| C | 6840 | 48 | 0.701754% |
| D | 6840 | 378 | 5.526316% |
Noise dominated data is calculated using 1-second bins in cleaned event files. If a bin has >2000 counts, and if more than 50% of those come from <1% of pixels, then it is considered to be noise-dominated and hence unusable.
| Quadrant | # 1 sec bins | Bins with >0 counts | Bins with >2000 counts | High rate bins dominated by noise | Noise dominated (total time) | Noise dominated (detector-on time) | Marked lightcurve |
|---|---|---|---|---|---|---|---|
| A | 7695 | 6841 | 355 | 355 | 4.61% | 5.19% | 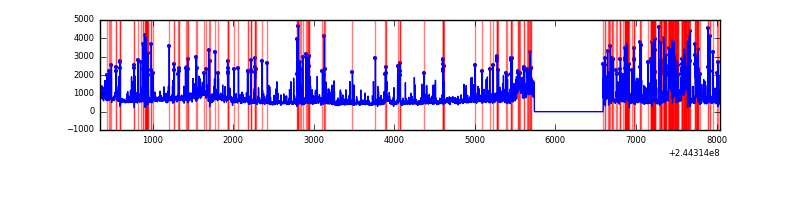 |
| B | 7695 | 6841 | 132 | 132 | 1.72% | 1.93% | 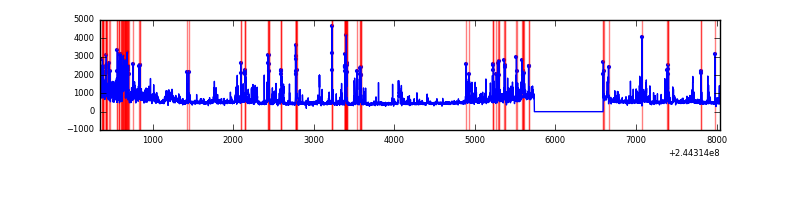 |
| C | 7695 | 6841 | 0 | 0 | 0.00% | 0.00% | 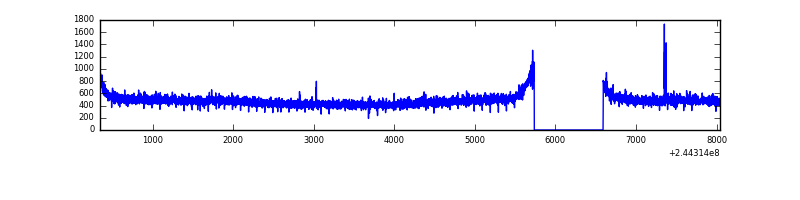 |
| D | 7695 | 6841 | 303 | 303 | 3.94% | 4.43% | 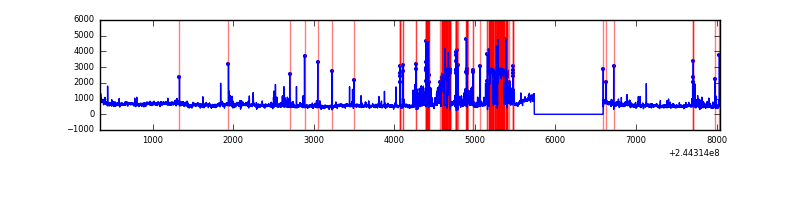 |
Top three noisy pixels from each quadrant. If the there are fewer than three noisy pixels in the level2.evt file, extra rows are filled as -1
| Pixel properties | Quadrant properties | ||||||
|---|---|---|---|---|---|---|---|
| Quadrant | DetID | PixID | Counts | Sigma | Mean | Median | Sigma |
| A | 8 | 5 | 2368176 | 13996.43 | 826 | 813 | 169.1 |
| A | 13 | 251 | 72322 | 422.78 | 826 | 813 | 169.1 |
| A | 11 | 29 | 16954 | 95.43 | 826 | 813 | 169.1 |
| B | 4 | 239 | 1133999 | 7075.33 | 843 | 826 | 160.2 |
| B | 0 | 214 | 79420 | 490.73 | 843 | 826 | 160.2 |
| B | 4 | 173 | 34633 | 211.08 | 843 | 826 | 160.2 |
| C | 14 | 234 | 9890 | 46.82 | 836 | 843 | 193.2 |
| C | 13 | 61 | 6302 | 28.25 | 836 | 843 | 193.2 |
| C | 8 | 222 | 2963 | 10.97 | 836 | 843 | 193.2 |
| D | 1 | 52 | 1111089 | 5677.63 | 807 | 785 | 195.6 |
| D | 8 | 195 | 676284 | 3454.22 | 807 | 785 | 195.6 |
| D | 13 | 104 | 56901 | 286.95 | 807 | 785 | 195.6 |
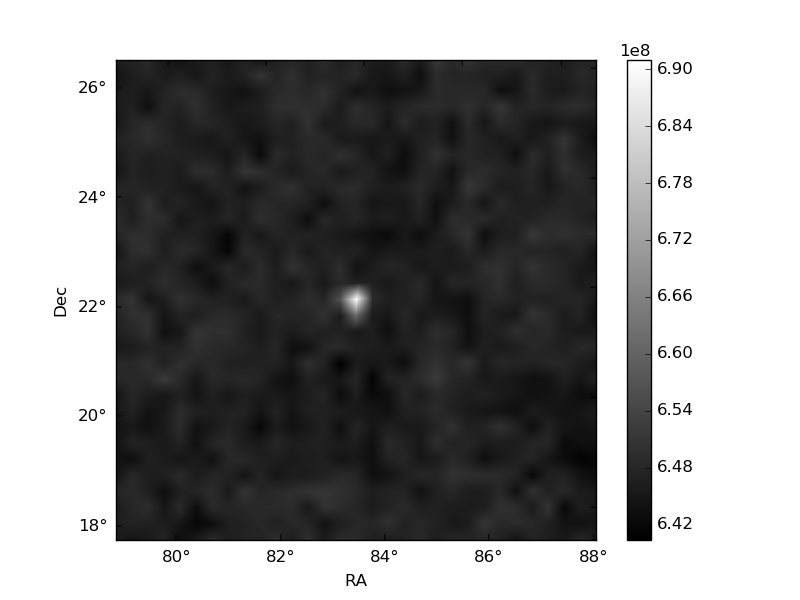
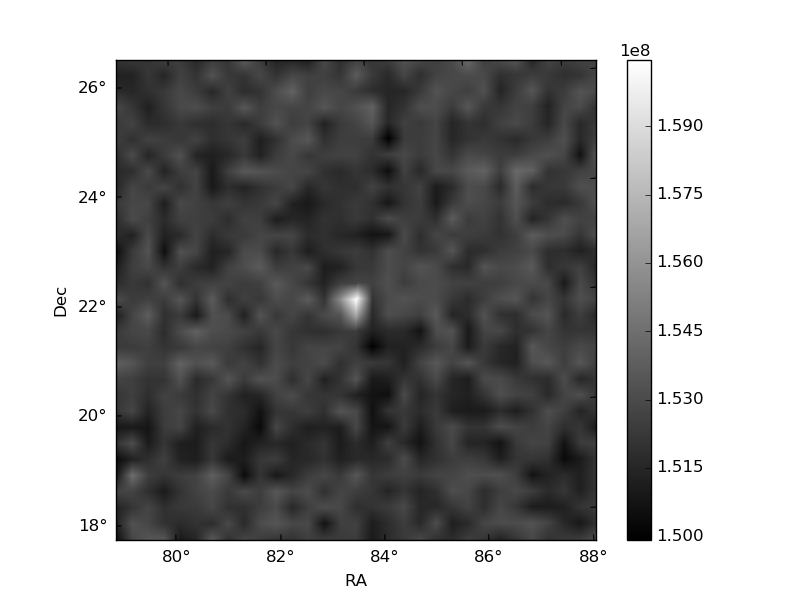
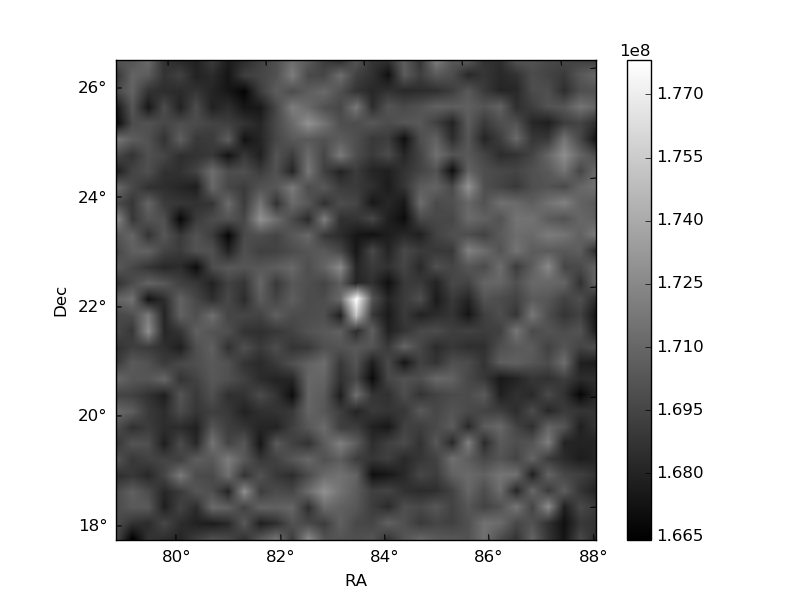
Histogram calculated using DETX and DETY for each event in the final _common_clean file
| Quadrant A | 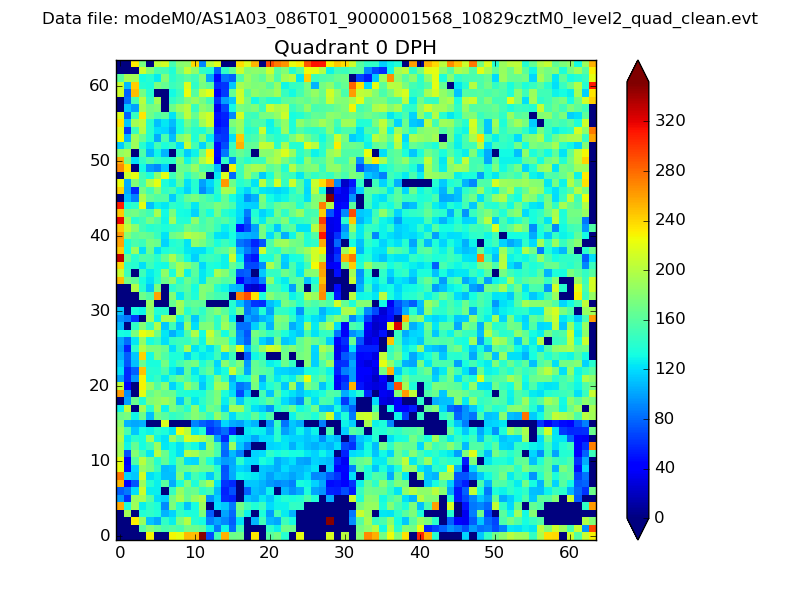 |
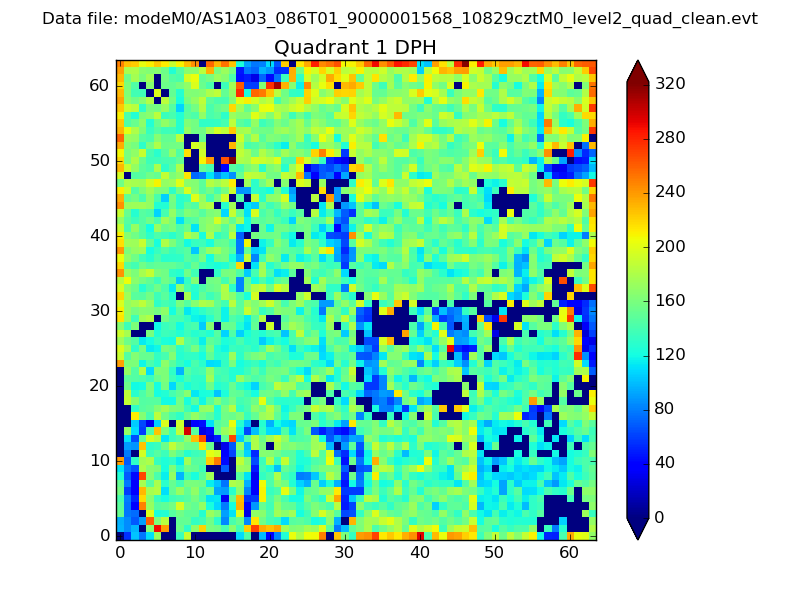 |
Quadrant B |
|---|---|---|---|
| Quadrant D | 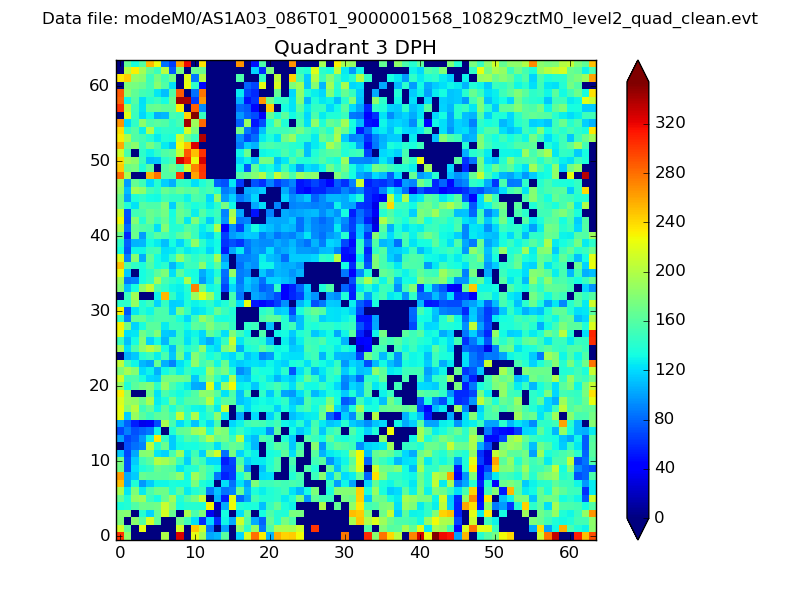 |
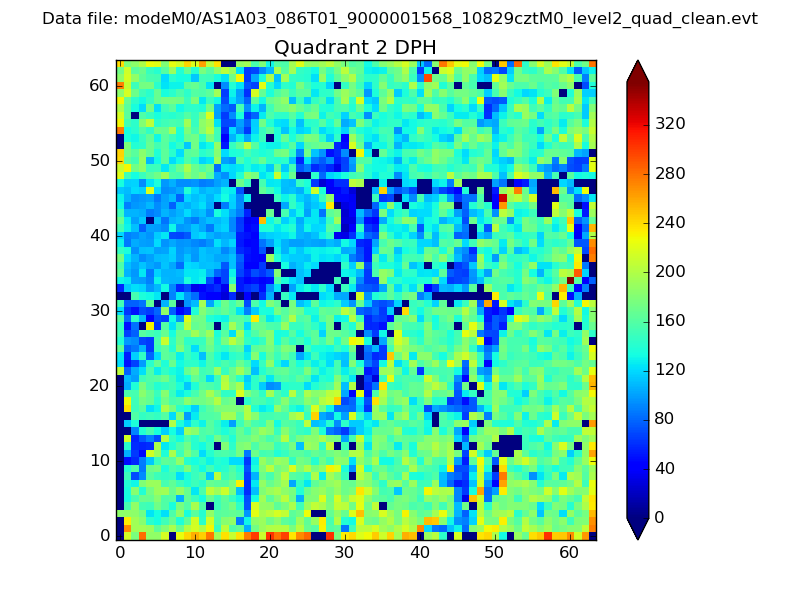 |
Quadrant C |
| Plot type | Count rate plots | Images |
|---|---|---|
| Comparison with Poisson distribution Blue bars denote a histogram of data divided into 1 sec bins. Red curve is a Poisson curve with rate = median count rate of data. |
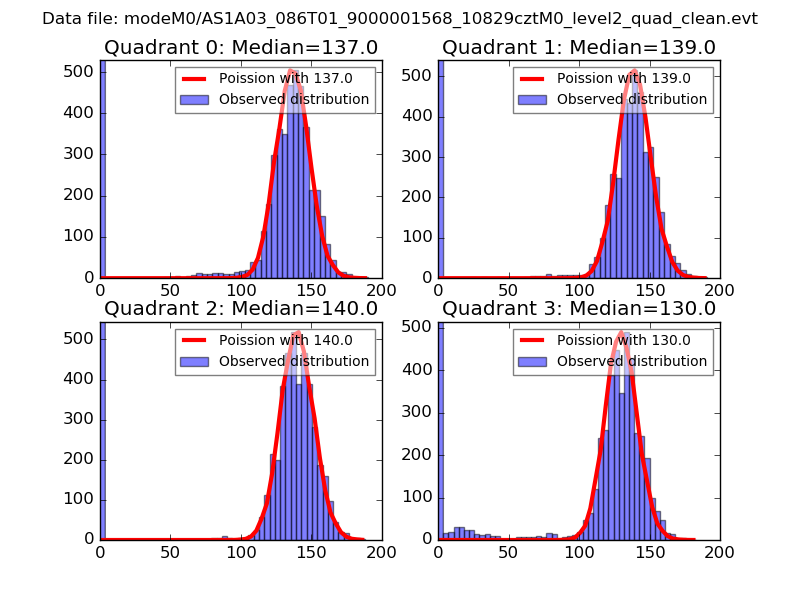 |
 |
| Quadrant-wise count rates Data is divided into 100 sec bins |
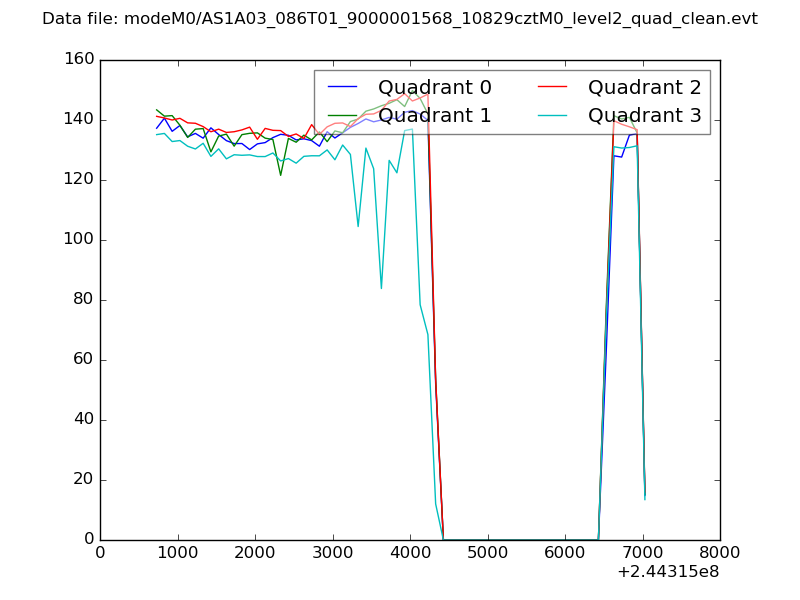 |
|
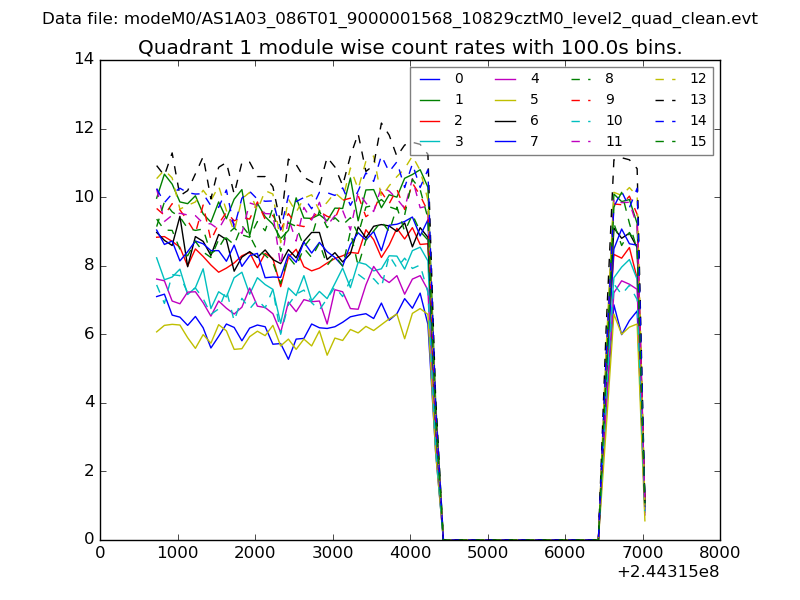
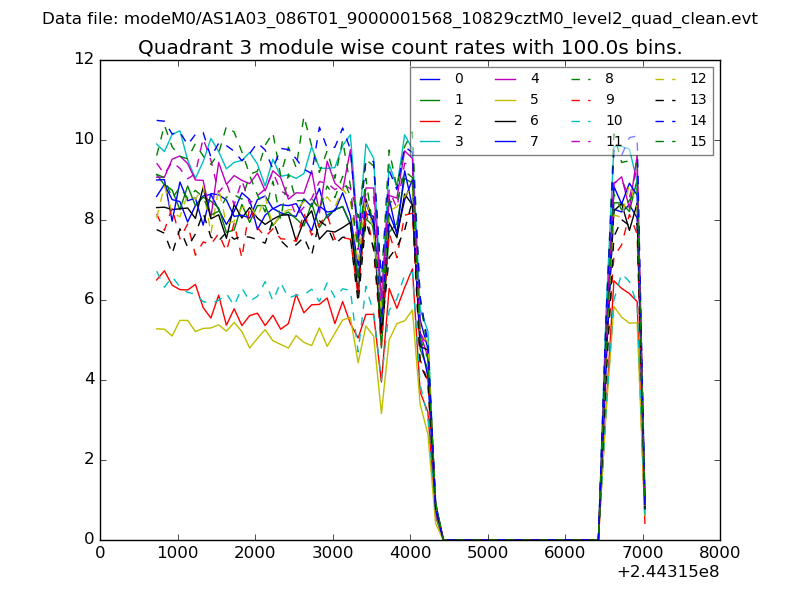
| Module-wise count rates for Quadrant A Data is divided into 100 sec bins |
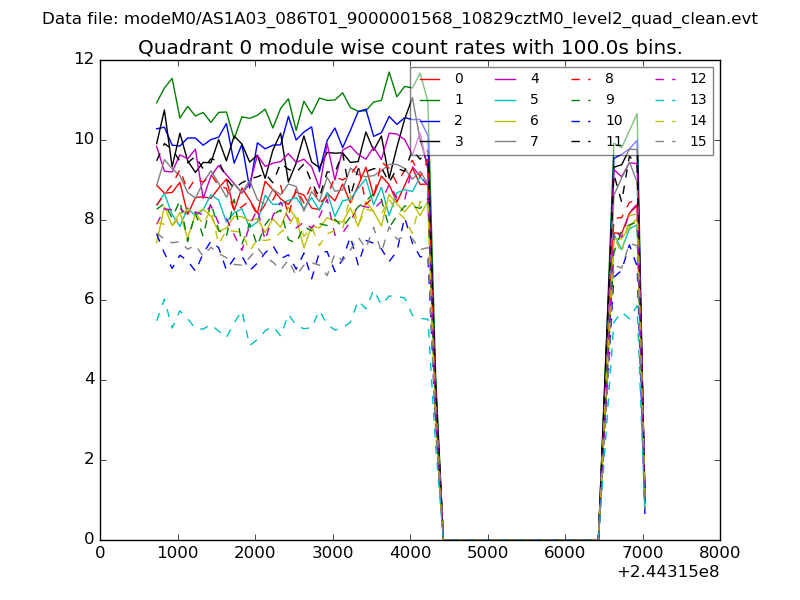 |
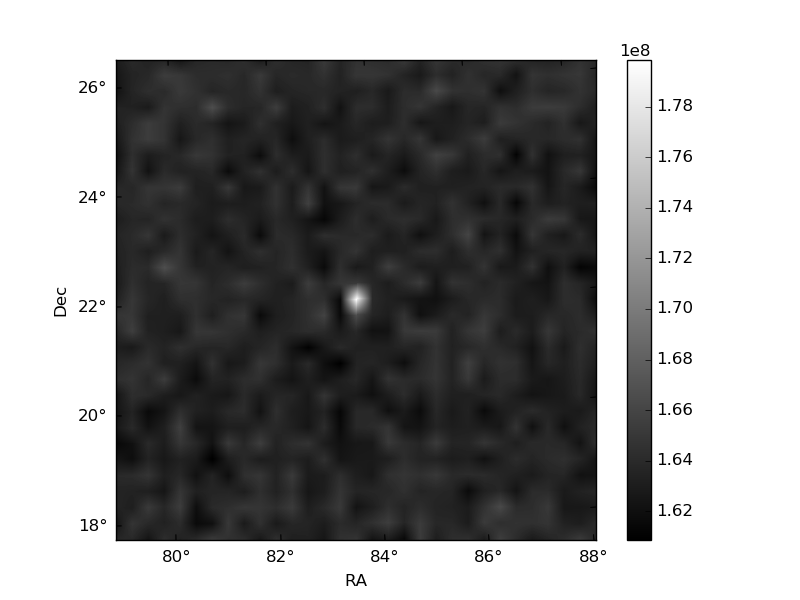 |
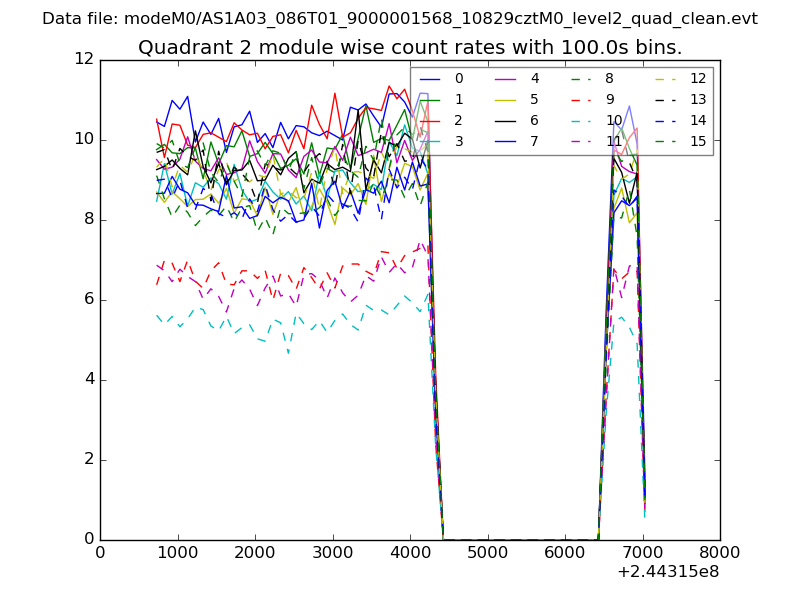
| Module-wise count rates for Quadrant B Data is divided into 100 sec bins |
 |
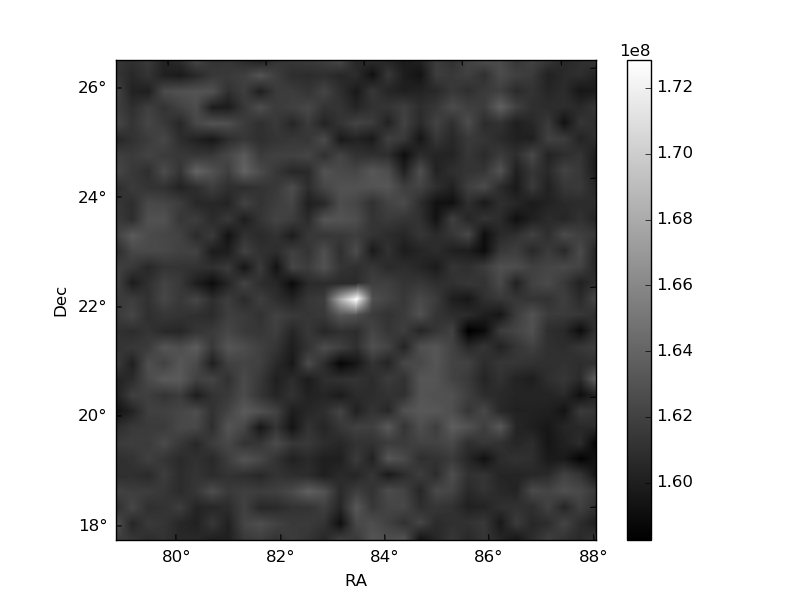 |
| Module-wise count rates for Quadrant C Data is divided into 100 sec bins |
 |
 |
| Module-wise count rates for Quadrant D Data is divided into 100 sec bins |
 |
 |
| Parameter | Plot |
|---|---|
| CZT HV Monitor | 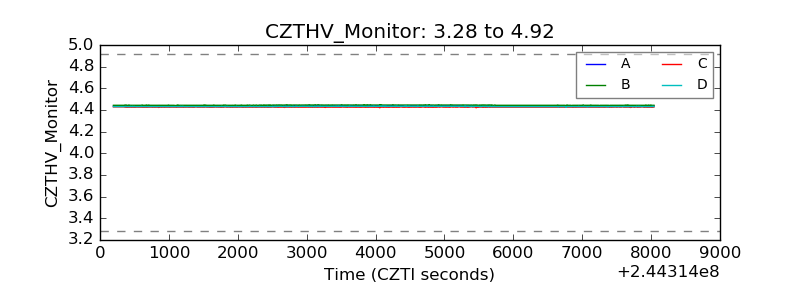 |
| D_VDD | 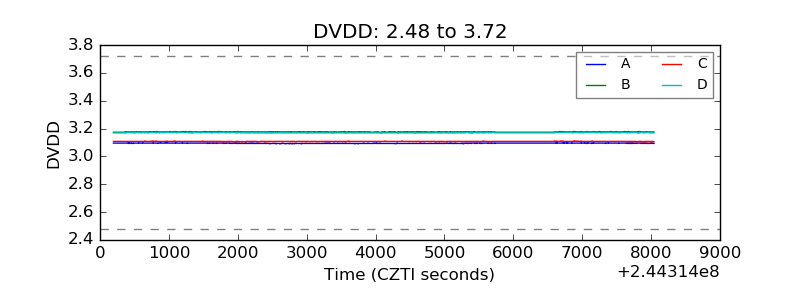 |
| Temperature 1 | 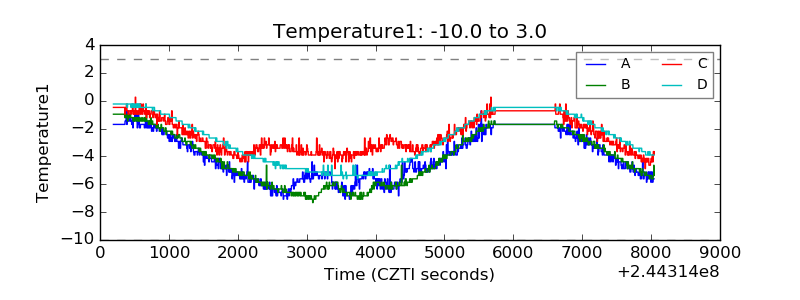 |
| Veto HV Monitor | 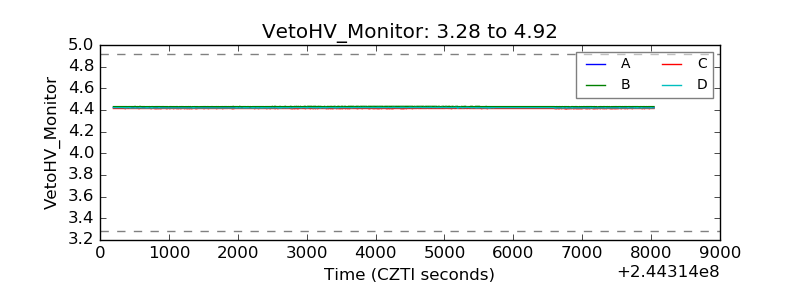 |
| Veto LLD |  |
| Alpha Counter | 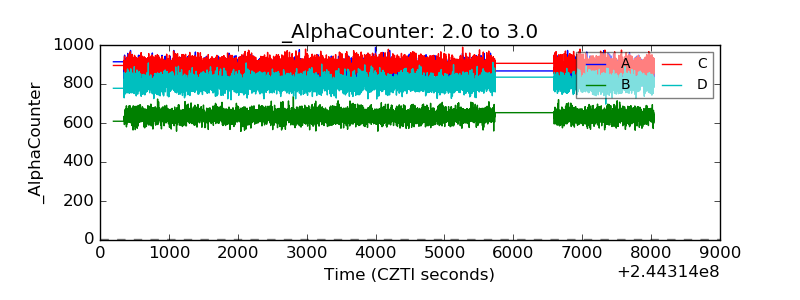 |
| _CPM_Rate | 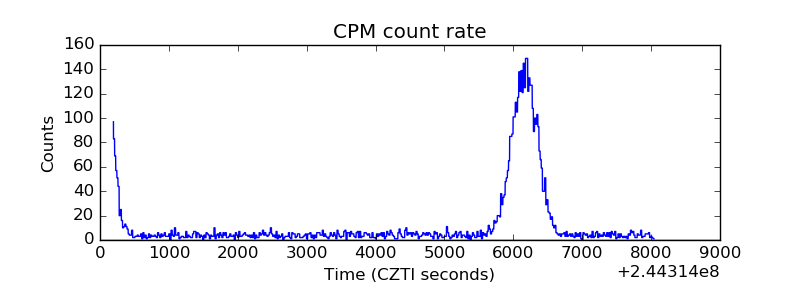 |
| CZT Counter | 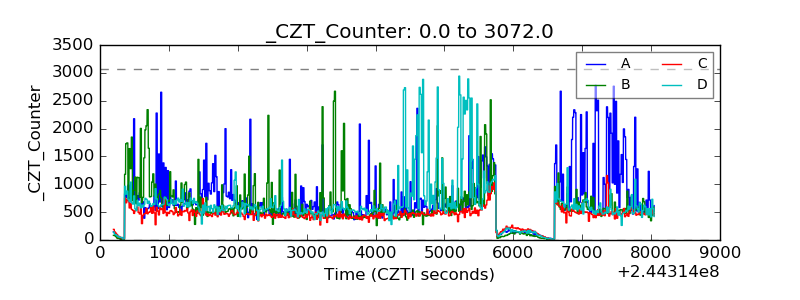 |
| +2.5 Volts monitor |  |
| +5 Volts monitor |  |
| _ROLL_ROT | 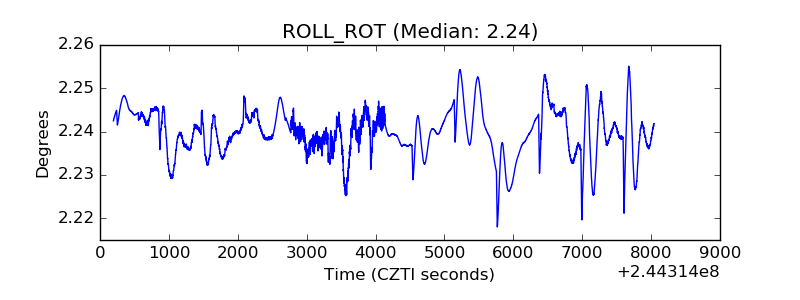 |
| _Roll_DEC | 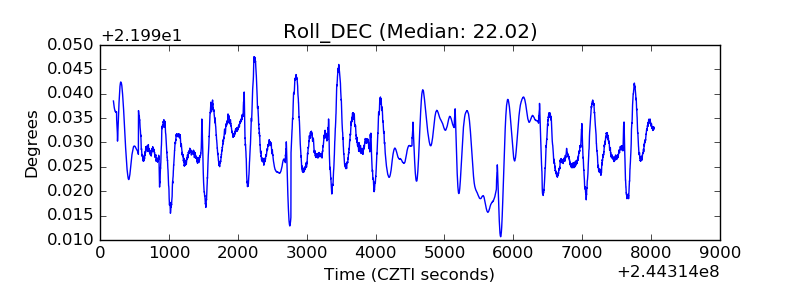 |
| _Roll_RA | 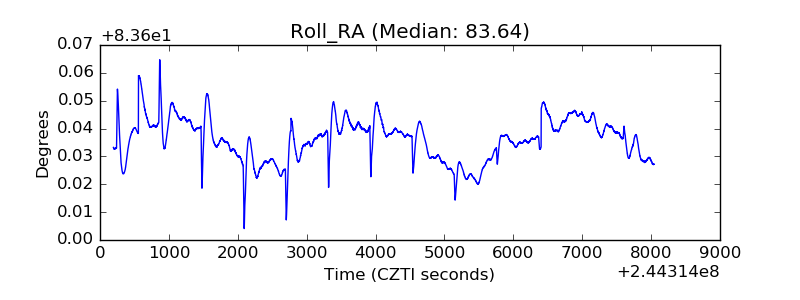 |
| Veto Counter | 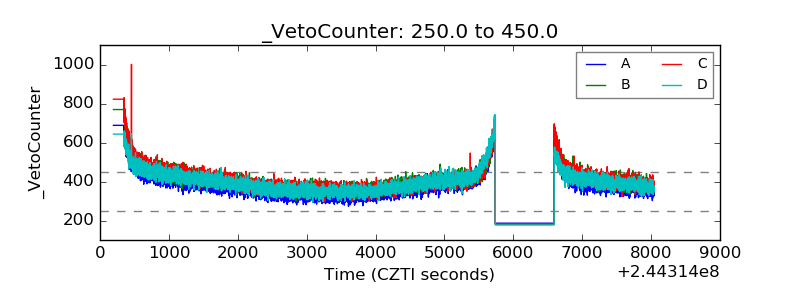 |