| Param | Original file | Final file |
|---|---|---|
| Filename | modeM0/AS1A03_086T01_9000001568_10831cztM0_level2.evt | modeM0/AS1A03_086T01_9000001568_10831cztM0_level2_quad_clean.evt |
| Size (bytes) | 578,240,640 | 101,456,640 |
| Size | 551.5 MB | 96.8 MB |
| Events in quadrant A | 4,973,734 | 645,453 |
| Events in quadrant B | 4,506,404 | 655,163 |
| Events in quadrant C | 3,268,811 | 663,134 |
| Events in quadrant D | 4,289,626 | 621,951 |
| Mode M9 | |||
|---|---|---|---|
| Quadrant | BADHDUFLAG | Total packets | Discarded packets |
| A | 0 | 1 | 0 |
| B | 0 | 1 | 0 |
| C | 0 | 1 | 0 |
| D | 0 | 1 | 0 |
| Mode SS | |||
|---|---|---|---|
| Quadrant | BADHDUFLAG | Total packets | Discarded packets |
| A | 0 | 142 | 0 |
| B | 0 | 142 | 0 |
| C | 0 | 142 | 0 |
| D | 0 | 142 | 0 |
| Mode M0 | |||
|---|---|---|---|
| Quadrant | BADHDUFLAG | Total packets | Discarded packets |
| A | 0 | 19506 | 2 |
| B | 0 | 17950 | 1 |
| C | 0 | 14454 | 1 |
| D | 0 | 17359 | 1 |
| Quadrant | Total seconds | Saturated seconds | Saturation percentage |
|---|---|---|---|
| A | 6989 | 317 | 4.535699% |
| B | 6989 | 346 | 4.950637% |
| C | 6989 | 47 | 0.672485% |
| D | 6989 | 100 | 1.430820% |
Noise dominated data is calculated using 1-second bins in cleaned event files. If a bin has >2000 counts, and if more than 50% of those come from <1% of pixels, then it is considered to be noise-dominated and hence unusable.
| Quadrant | # 1 sec bins | Bins with >0 counts | Bins with >2000 counts | High rate bins dominated by noise | Noise dominated (total time) | Noise dominated (detector-on time) | Marked lightcurve |
|---|---|---|---|---|---|---|---|
| A | 7159 | 6990 | 134 | 134 | 1.87% | 1.92% | 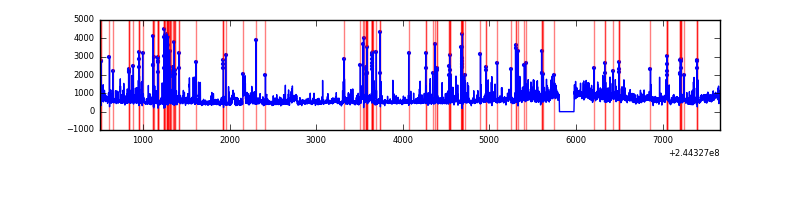 |
| B | 7159 | 6990 | 138 | 138 | 1.93% | 1.97% | 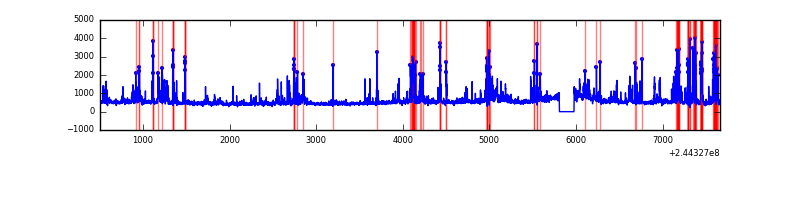 |
| C | 7159 | 6990 | 1 | 1 | 0.01% | 0.01% | 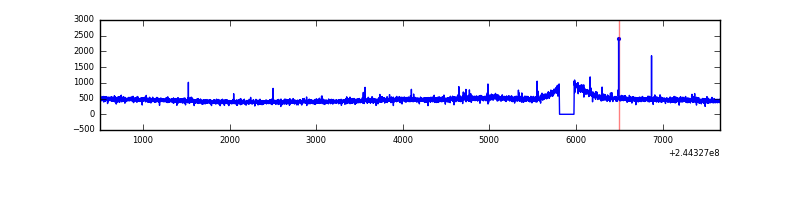 |
| D | 7159 | 6990 | 65 | 65 | 0.91% | 0.93% | 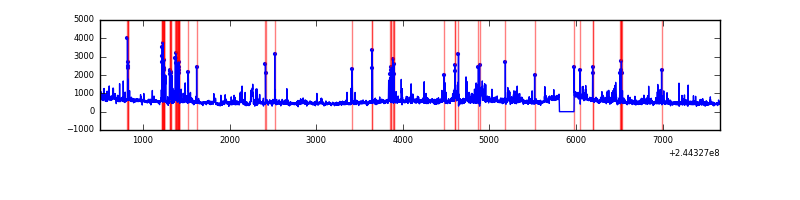 |
Top three noisy pixels from each quadrant. If the there are fewer than three noisy pixels in the level2.evt file, extra rows are filled as -1
| Pixel properties | Quadrant properties | ||||||
|---|---|---|---|---|---|---|---|
| Quadrant | DetID | PixID | Counts | Sigma | Mean | Median | Sigma |
| A | 8 | 5 | 1708576 | 9791.62 | 841 | 823 | 174.4 |
| A | 13 | 251 | 19565 | 107.46 | 841 | 823 | 174.4 |
| A | 13 | 248 | 7711 | 39.49 | 841 | 823 | 174.4 |
| B | 4 | 239 | 1046077 | 6432.9 | 845 | 829 | 162.5 |
| B | 0 | 214 | 47249 | 285.69 | 845 | 829 | 162.5 |
| B | 0 | 219 | 31010 | 185.75 | 845 | 829 | 162.5 |
| C | 5 | 128 | 8843 | 41.0 | 833 | 839 | 195.2 |
| C | 13 | 61 | 6199 | 27.45 | 833 | 839 | 195.2 |
| C | 14 | 234 | 5414 | 23.43 | 833 | 839 | 195.2 |
| D | 8 | 195 | 452887 | 2249.24 | 822 | 799 | 201.0 |
| D | 12 | 233 | 215488 | 1068.13 | 822 | 799 | 201.0 |
| D | 1 | 52 | 142149 | 703.25 | 822 | 799 | 201.0 |
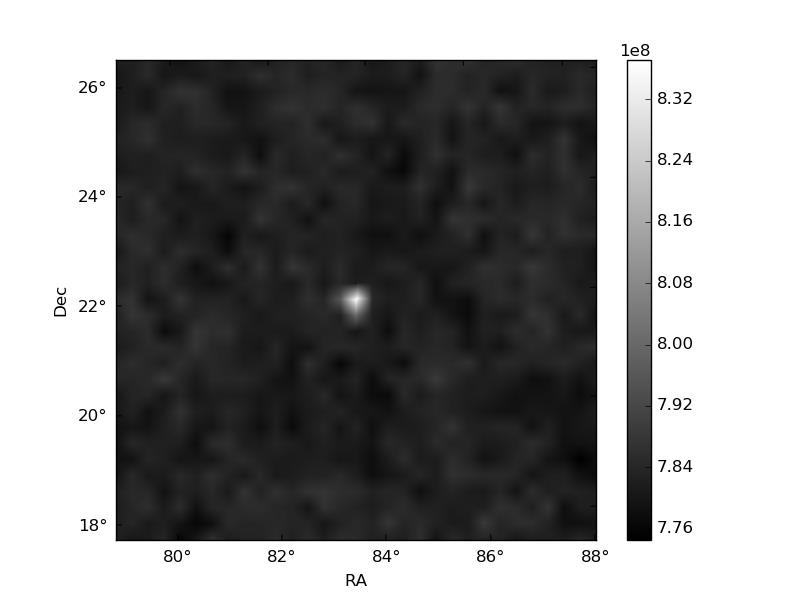
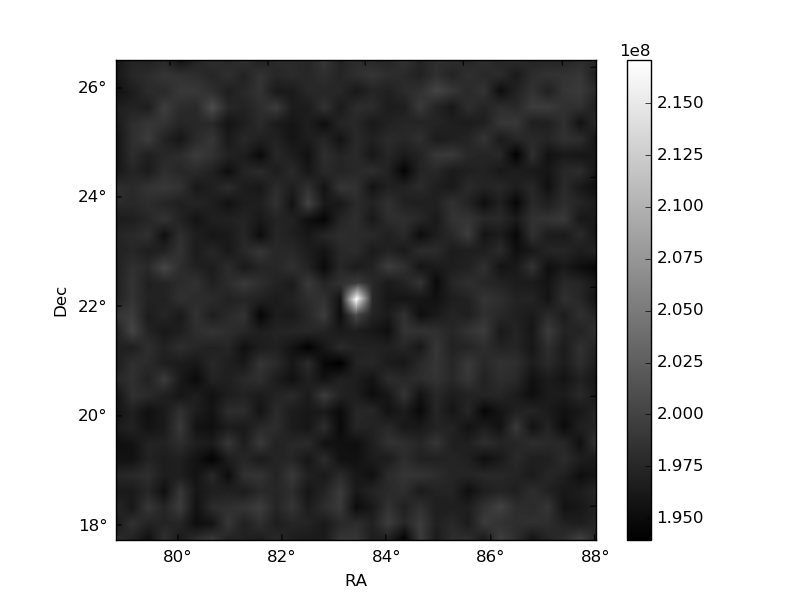
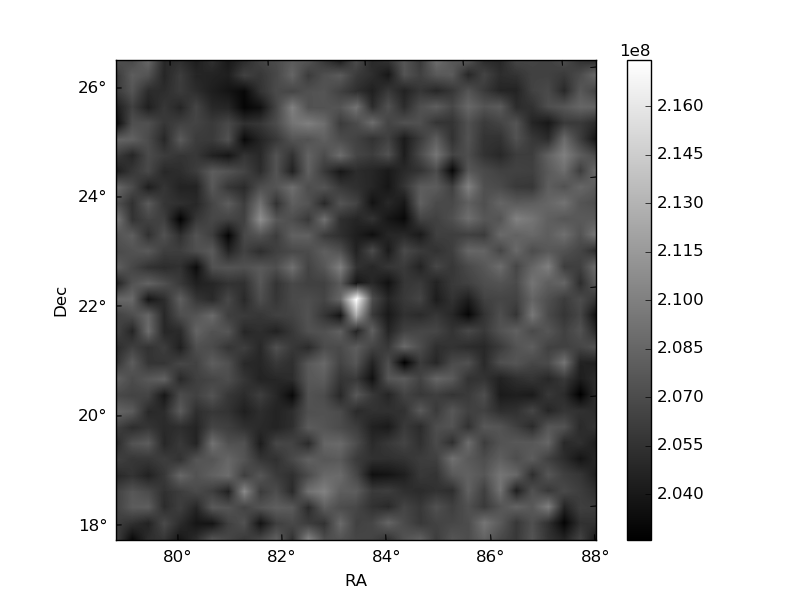
Histogram calculated using DETX and DETY for each event in the final _common_clean file
| Quadrant A | 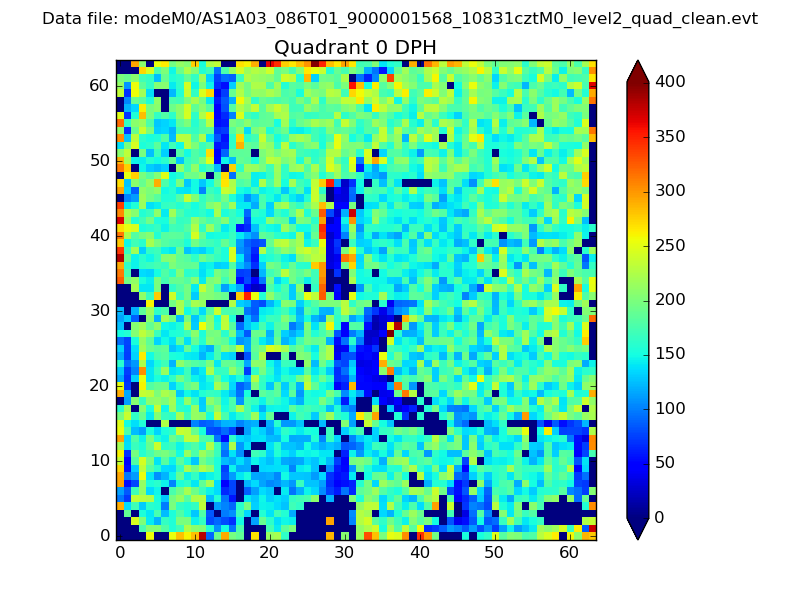 |
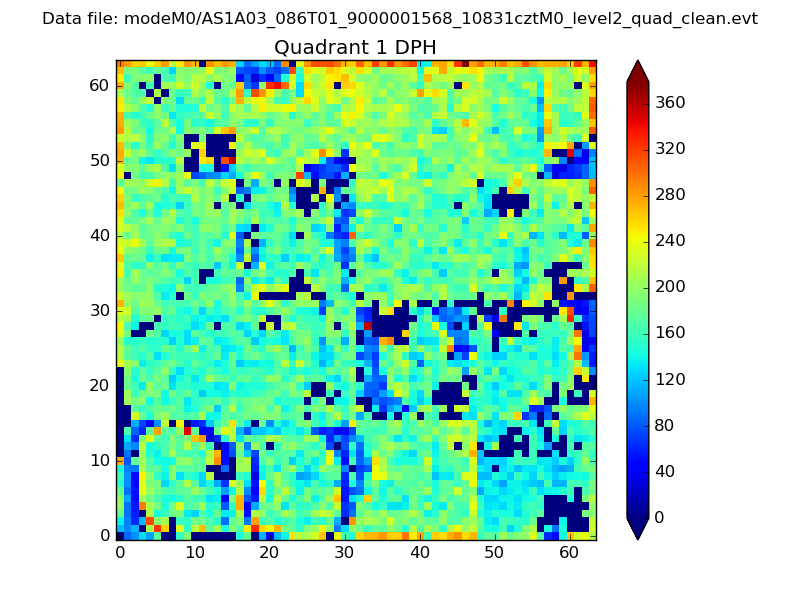 |
Quadrant B |
|---|---|---|---|
| Quadrant D | 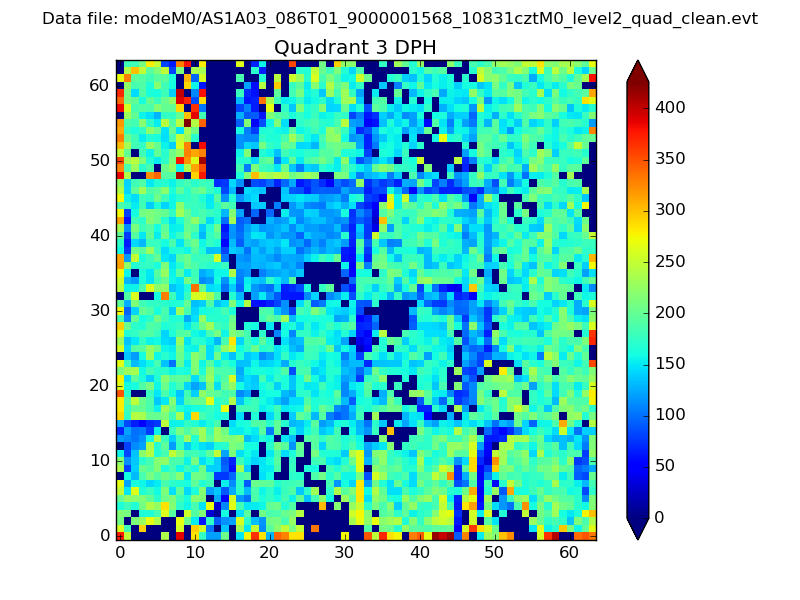 |
 |
Quadrant C |
| Plot type | Count rate plots | Images |
|---|---|---|
| Comparison with Poisson distribution Blue bars denote a histogram of data divided into 1 sec bins. Red curve is a Poisson curve with rate = median count rate of data. |
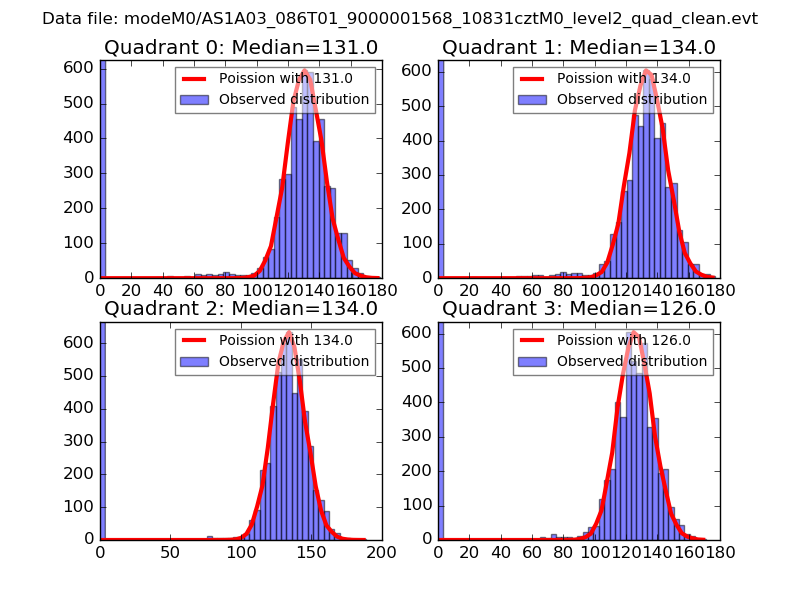 |
 |
| Quadrant-wise count rates Data is divided into 100 sec bins |
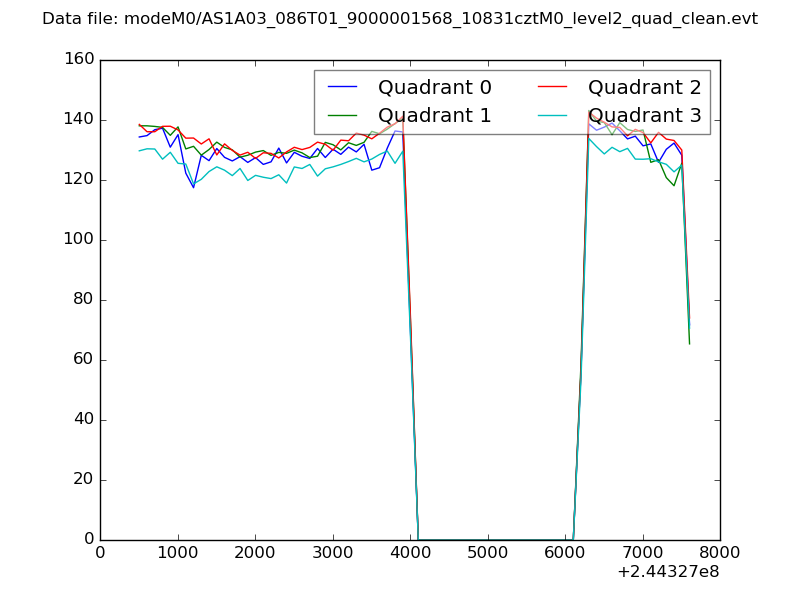 |
|
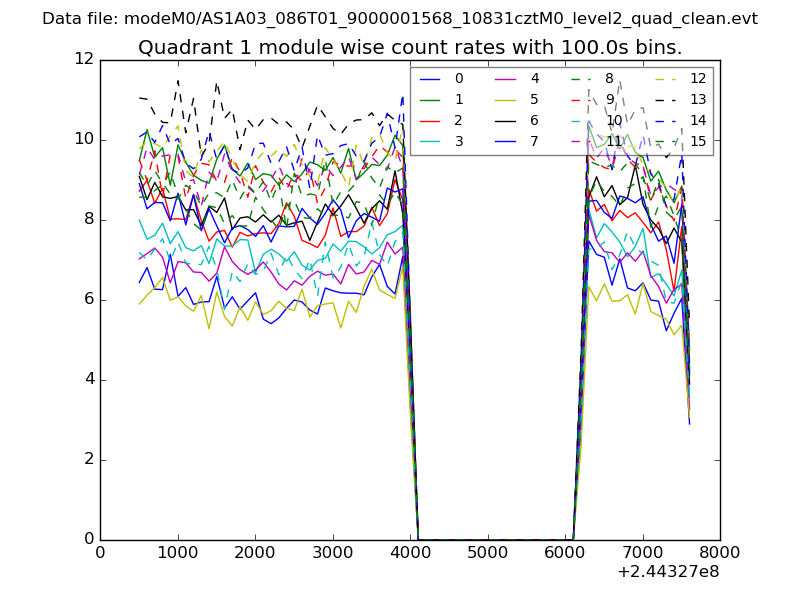
| Module-wise count rates for Quadrant A Data is divided into 100 sec bins |
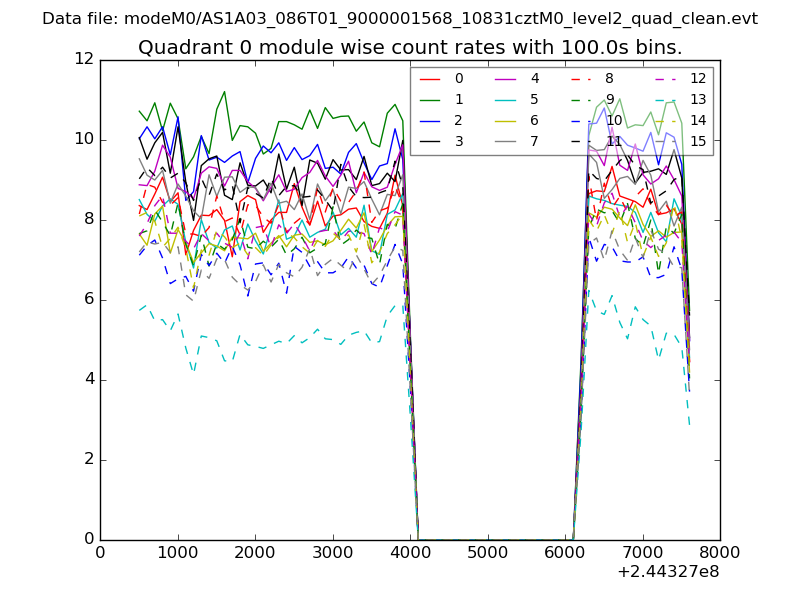 |
 |
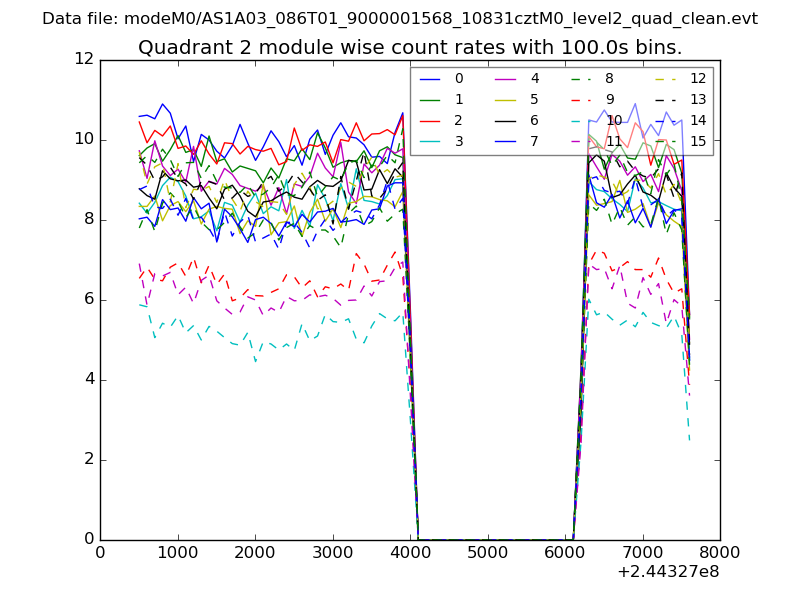
| Module-wise count rates for Quadrant B Data is divided into 100 sec bins |
 |
 |
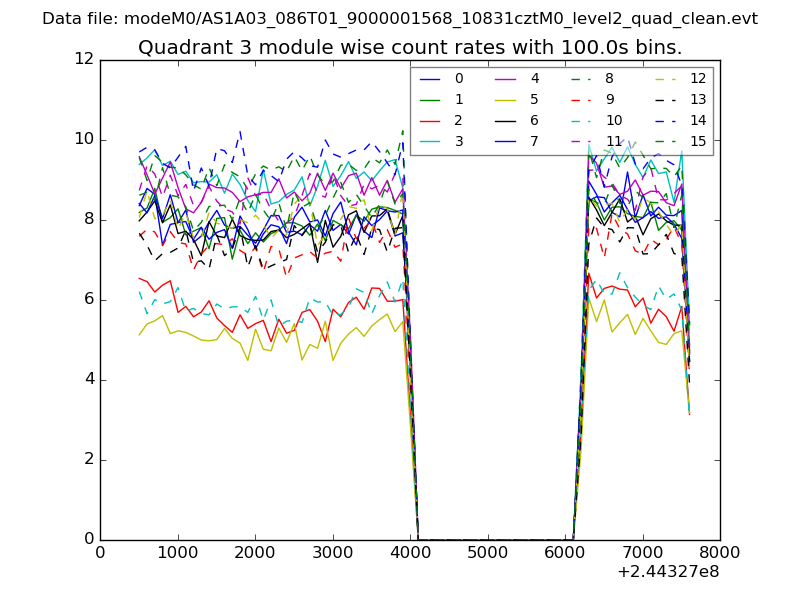
| Module-wise count rates for Quadrant C Data is divided into 100 sec bins |
 |
 |
| Module-wise count rates for Quadrant D Data is divided into 100 sec bins |
 |
 |
| Parameter | Plot |
|---|---|
| CZT HV Monitor | 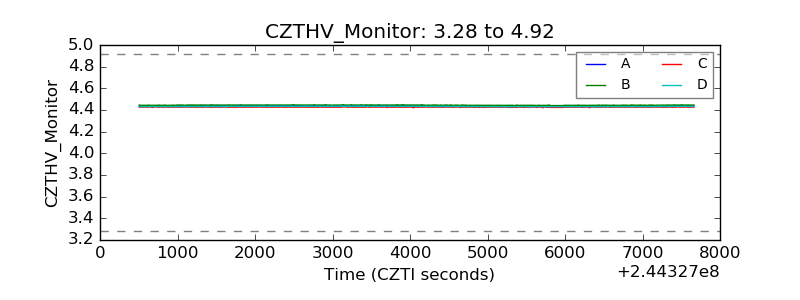 |
| D_VDD | 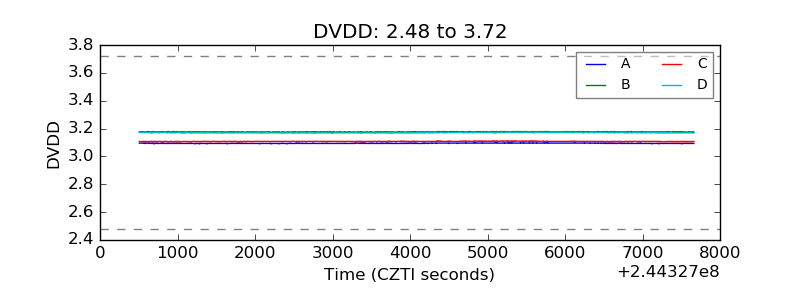 |
| Temperature 1 |  |
| Veto HV Monitor | 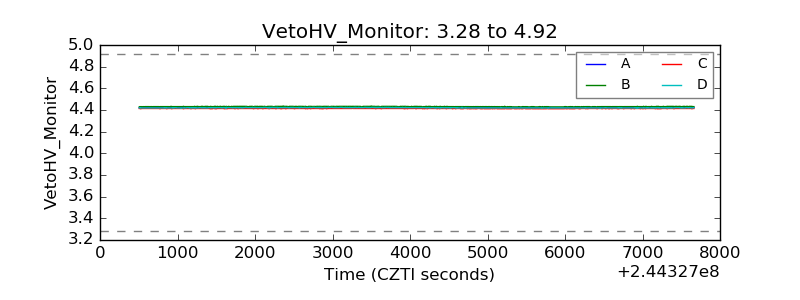 |
| Veto LLD | 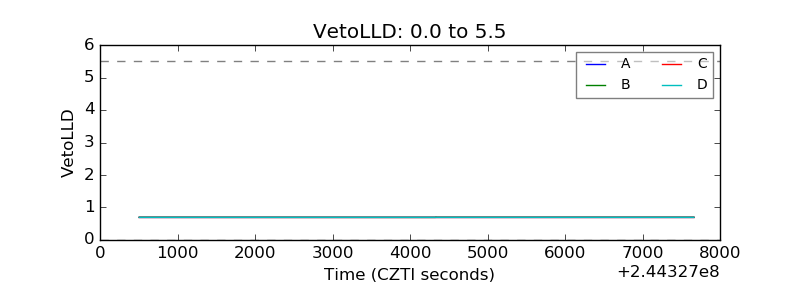 |
| Alpha Counter | 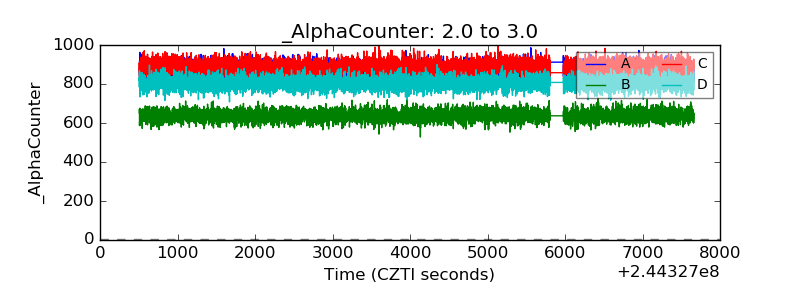 |
| _CPM_Rate | 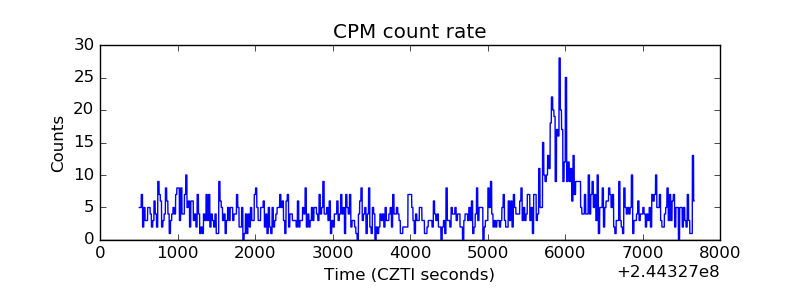 |
| CZT Counter |  |
| +2.5 Volts monitor | 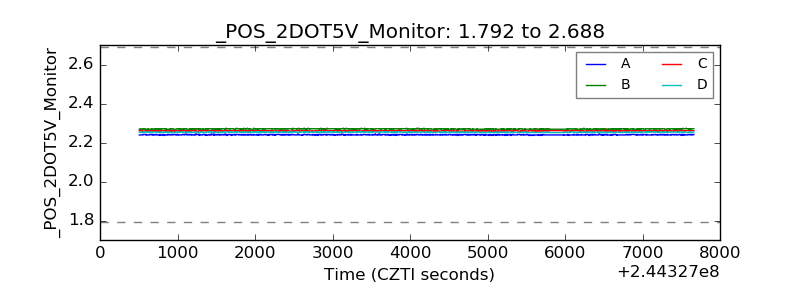 |
| +5 Volts monitor |  |
| _ROLL_ROT | 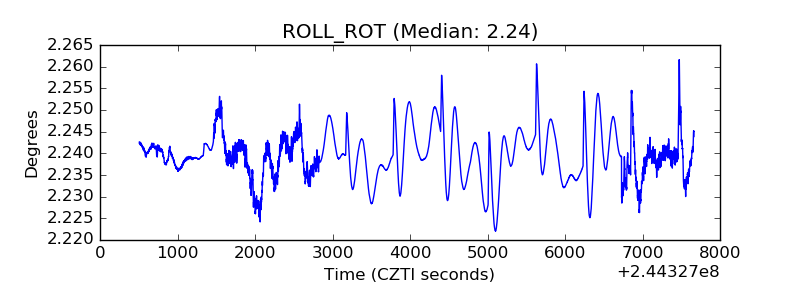 |
| _Roll_DEC | 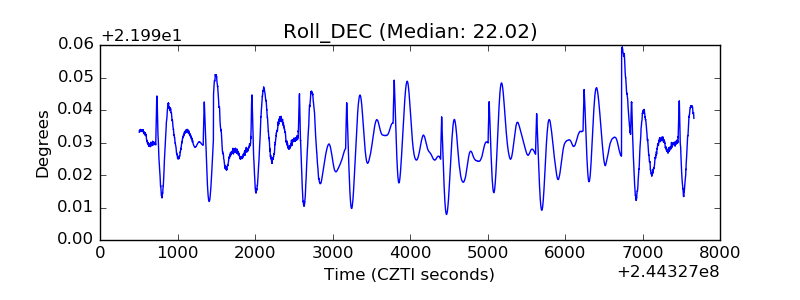 |
| _Roll_RA |  |
| Veto Counter | 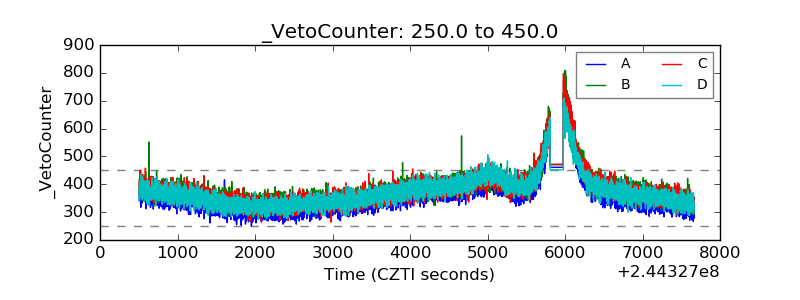 |