| Param | Original file | Final file |
|---|---|---|
| Filename | modeM0/AS1A03_086T01_9000001568_10832cztM0_level2.evt | modeM0/AS1A03_086T01_9000001568_10832cztM0_level2_quad_clean.evt |
| Size (bytes) | 603,665,280 | 107,570,880 |
| Size | 575.7 MB | 102.6 MB |
| Events in quadrant A | 5,525,695 | 679,968 |
| Events in quadrant B | 4,739,760 | 691,843 |
| Events in quadrant C | 3,520,701 | 698,498 |
| Events in quadrant D | 3,980,997 | 658,917 |
| Mode M9 | |||
|---|---|---|---|
| Quadrant | BADHDUFLAG | Total packets | Discarded packets |
| A | 0 | 3 | 0 |
| B | 0 | 3 | 0 |
| C | 0 | 3 | 0 |
| D | 0 | 3 | 0 |
| Mode SS | |||
|---|---|---|---|
| Quadrant | BADHDUFLAG | Total packets | Discarded packets |
| A | 0 | 156 | 0 |
| B | 0 | 156 | 0 |
| C | 0 | 156 | 0 |
| D | 0 | 156 | 2 |
| Mode M0 | |||
|---|---|---|---|
| Quadrant | BADHDUFLAG | Total packets | Discarded packets |
| A | 0 | 21668 | 37 |
| B | 0 | 19129 | 31 |
| C | 0 | 15691 | 13 |
| D | 0 | 17194 | 14 |
| Quadrant | Total seconds | Saturated seconds | Saturation percentage |
|---|---|---|---|
| A | 7589 | 467 | 6.153643% |
| B | 7589 | 329 | 4.335222% |
| C | 7594 | 27 | 0.355544% |
| D | 7594 | 87 | 1.145641% |
Noise dominated data is calculated using 1-second bins in cleaned event files. If a bin has >2000 counts, and if more than 50% of those come from <1% of pixels, then it is considered to be noise-dominated and hence unusable.
| Quadrant | # 1 sec bins | Bins with >0 counts | Bins with >2000 counts | High rate bins dominated by noise | Noise dominated (total time) | Noise dominated (detector-on time) | Marked lightcurve |
|---|---|---|---|---|---|---|---|
| A | 7974 | 7600 | 310 | 310 | 3.89% | 4.08% | 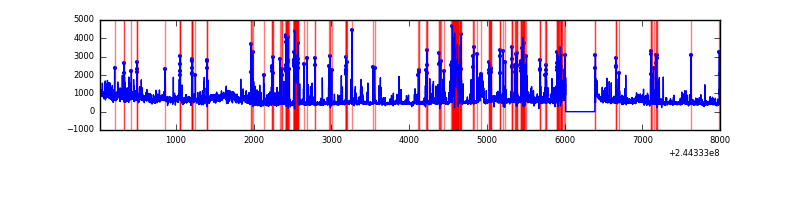 |
| B | 7975 | 7601 | 139 | 139 | 1.74% | 1.83% | 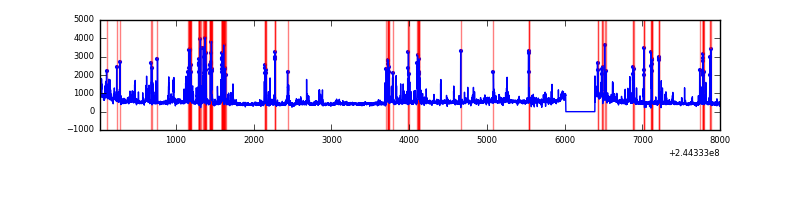 |
| C | 7975 | 7601 | 3 | 3 | 0.04% | 0.04% | 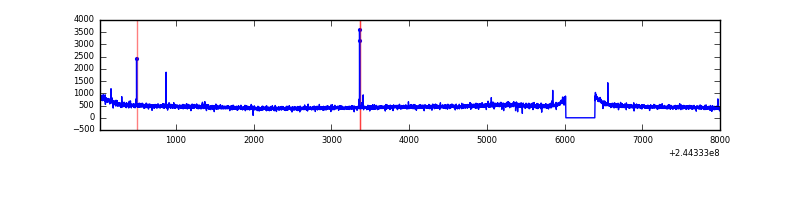 |
| D | 7975 | 7601 | 39 | 39 | 0.49% | 0.51% | 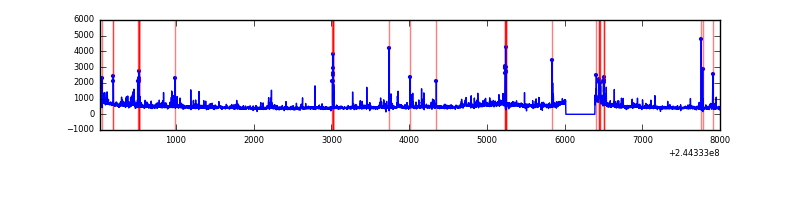 |
Top three noisy pixels from each quadrant. If the there are fewer than three noisy pixels in the level2.evt file, extra rows are filled as -1
| Pixel properties | Quadrant properties | ||||||
|---|---|---|---|---|---|---|---|
| Quadrant | DetID | PixID | Counts | Sigma | Mean | Median | Sigma |
| A | 8 | 5 | 2061854 | 11215.34 | 890 | 871 | 183.8 |
| A | 13 | 251 | 13721 | 69.93 | 890 | 871 | 183.8 |
| A | 11 | 29 | 10587 | 52.87 | 890 | 871 | 183.8 |
| B | 4 | 239 | 989896 | 5650.47 | 913 | 894 | 175.0 |
| B | 0 | 214 | 83778 | 473.54 | 913 | 894 | 175.0 |
| B | 4 | 173 | 34345 | 191.12 | 913 | 894 | 175.0 |
| C | 5 | 128 | 12570 | 55.61 | 896 | 904 | 209.8 |
| C | 14 | 234 | 8077 | 34.19 | 896 | 904 | 209.8 |
| C | 13 | 61 | 6589 | 27.1 | 896 | 904 | 209.8 |
| D | 1 | 52 | 164824 | 761.86 | 885 | 861 | 215.2 |
| D | 13 | 104 | 111807 | 515.51 | 885 | 861 | 215.2 |
| D | 8 | 195 | 84863 | 390.32 | 885 | 861 | 215.2 |
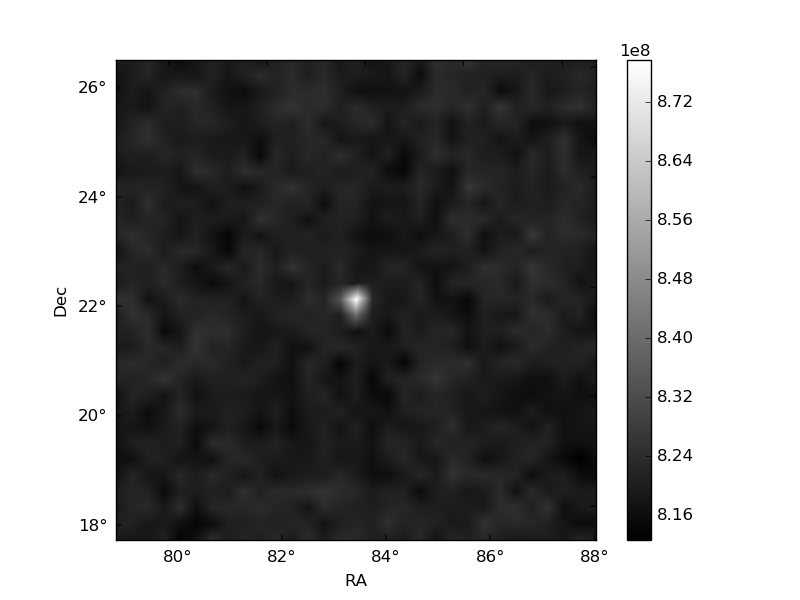
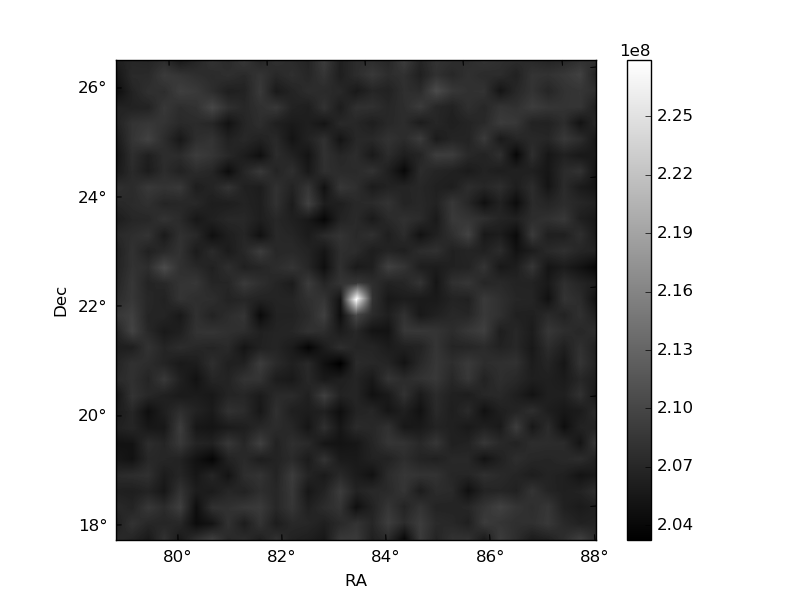
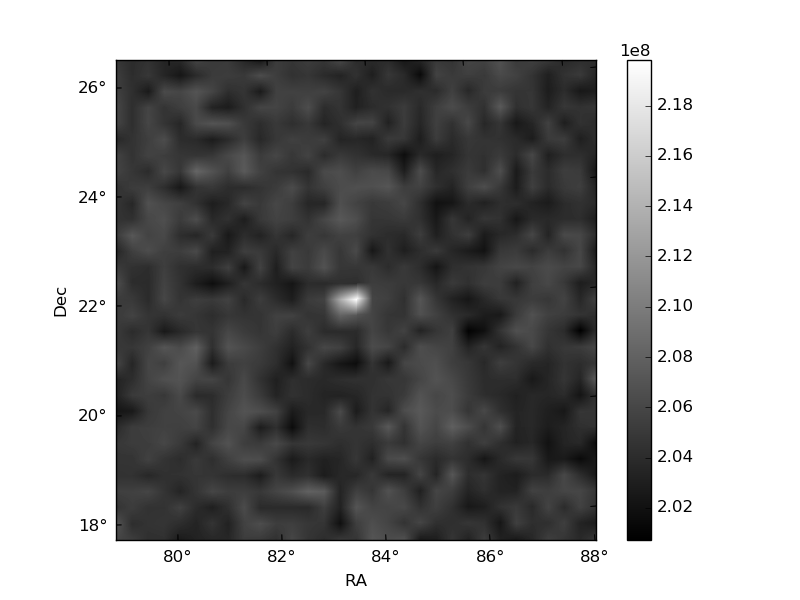
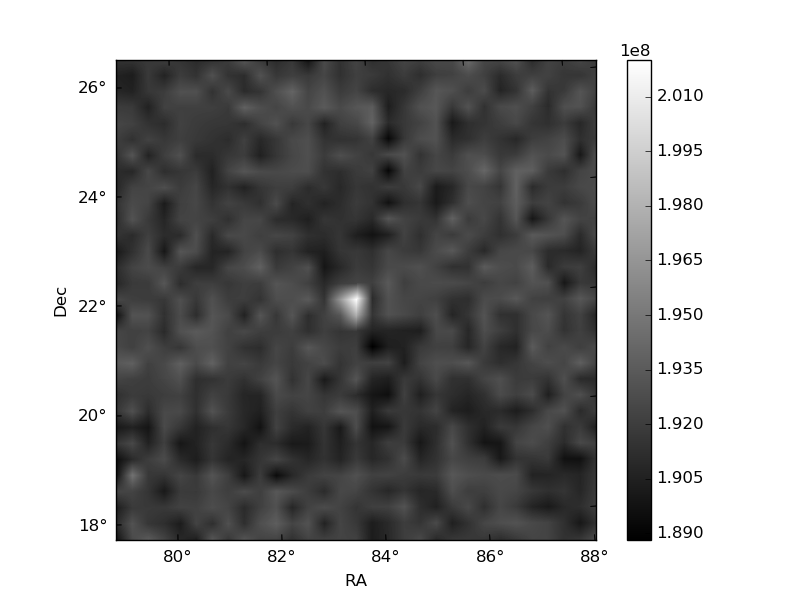
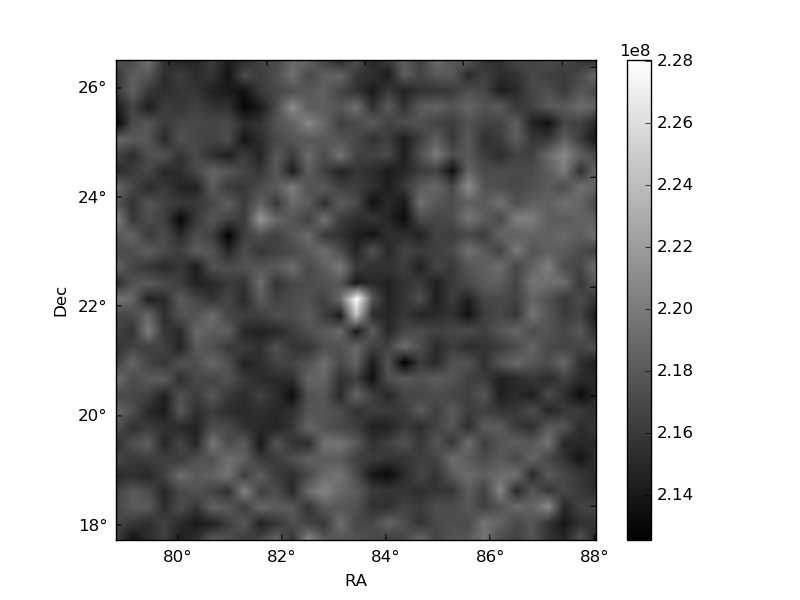
Histogram calculated using DETX and DETY for each event in the final _common_clean file
| Quadrant A | 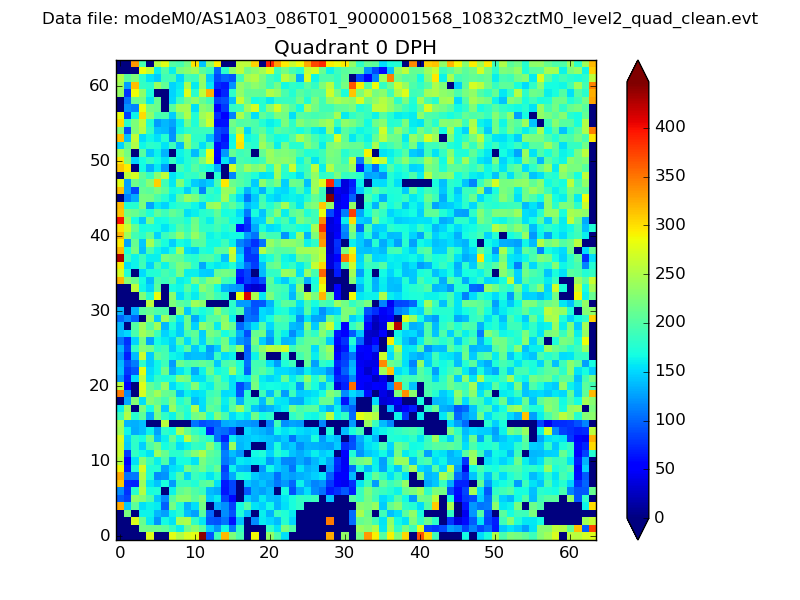 |
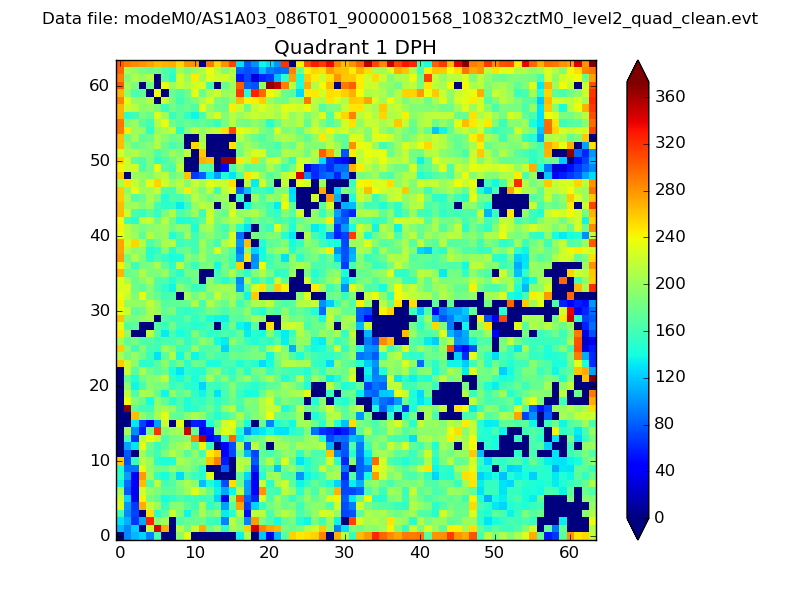 |
Quadrant B |
|---|---|---|---|
| Quadrant D | 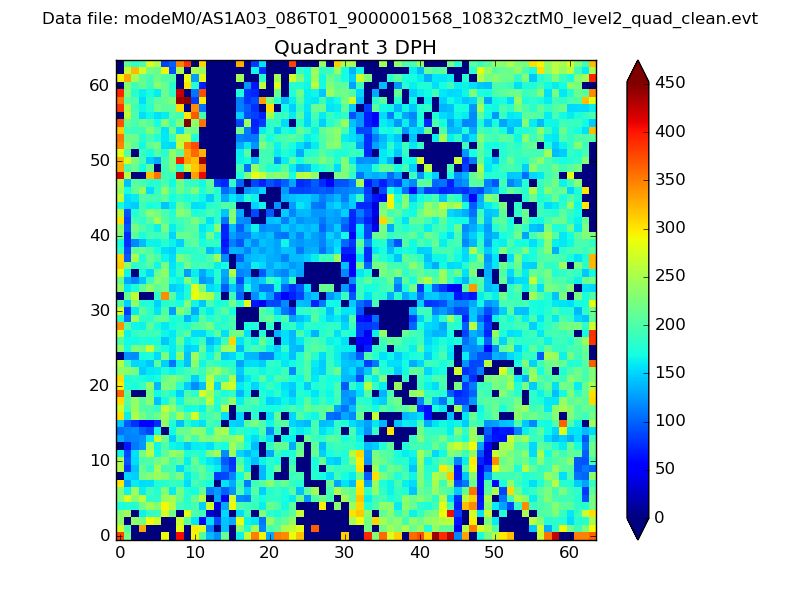 |
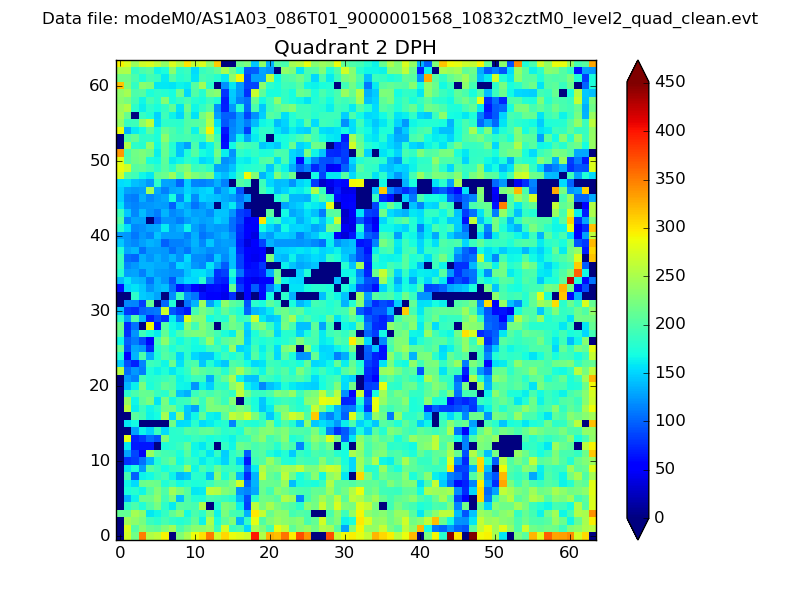 |
Quadrant C |
| Plot type | Count rate plots | Images |
|---|---|---|
| Comparison with Poisson distribution Blue bars denote a histogram of data divided into 1 sec bins. Red curve is a Poisson curve with rate = median count rate of data. |
 |
 |
| Quadrant-wise count rates Data is divided into 100 sec bins |
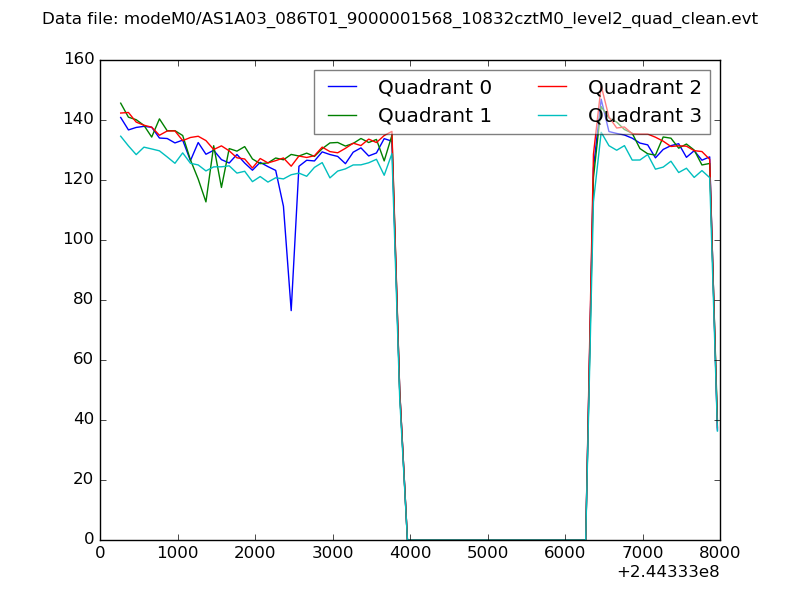 |
|
| Module-wise count rates for Quadrant A Data is divided into 100 sec bins |
 |
 |
| Module-wise count rates for Quadrant B Data is divided into 100 sec bins |
 |
 |
| Module-wise count rates for Quadrant C Data is divided into 100 sec bins |
 |
 |
| Module-wise count rates for Quadrant D Data is divided into 100 sec bins |
 |
 |
| Parameter | Plot |
|---|---|
| CZT HV Monitor |  |
| D_VDD | 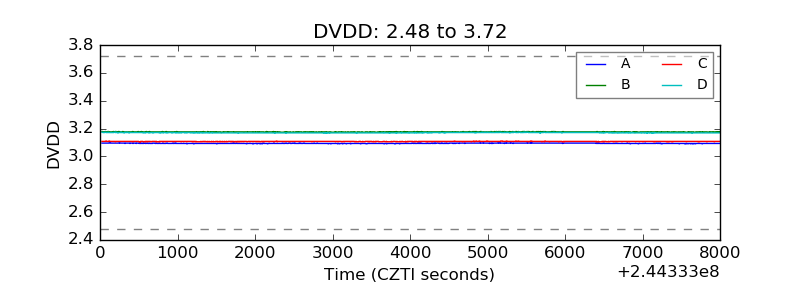 |
| Temperature 1 | 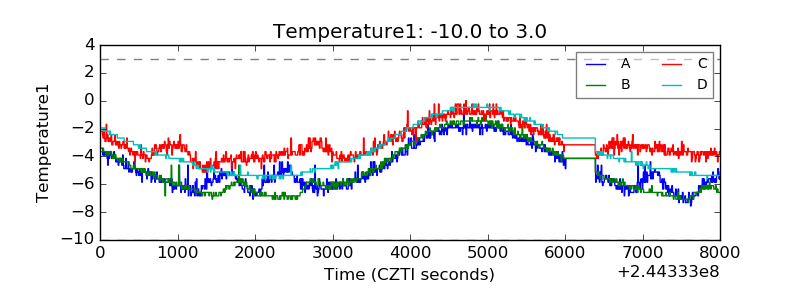 |
| Veto HV Monitor | 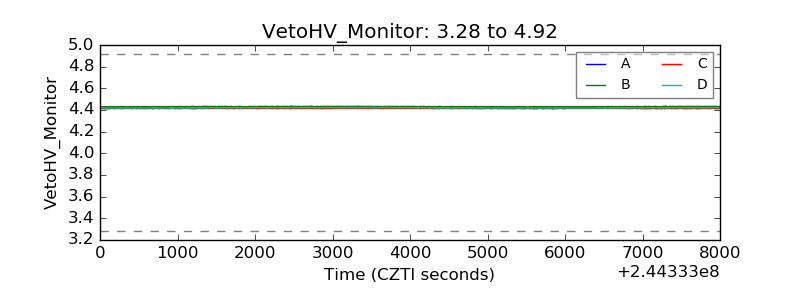 |
| Veto LLD | 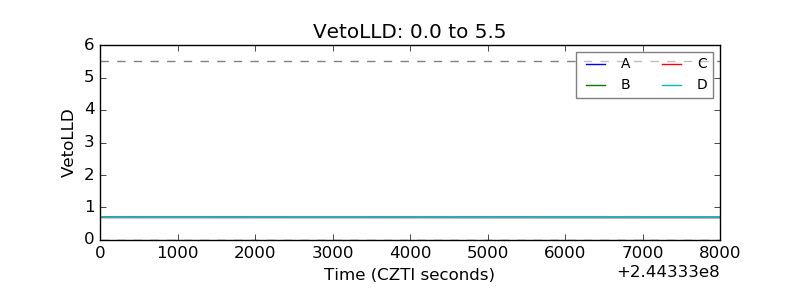 |
| Alpha Counter | 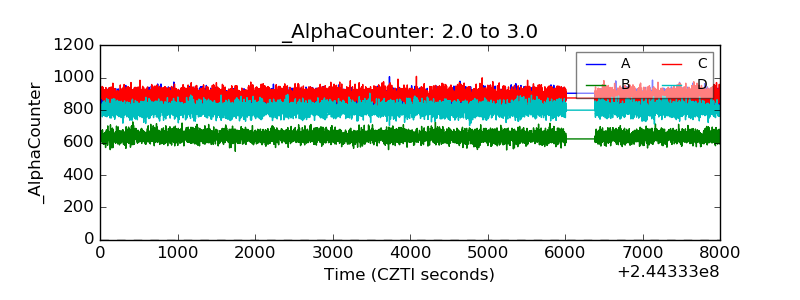 |
| _CPM_Rate |  |
| CZT Counter | 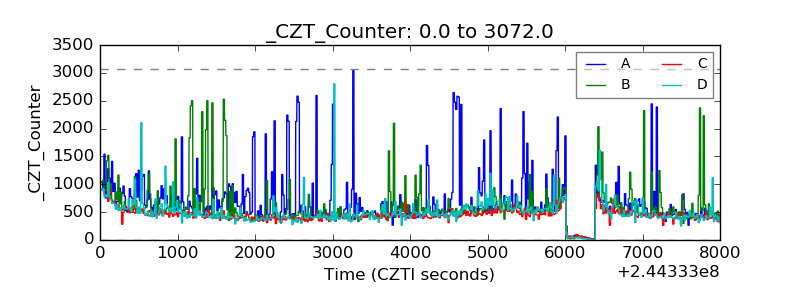 |
| +2.5 Volts monitor |  |
| +5 Volts monitor | 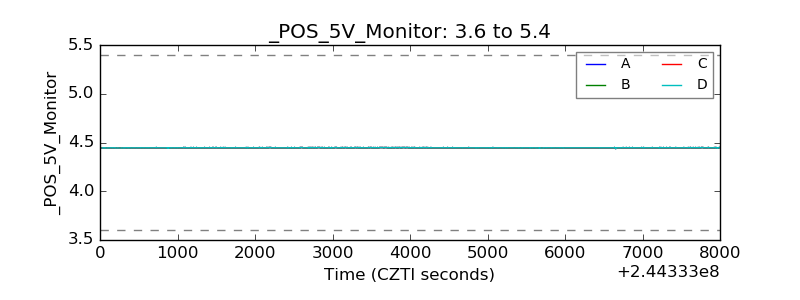 |
| _ROLL_ROT |  |
| _Roll_DEC |  |
| _Roll_RA | 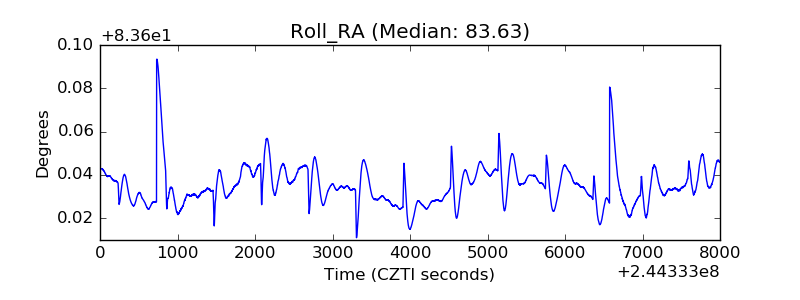 |
| Veto Counter |  |