| Param | Original file | Final file |
|---|---|---|
| Filename | modeM0/AS1A03_086T01_9000001568_10836cztM0_level2.evt | modeM0/AS1A03_086T01_9000001568_10836cztM0_level2_quad_clean.evt |
| Size (bytes) | 1,795,619,520 | 293,402,880 |
| Size | 1.7 GB | 279.8 MB |
| Events in quadrant A | 16,827,168 | 1,818,191 |
| Events in quadrant B | 13,515,784 | 1,861,513 |
| Events in quadrant C | 10,192,383 | 1,877,546 |
| Events in quadrant D | 12,326,178 | 1,778,953 |
| Mode M9 | |||
|---|---|---|---|
| Quadrant | BADHDUFLAG | Total packets | Discarded packets |
| A | 0 | 30 | 0 |
| B | 0 | 30 | 0 |
| C | 0 | 30 | 0 |
| D | 0 | 30 | 0 |
| Mode SS | |||
|---|---|---|---|
| Quadrant | BADHDUFLAG | Total packets | Discarded packets |
| A | 0 | 456 | 0 |
| B | 0 | 456 | 0 |
| C | 0 | 456 | 0 |
| D | 0 | 456 | 0 |
| Mode M0 | |||
|---|---|---|---|
| Quadrant | BADHDUFLAG | Total packets | Discarded packets |
| A | 0 | 65082 | 5 |
| B | 0 | 54656 | 4 |
| C | 0 | 45927 | 4 |
| D | 0 | 52038 | 4 |
| Quadrant | Total seconds | Saturated seconds | Saturation percentage |
|---|---|---|---|
| A | 22527 | 1459 | 6.476672% |
| B | 22527 | 723 | 3.209482% |
| C | 22527 | 89 | 0.395081% |
| D | 22527 | 481 | 2.135216% |
Noise dominated data is calculated using 1-second bins in cleaned event files. If a bin has >2000 counts, and if more than 50% of those come from <1% of pixels, then it is considered to be noise-dominated and hence unusable.
| Quadrant | # 1 sec bins | Bins with >0 counts | Bins with >2000 counts | High rate bins dominated by noise | Noise dominated (total time) | Noise dominated (detector-on time) | Marked lightcurve |
|---|---|---|---|---|---|---|---|
| A | 25452 | 22531 | 963 | 963 | 3.78% | 4.27% | 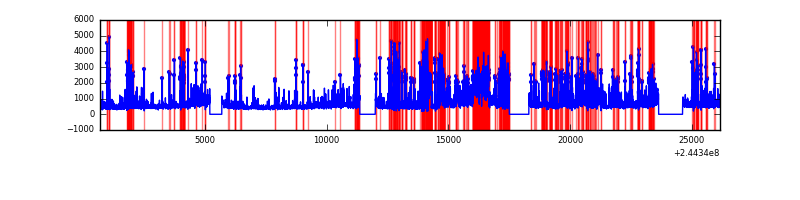 |
| B | 25452 | 22531 | 341 | 341 | 1.34% | 1.51% | 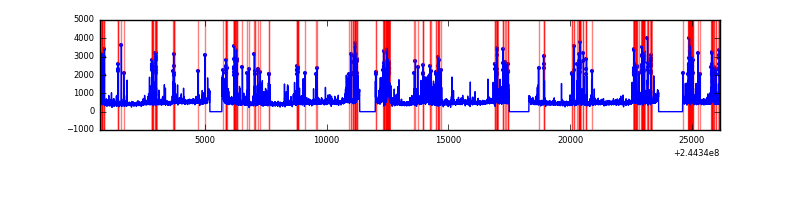 |
| C | 25452 | 22531 | 6 | 6 | 0.02% | 0.03% | 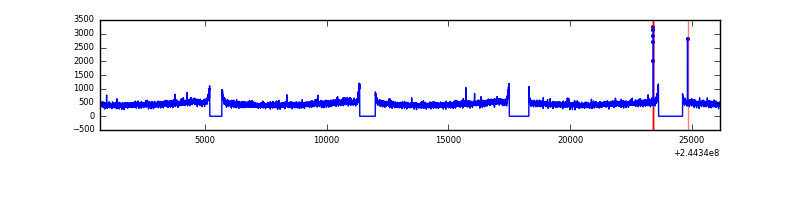 |
| D | 25452 | 22531 | 300 | 300 | 1.18% | 1.33% | 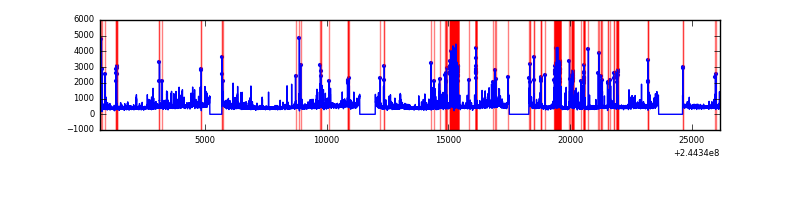 |
Top three noisy pixels from each quadrant. If the there are fewer than three noisy pixels in the level2.evt file, extra rows are filled as -1
| Pixel properties | Quadrant properties | ||||||
|---|---|---|---|---|---|---|---|
| Quadrant | DetID | PixID | Counts | Sigma | Mean | Median | Sigma |
| A | 8 | 5 | 4853779 | 9018.88 | 2640 | 2591 | 537.9 |
| A | 8 | 15 | 1651664 | 3065.8 | 2640 | 2591 | 537.9 |
| A | 0 | 254 | 54284 | 96.1 | 2640 | 2591 | 537.9 |
| B | 4 | 239 | 2515496 | 4973.67 | 2671 | 2615 | 505.2 |
| B | 0 | 214 | 226898 | 443.92 | 2671 | 2615 | 505.2 |
| B | 0 | 85 | 102575 | 197.85 | 2671 | 2615 | 505.2 |
| C | 13 | 61 | 19321 | 27.65 | 2605 | 2630 | 603.7 |
| C | 15 | 127 | 16800 | 23.47 | 2605 | 2630 | 603.7 |
| C | 14 | 67 | 15496 | 21.31 | 2605 | 2630 | 603.7 |
| D | 12 | 233 | 920544 | 1473.29 | 2581 | 2515 | 623.1 |
| D | 1 | 52 | 436556 | 696.56 | 2581 | 2515 | 623.1 |
| D | 9 | 85 | 212851 | 337.55 | 2581 | 2515 | 623.1 |
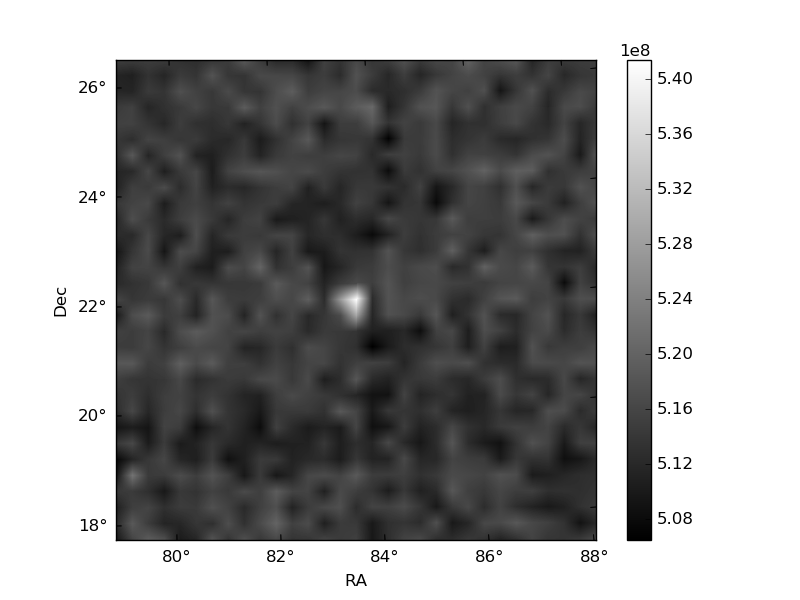
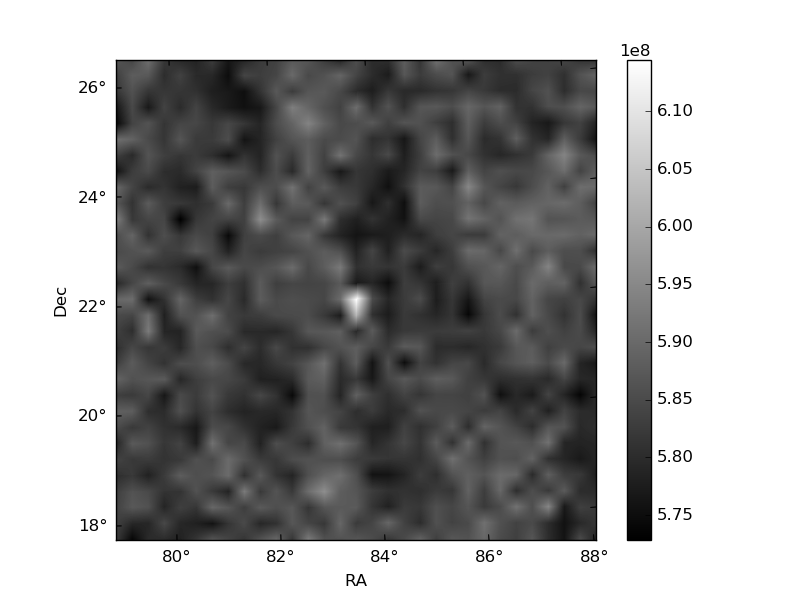
Histogram calculated using DETX and DETY for each event in the final _common_clean file
| Quadrant A |  |
 |
Quadrant B |
|---|---|---|---|
| Quadrant D |  |
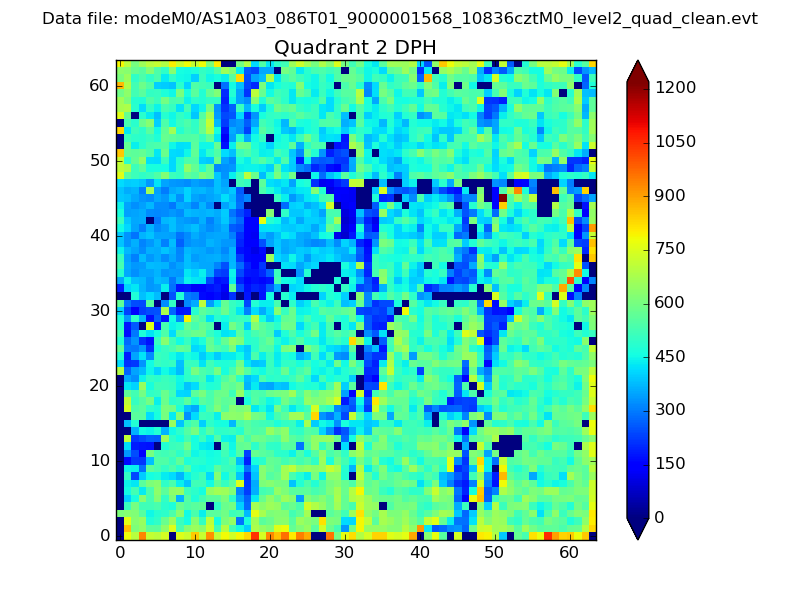 |
Quadrant C |
| Plot type | Count rate plots | Images |
|---|---|---|
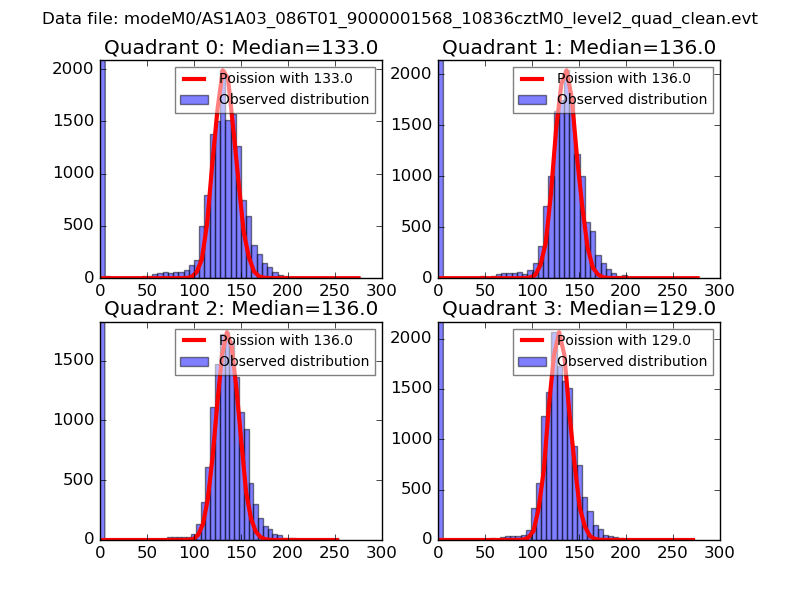
| Comparison with Poisson distribution Blue bars denote a histogram of data divided into 1 sec bins. Red curve is a Poisson curve with rate = median count rate of data. |
 |
 |
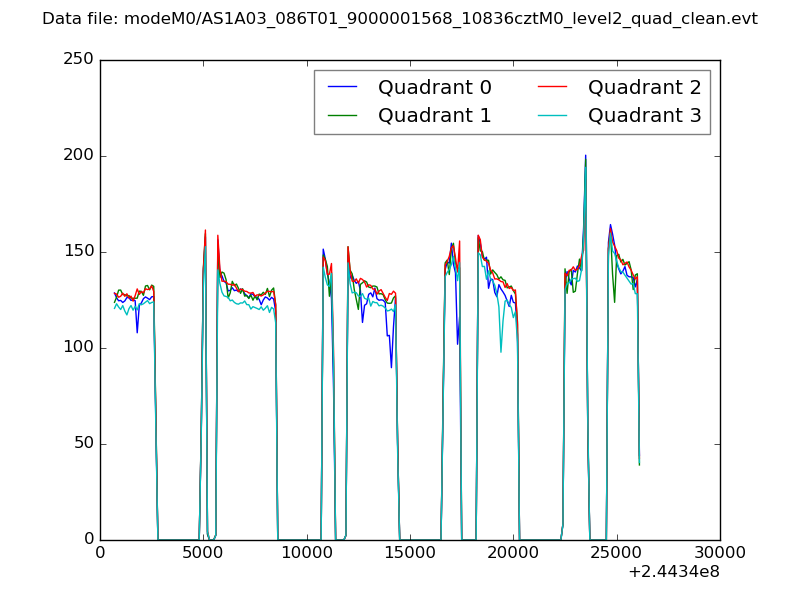
| Quadrant-wise count rates Data is divided into 100 sec bins |
 |
|
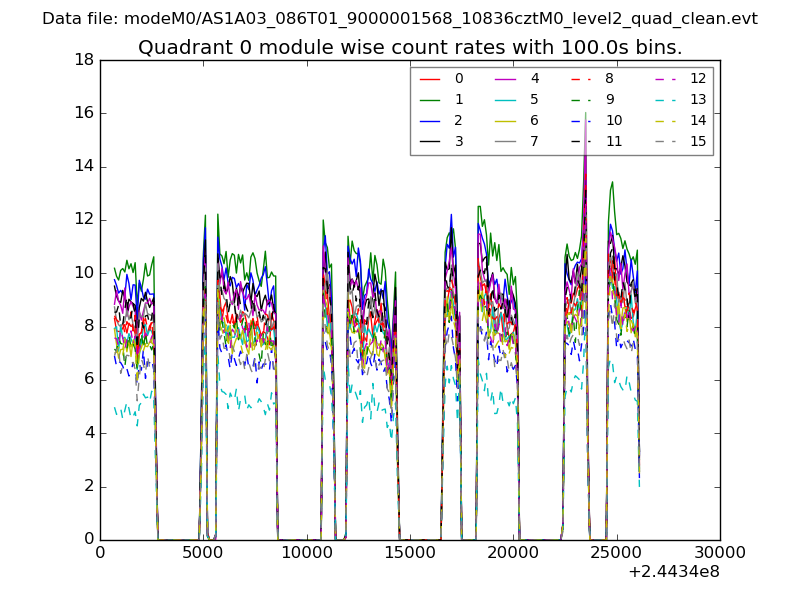
| Module-wise count rates for Quadrant A Data is divided into 100 sec bins |
 |
 |
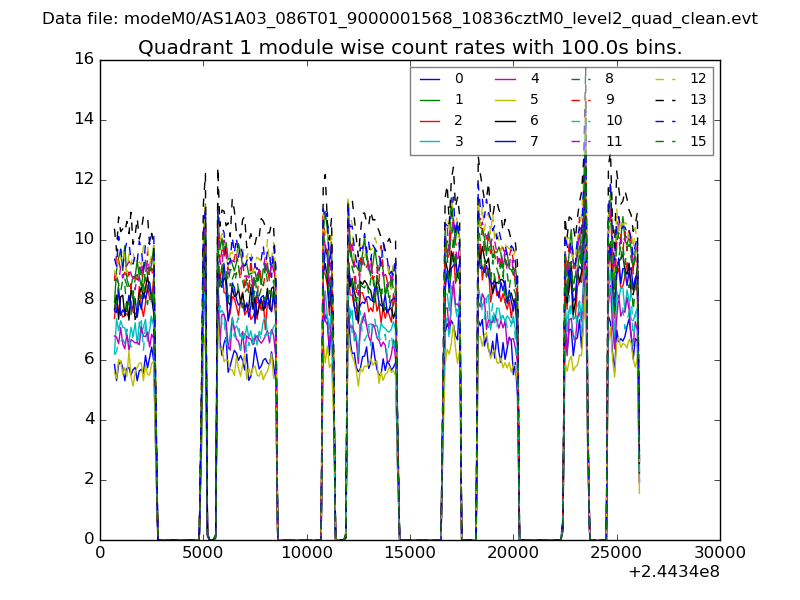
| Module-wise count rates for Quadrant B Data is divided into 100 sec bins |
 |
 |
| Module-wise count rates for Quadrant C Data is divided into 100 sec bins |
 |
 |
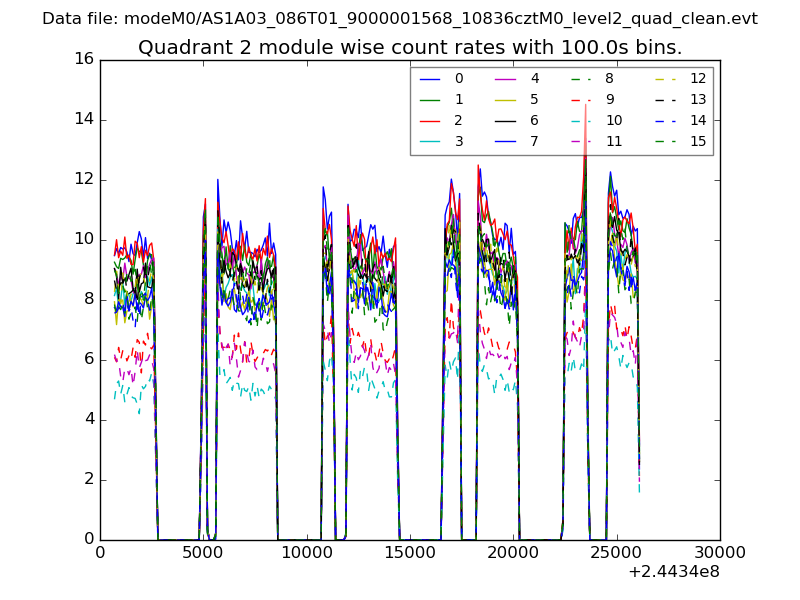
| Module-wise count rates for Quadrant D Data is divided into 100 sec bins |
 |
 |
| Parameter | Plot |
|---|---|
| CZT HV Monitor | 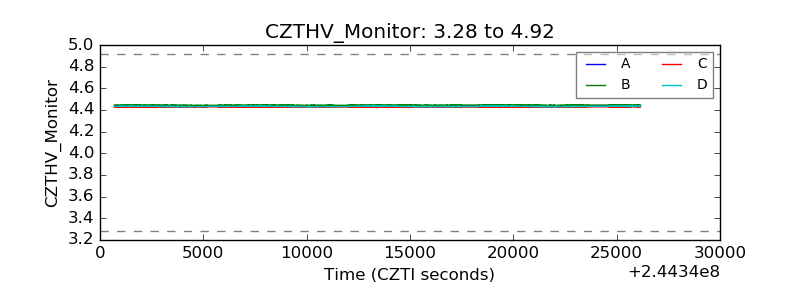 |
| D_VDD | 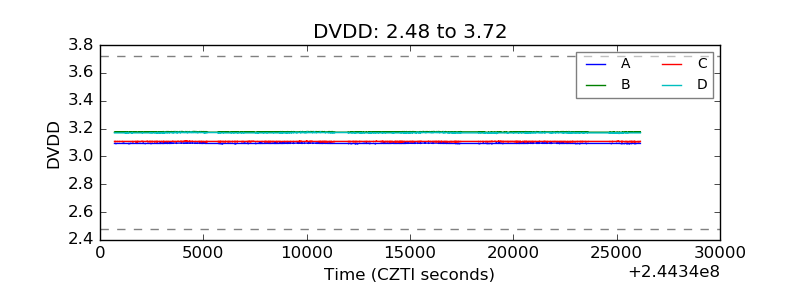 |
| Temperature 1 | 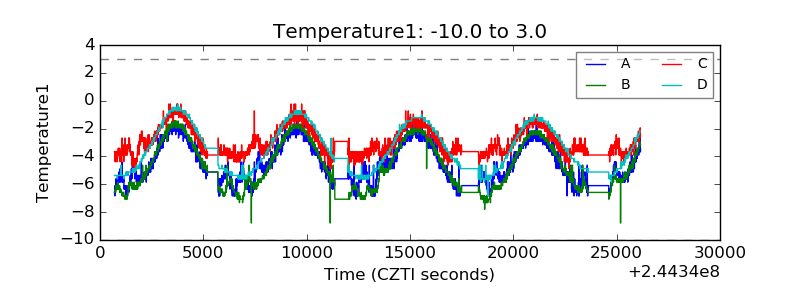 |
| Veto HV Monitor | 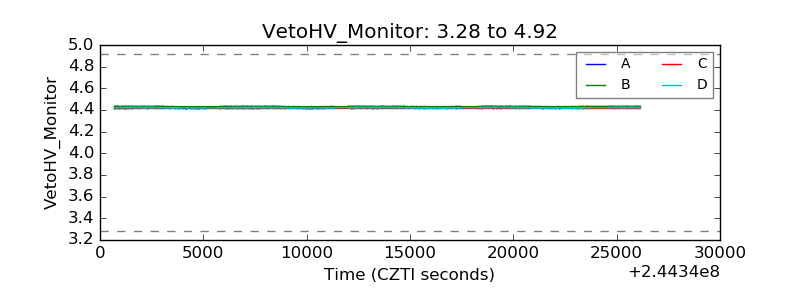 |
| Veto LLD | 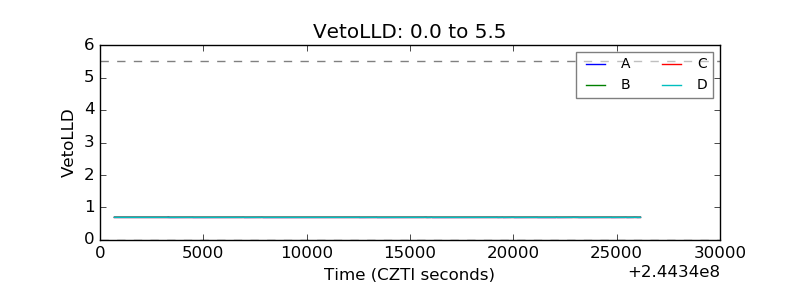 |
| Alpha Counter | 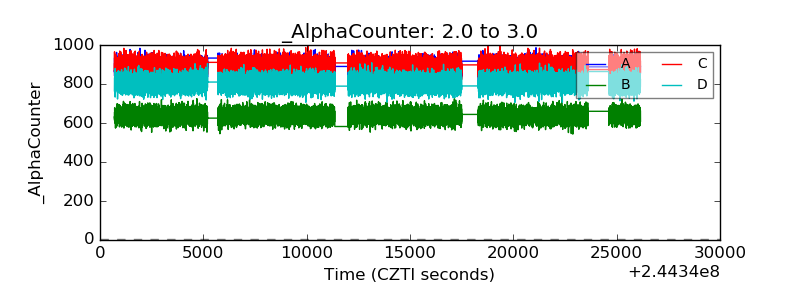 |
| _CPM_Rate | 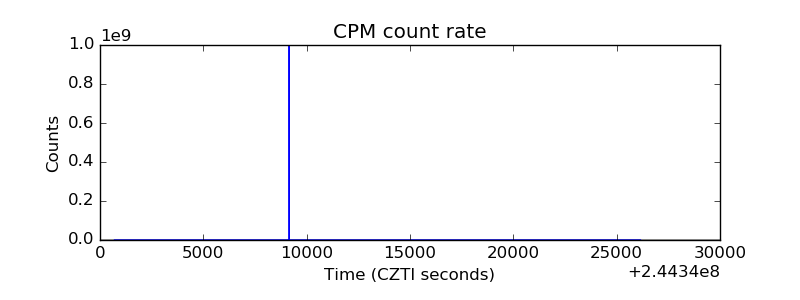 |
| CZT Counter | 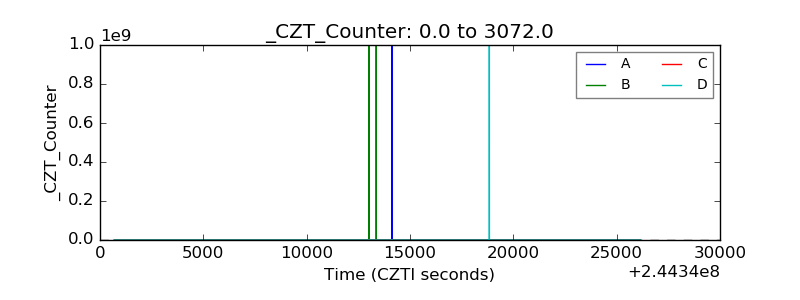 |
| +2.5 Volts monitor | 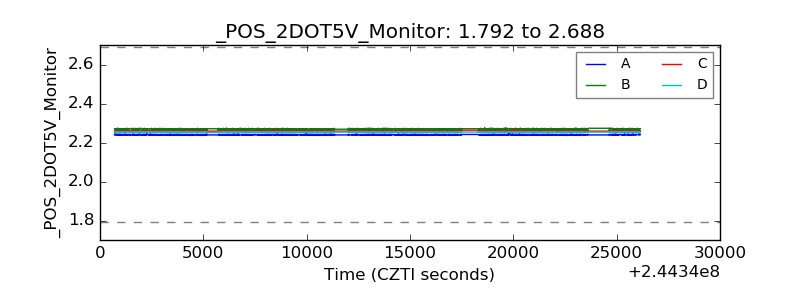 |
| +5 Volts monitor |  |
| _ROLL_ROT | 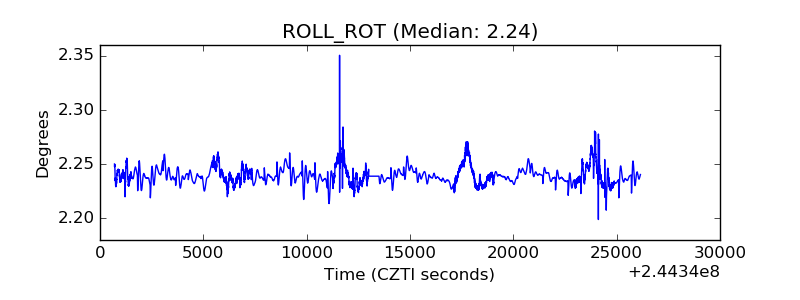 |
| _Roll_DEC | 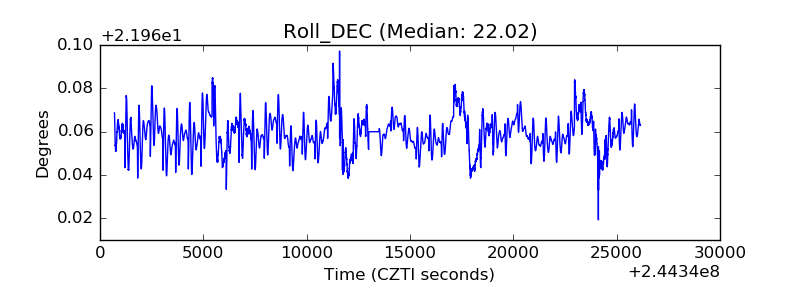 |
| _Roll_RA | 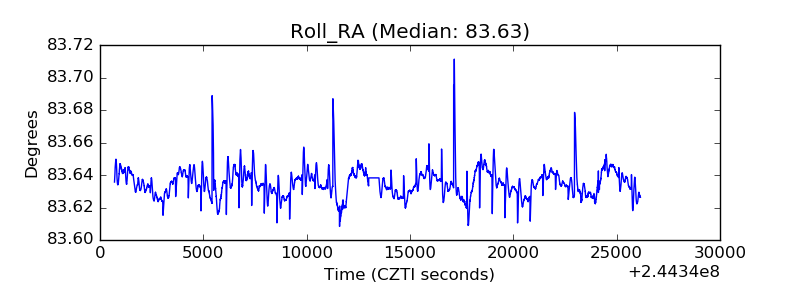 |
| Veto Counter | 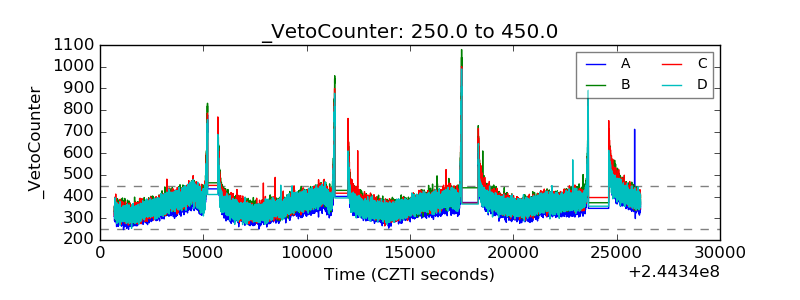 |