| Param | Original file | Final file |
|---|---|---|
| Filename | modeM0/AS1A03_086T01_9000001568_10838cztM0_level2.evt | modeM0/AS1A03_086T01_9000001568_10838cztM0_level2_quad_clean.evt |
| Size (bytes) | 508,777,920 | 77,529,600 |
| Size | 485.2 MB | 73.9 MB |
| Events in quadrant A | 5,015,736 | 492,212 |
| Events in quadrant B | 4,290,963 | 484,178 |
| Events in quadrant C | 2,660,621 | 497,755 |
| Events in quadrant D | 3,054,120 | 474,737 |
| Mode M9 | |||
|---|---|---|---|
| Quadrant | BADHDUFLAG | Total packets | Discarded packets |
| A | 0 | 11 | 0 |
| B | 0 | 11 | 0 |
| C | 0 | 11 | 0 |
| D | 0 | 11 | 0 |
| Mode SS | |||
|---|---|---|---|
| Quadrant | BADHDUFLAG | Total packets | Discarded packets |
| A | 0 | 116 | 0 |
| B | 0 | 116 | 0 |
| C | 0 | 116 | 0 |
| D | 0 | 116 | 0 |
| Mode M0 | |||
|---|---|---|---|
| Quadrant | BADHDUFLAG | Total packets | Discarded packets |
| A | 0 | 18708 | 2 |
| B | 0 | 16422 | 1 |
| C | 0 | 11631 | 1 |
| D | 0 | 12770 | 1 |
| Quadrant | Total seconds | Saturated seconds | Saturation percentage |
|---|---|---|---|
| A | 5704 | 637 | 11.167602% |
| B | 5704 | 452 | 7.924264% |
| C | 5704 | 25 | 0.438289% |
| D | 5704 | 77 | 1.349930% |
Noise dominated data is calculated using 1-second bins in cleaned event files. If a bin has >2000 counts, and if more than 50% of those come from <1% of pixels, then it is considered to be noise-dominated and hence unusable.
| Quadrant | # 1 sec bins | Bins with >0 counts | Bins with >2000 counts | High rate bins dominated by noise | Noise dominated (total time) | Noise dominated (detector-on time) | Marked lightcurve |
|---|---|---|---|---|---|---|---|
| A | 6789 | 5705 | 480 | 480 | 7.07% | 8.41% | 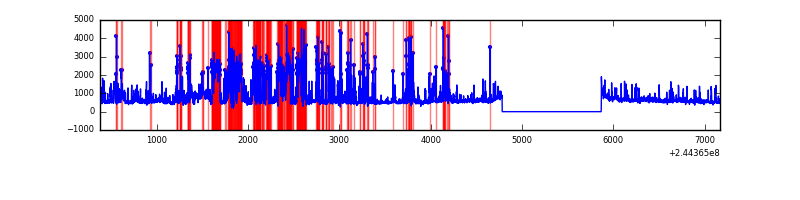 |
| B | 6789 | 5705 | 270 | 270 | 3.98% | 4.73% | 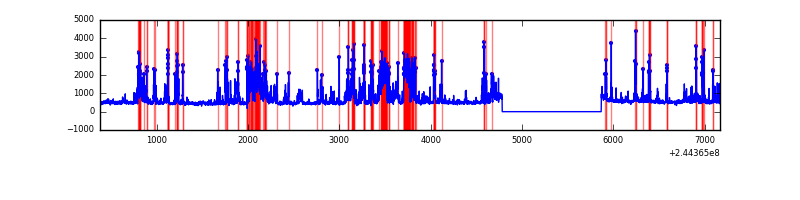 |
| C | 6789 | 5705 | 0 | 0 | 0.00% | 0.00% | 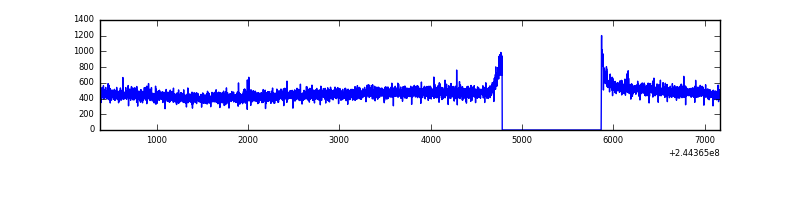 |
| D | 6789 | 5705 | 35 | 35 | 0.52% | 0.61% | 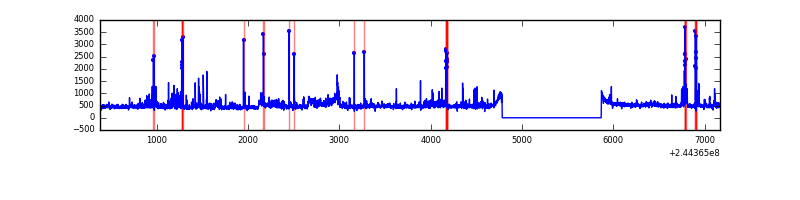 |
Top three noisy pixels from each quadrant. If the there are fewer than three noisy pixels in the level2.evt file, extra rows are filled as -1
| Pixel properties | Quadrant properties | ||||||
|---|---|---|---|---|---|---|---|
| Quadrant | DetID | PixID | Counts | Sigma | Mean | Median | Sigma |
| A | 8 | 5 | 2330933 | 16651.89 | 683 | 671 | 139.9 |
| A | 13 | 251 | 21168 | 146.47 | 683 | 671 | 139.9 |
| A | 15 | 174 | 18244 | 125.58 | 683 | 671 | 139.9 |
| B | 4 | 239 | 1496532 | 11250.29 | 688 | 672 | 133.0 |
| B | 0 | 214 | 54547 | 405.19 | 688 | 672 | 133.0 |
| B | 0 | 85 | 31582 | 232.47 | 688 | 672 | 133.0 |
| C | 13 | 61 | 5022 | 27.22 | 682 | 687 | 159.2 |
| C | 14 | 234 | 1757 | 6.72 | 682 | 687 | 159.2 |
| C | 3 | 202 | 1633 | 5.94 | 682 | 687 | 159.2 |
| D | 1 | 52 | 150097 | 892.28 | 683 | 665 | 167.5 |
| D | 9 | 85 | 116647 | 692.55 | 683 | 665 | 167.5 |
| D | 13 | 105 | 47574 | 280.1 | 683 | 665 | 167.5 |
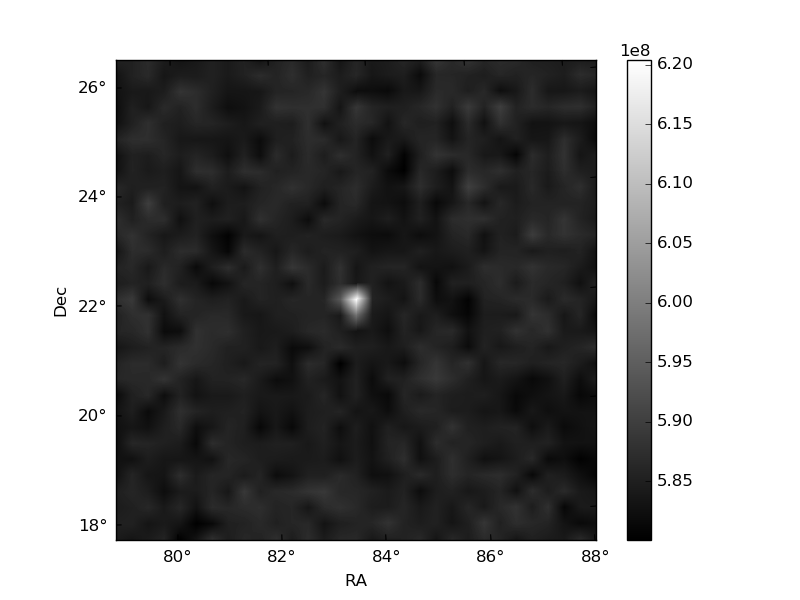
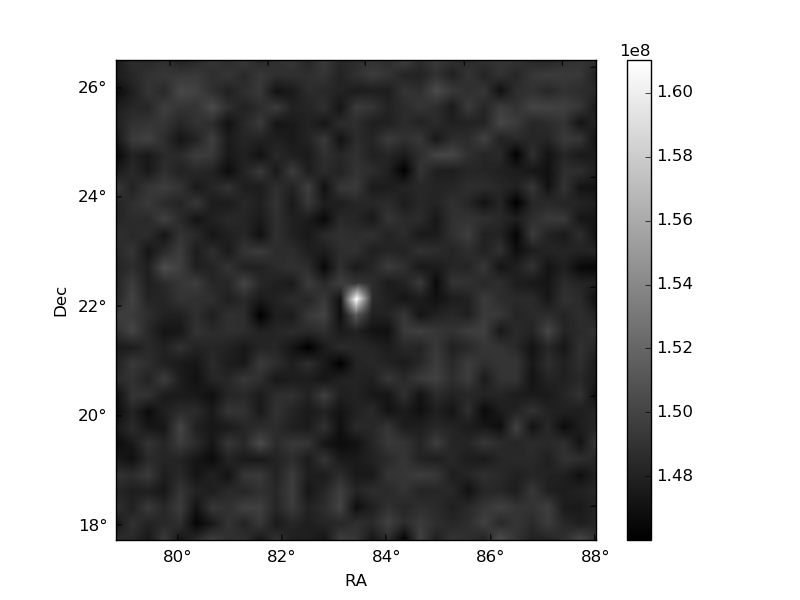
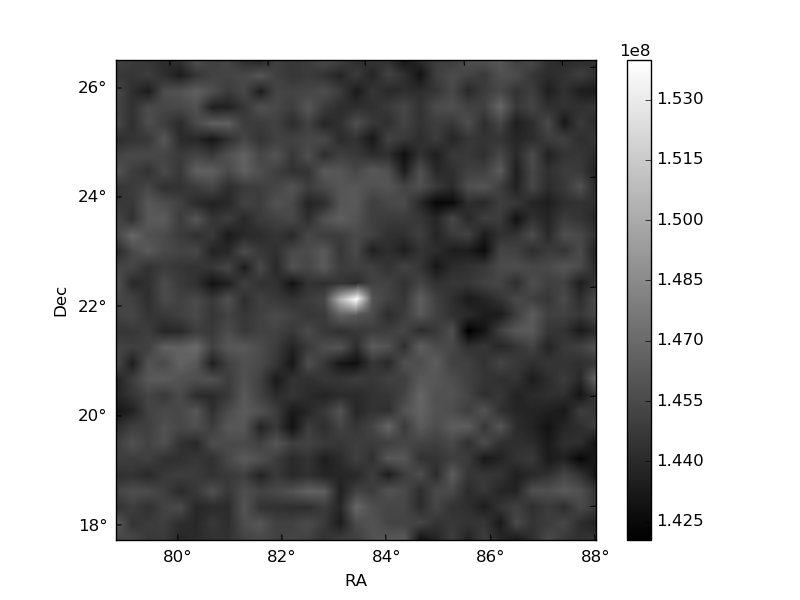
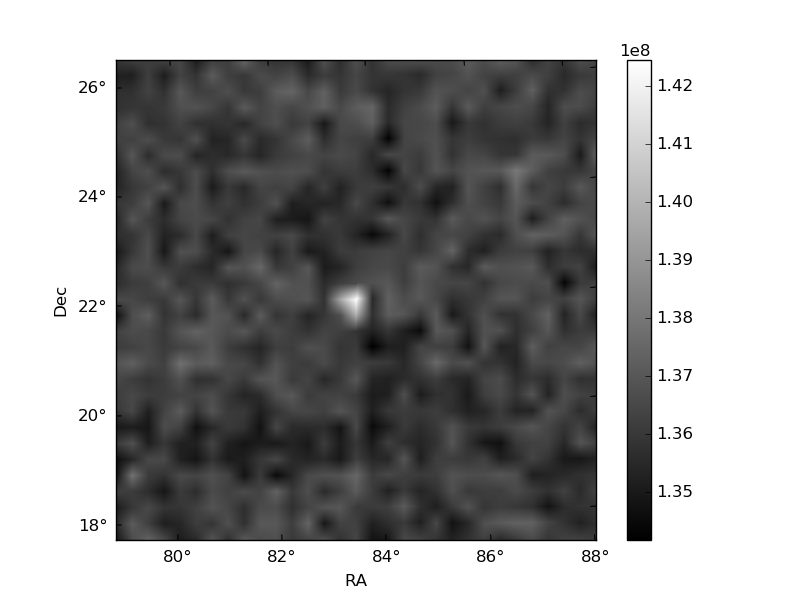
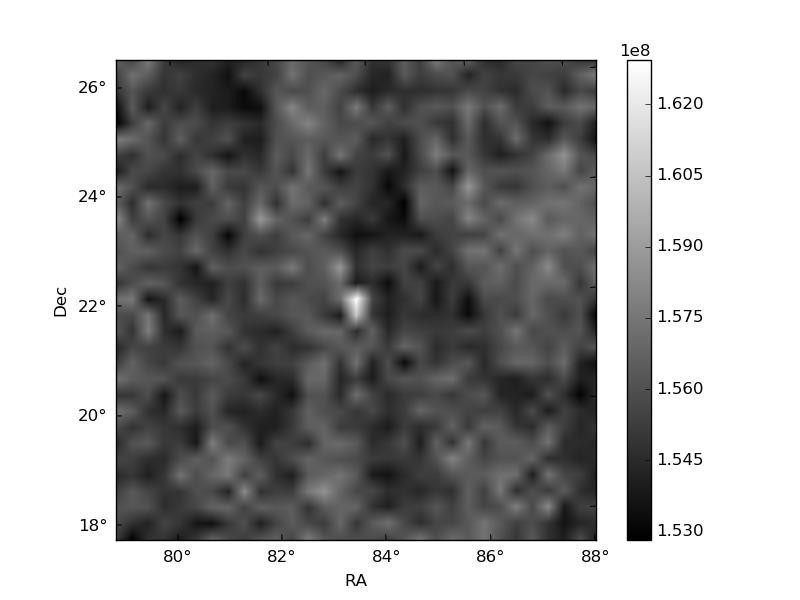
Histogram calculated using DETX and DETY for each event in the final _common_clean file
| Quadrant A | 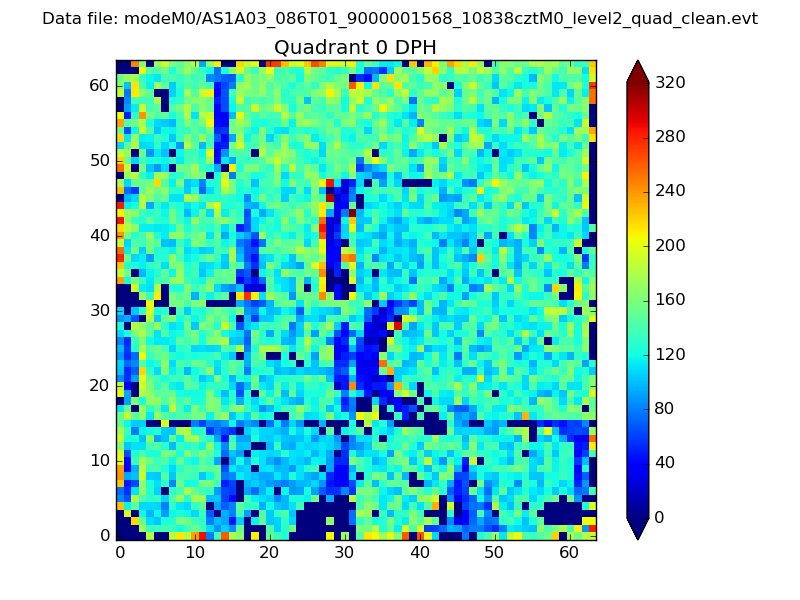 |
 |
Quadrant B |
|---|---|---|---|
| Quadrant D | 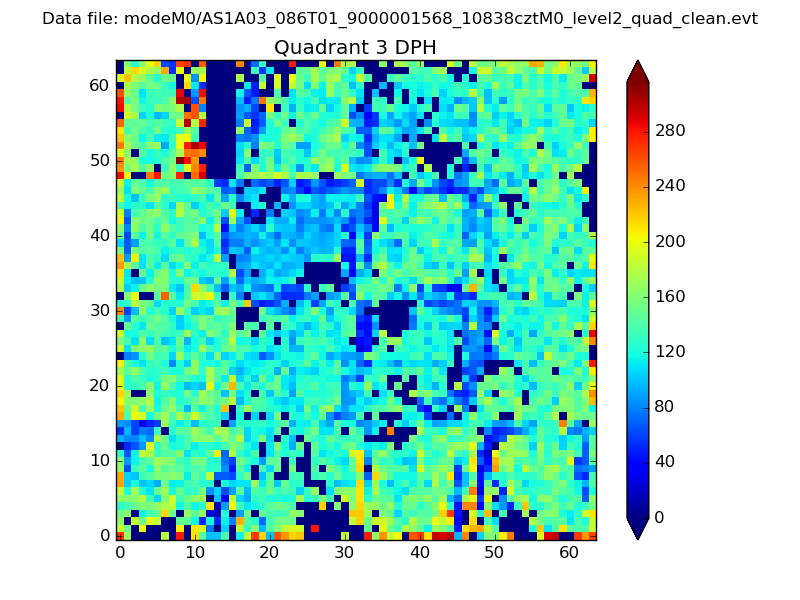 |
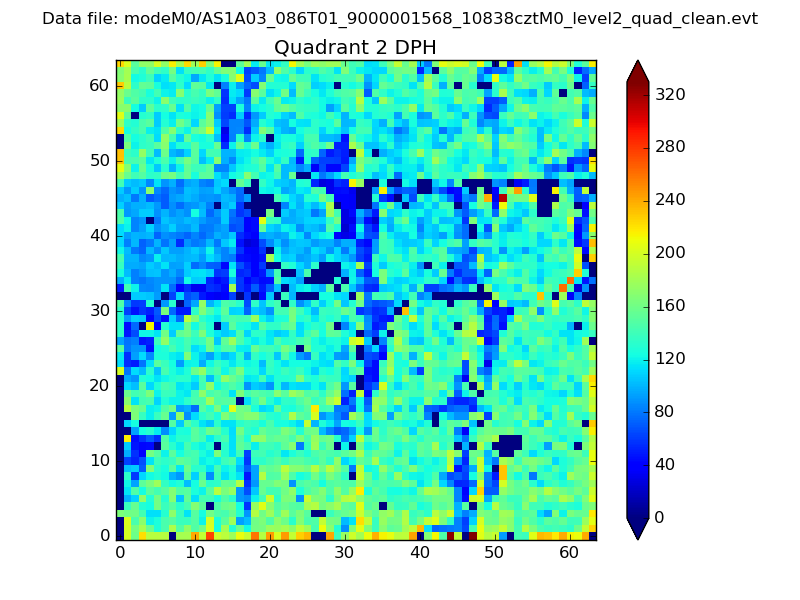 |
Quadrant C |
| Plot type | Count rate plots | Images |
|---|---|---|
| Comparison with Poisson distribution Blue bars denote a histogram of data divided into 1 sec bins. Red curve is a Poisson curve with rate = median count rate of data. |
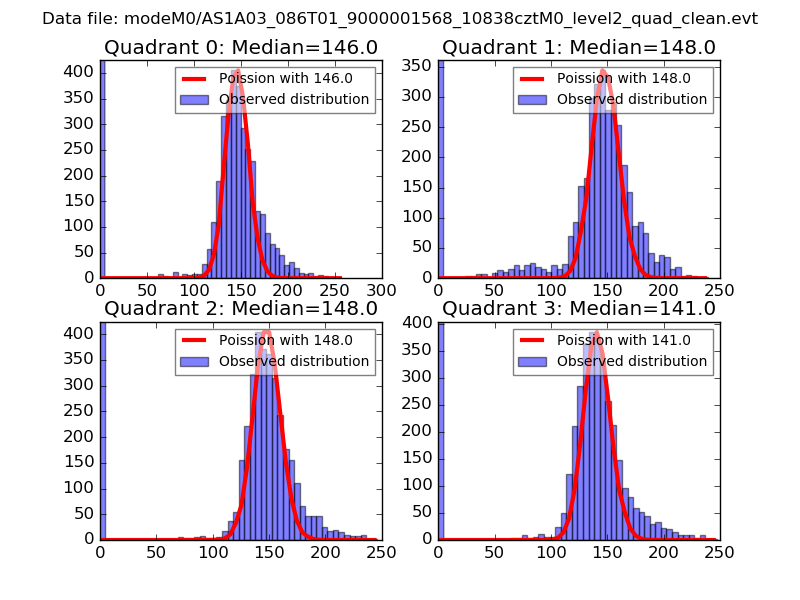 |
 |
| Quadrant-wise count rates Data is divided into 100 sec bins |
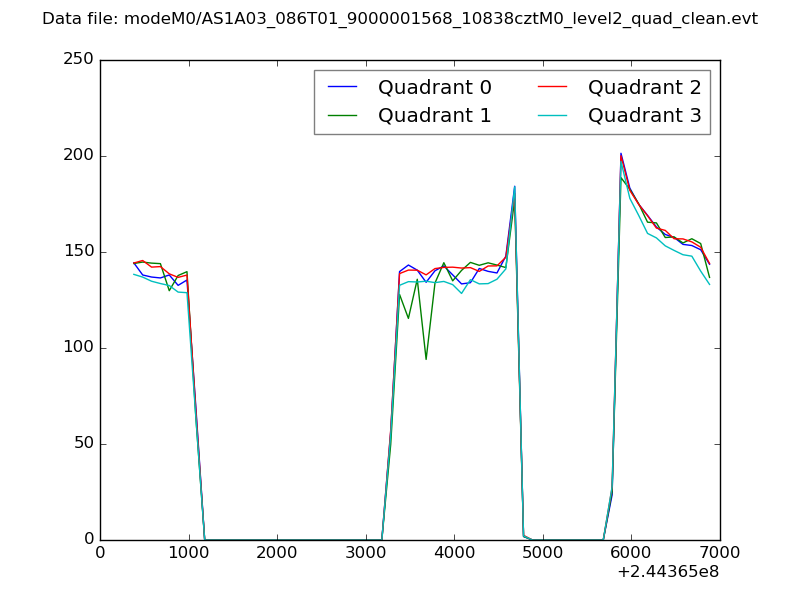 |
|
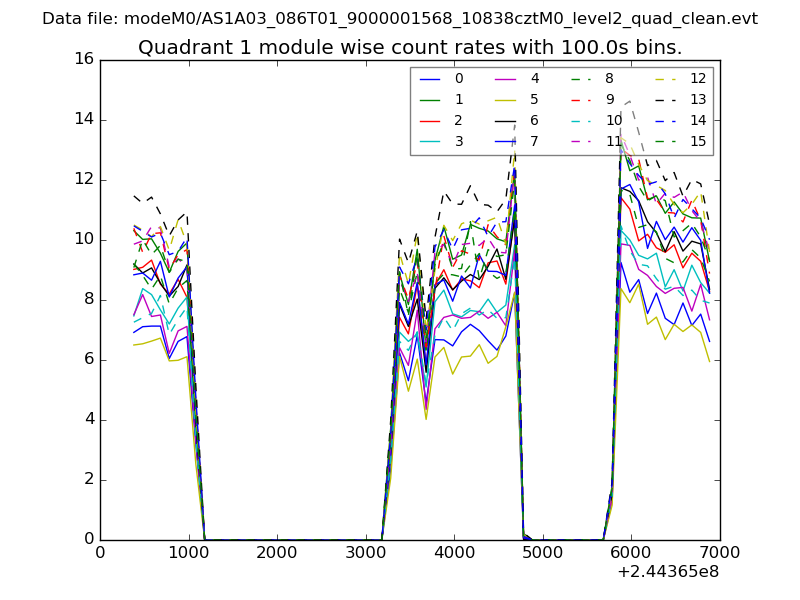
| Module-wise count rates for Quadrant A Data is divided into 100 sec bins |
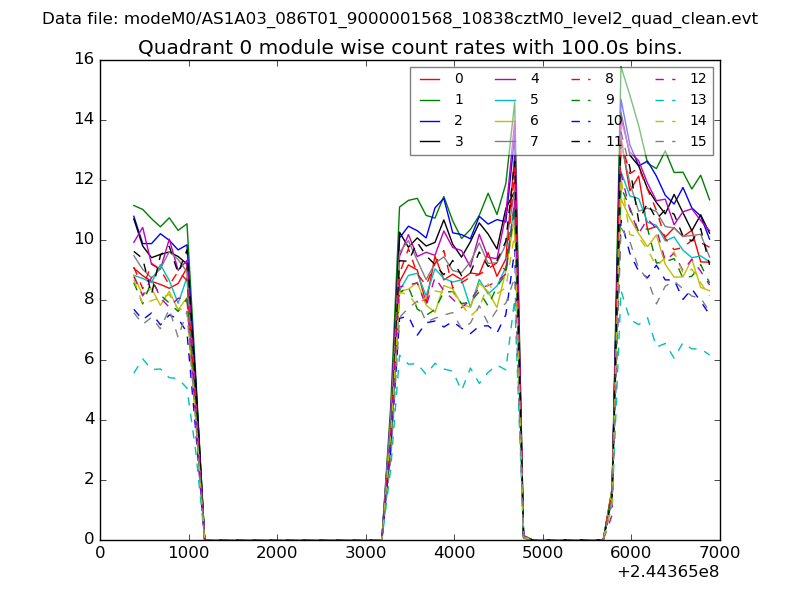 |
 |
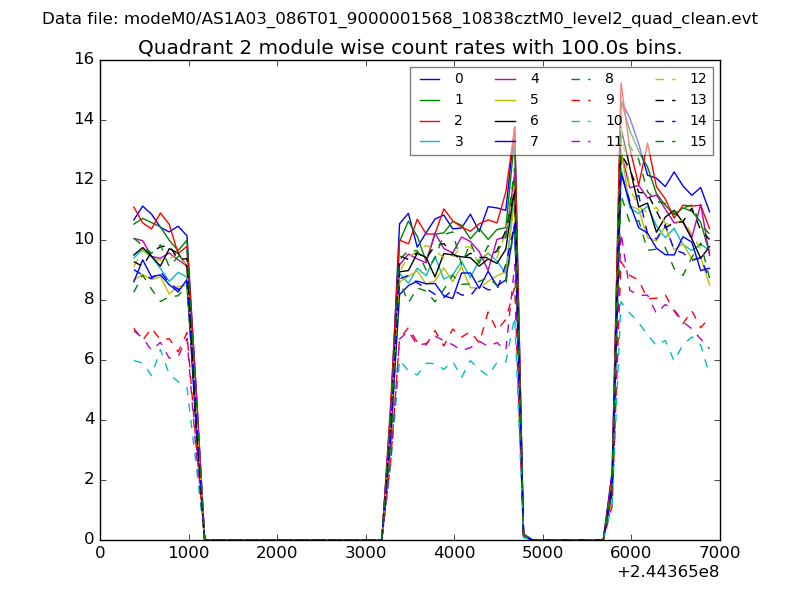
| Module-wise count rates for Quadrant B Data is divided into 100 sec bins |
 |
 |
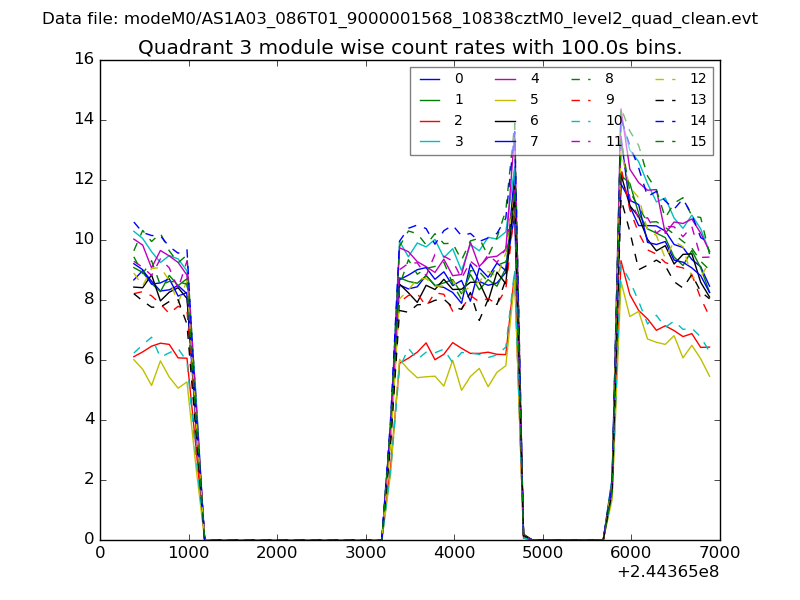
| Module-wise count rates for Quadrant C Data is divided into 100 sec bins |
 |
 |
| Module-wise count rates for Quadrant D Data is divided into 100 sec bins |
 |
 |
| Parameter | Plot |
|---|---|
| CZT HV Monitor | 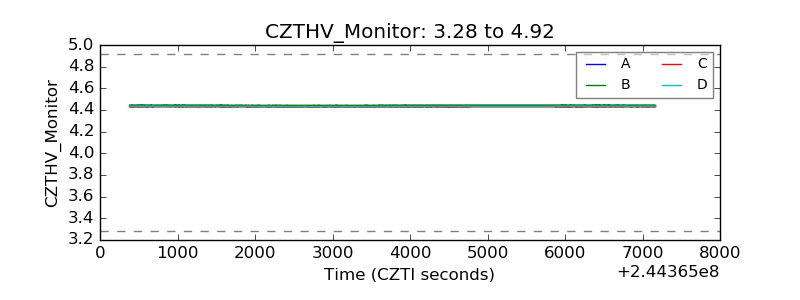 |
| D_VDD | 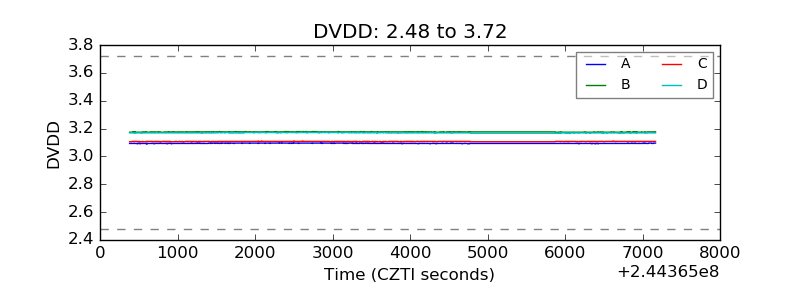 |
| Temperature 1 | 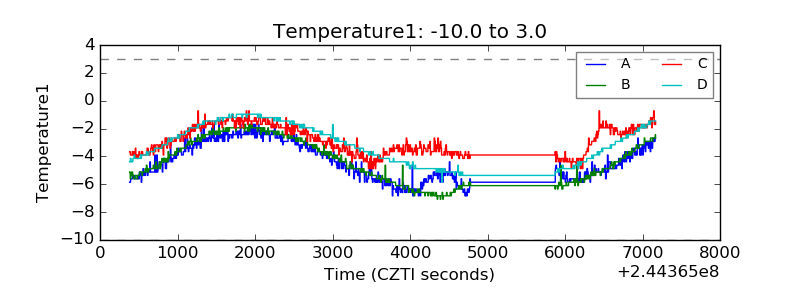 |
| Veto HV Monitor | 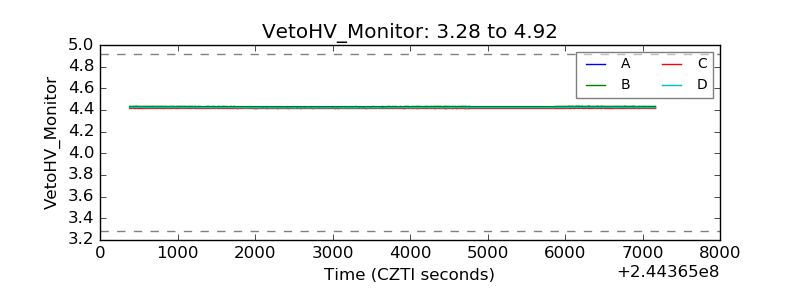 |
| Veto LLD | 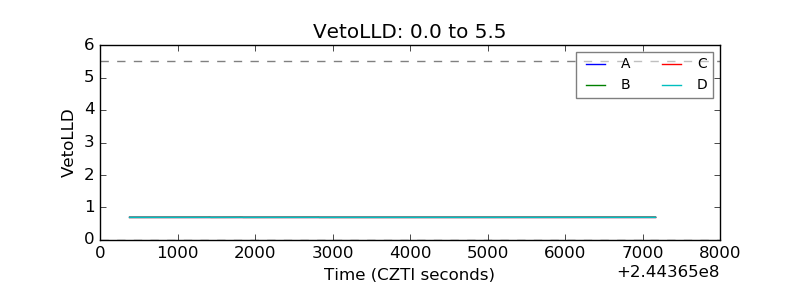 |
| Alpha Counter | 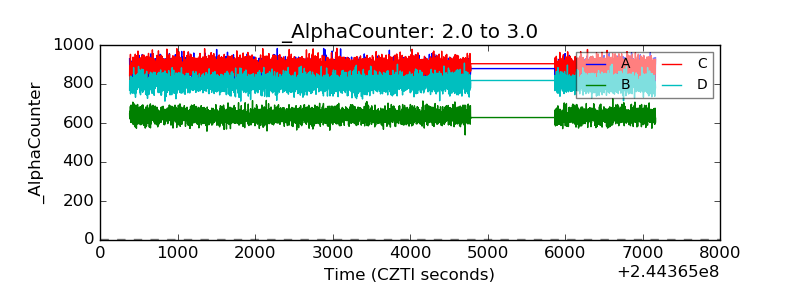 |
| _CPM_Rate | 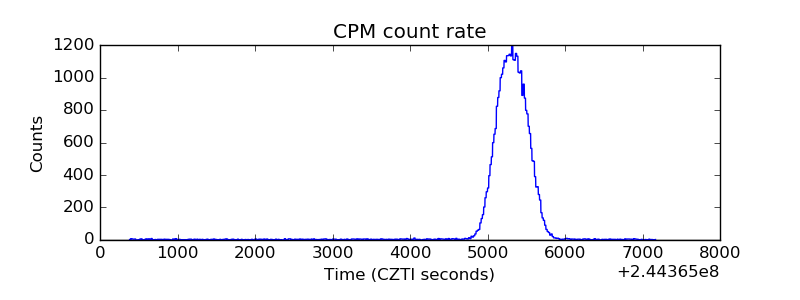 |
| CZT Counter | 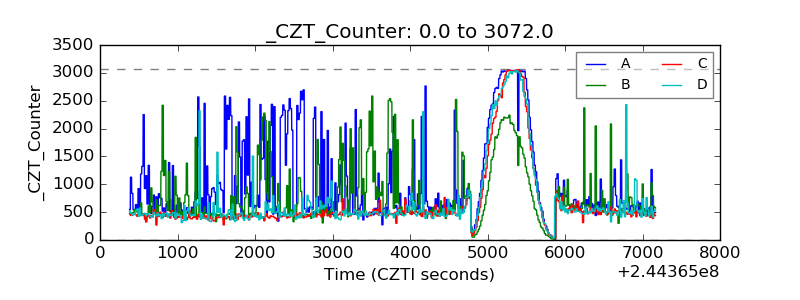 |
| +2.5 Volts monitor |  |
| +5 Volts monitor |  |
| _ROLL_ROT | 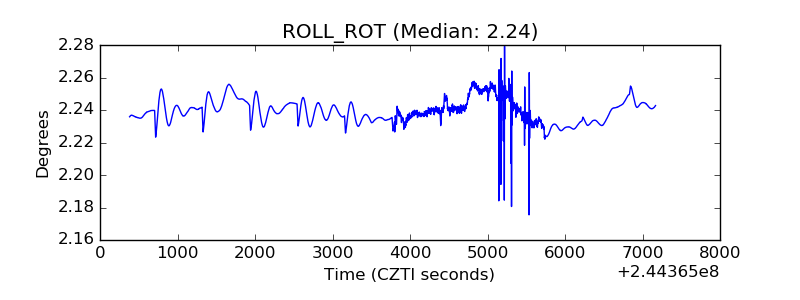 |
| _Roll_DEC | 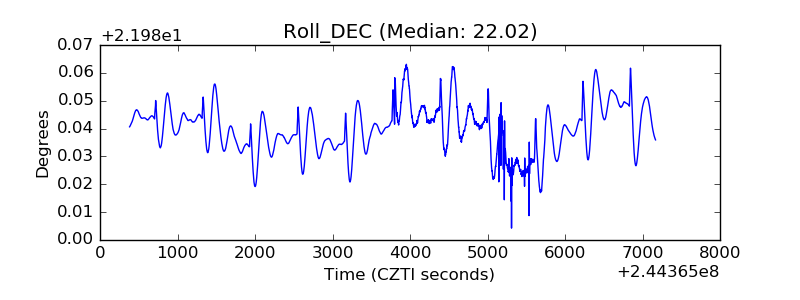 |
| _Roll_RA | 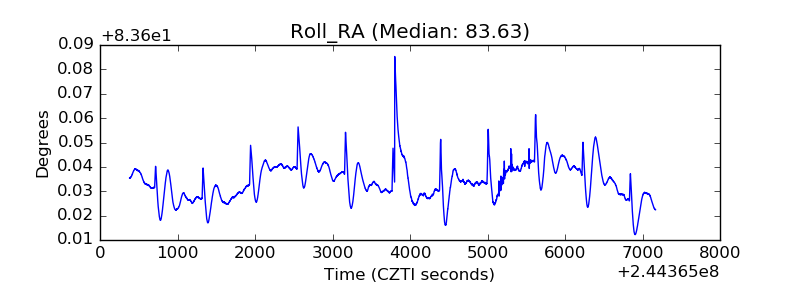 |
| Veto Counter | 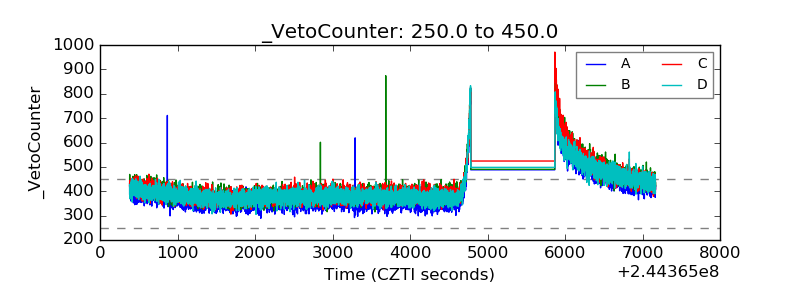 |