| Param | Original file | Final file |
|---|---|---|
| Filename | modeM0/AS1A03_086T01_9000001568_10839cztM0_level2.evt | modeM0/AS1A03_086T01_9000001568_10839cztM0_level2_quad_clean.evt |
| Size (bytes) | 534,352,320 | 73,526,400 |
| Size | 509.6 MB | 70.1 MB |
| Events in quadrant A | 5,102,076 | 457,808 |
| Events in quadrant B | 4,762,113 | 455,857 |
| Events in quadrant C | 2,810,615 | 464,848 |
| Events in quadrant D | 3,113,797 | 441,138 |
| Mode M9 | |||
|---|---|---|---|
| Quadrant | BADHDUFLAG | Total packets | Discarded packets |
| A | 0 | 12 | 0 |
| B | 0 | 12 | 0 |
| C | 0 | 12 | 0 |
| D | 0 | 12 | 0 |
| Mode SS | |||
|---|---|---|---|
| Quadrant | BADHDUFLAG | Total packets | Discarded packets |
| A | 0 | 118 | 0 |
| B | 0 | 118 | 0 |
| C | 0 | 118 | 0 |
| D | 0 | 118 | 0 |
| Mode M0 | |||
|---|---|---|---|
| Quadrant | BADHDUFLAG | Total packets | Discarded packets |
| A | 0 | 18962 | 2 |
| B | 0 | 17944 | 1 |
| C | 0 | 12008 | 1 |
| D | 0 | 12904 | 1 |
| Quadrant | Total seconds | Saturated seconds | Saturation percentage |
|---|---|---|---|
| A | 5819 | 677 | 11.634301% |
| B | 5819 | 478 | 8.214470% |
| C | 5819 | 23 | 0.395257% |
| D | 5819 | 94 | 1.615398% |
Noise dominated data is calculated using 1-second bins in cleaned event files. If a bin has >2000 counts, and if more than 50% of those come from <1% of pixels, then it is considered to be noise-dominated and hence unusable.
| Quadrant | # 1 sec bins | Bins with >0 counts | Bins with >2000 counts | High rate bins dominated by noise | Noise dominated (total time) | Noise dominated (detector-on time) | Marked lightcurve |
|---|---|---|---|---|---|---|---|
| A | 7014 | 5820 | 460 | 460 | 6.56% | 7.90% | 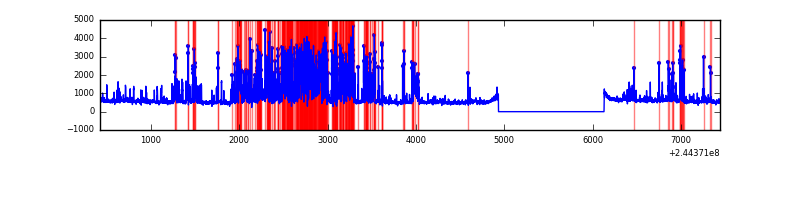 |
| B | 7013 | 5819 | 269 | 269 | 3.84% | 4.62% | 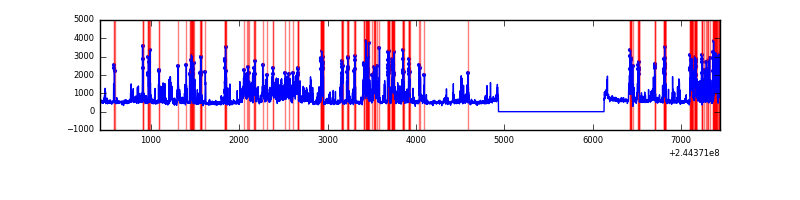 |
| C | 7014 | 5820 | 1 | 1 | 0.01% | 0.02% |  |
| D | 7014 | 5820 | 49 | 49 | 0.70% | 0.84% | 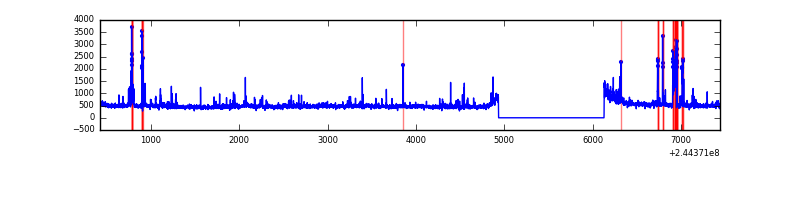 |
Top three noisy pixels from each quadrant. If the there are fewer than three noisy pixels in the level2.evt file, extra rows are filled as -1
| Pixel properties | Quadrant properties | ||||||
|---|---|---|---|---|---|---|---|
| Quadrant | DetID | PixID | Counts | Sigma | Mean | Median | Sigma |
| A | 8 | 5 | 2265224 | 15716.85 | 712 | 699 | 144.1 |
| A | 13 | 251 | 66951 | 459.82 | 712 | 699 | 144.1 |
| A | 11 | 29 | 8756 | 55.92 | 712 | 699 | 144.1 |
| B | 4 | 239 | 1707776 | 12481.59 | 720 | 707 | 136.8 |
| B | 3 | 189 | 148488 | 1080.53 | 720 | 707 | 136.8 |
| B | 0 | 214 | 59444 | 429.47 | 720 | 707 | 136.8 |
| C | 14 | 234 | 9769 | 54.11 | 718 | 723 | 167.2 |
| C | 13 | 61 | 5394 | 27.94 | 718 | 723 | 167.2 |
| C | 5 | 207 | 1920 | 7.16 | 718 | 723 | 167.2 |
| D | 2 | 14 | 96871 | 556.47 | 717 | 699 | 172.8 |
| D | 9 | 85 | 91151 | 523.38 | 717 | 699 | 172.8 |
| D | 13 | 104 | 82757 | 474.81 | 717 | 699 | 172.8 |
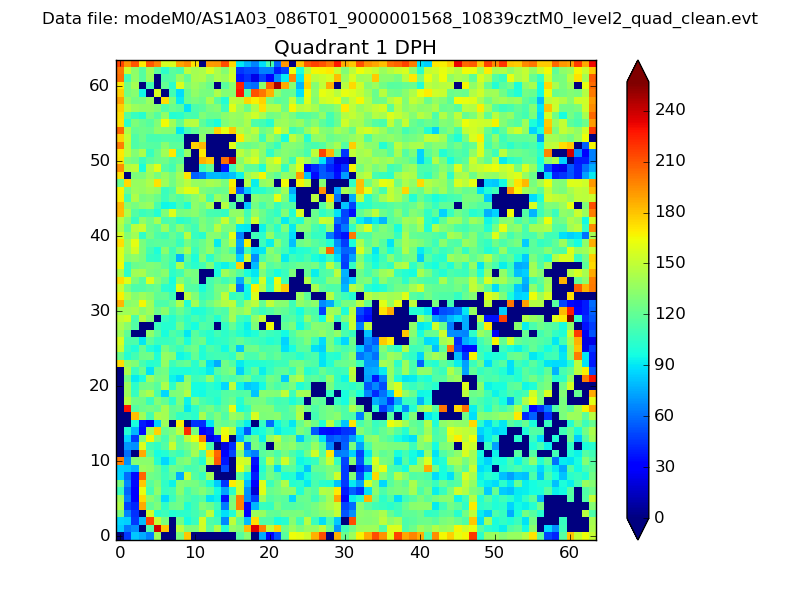
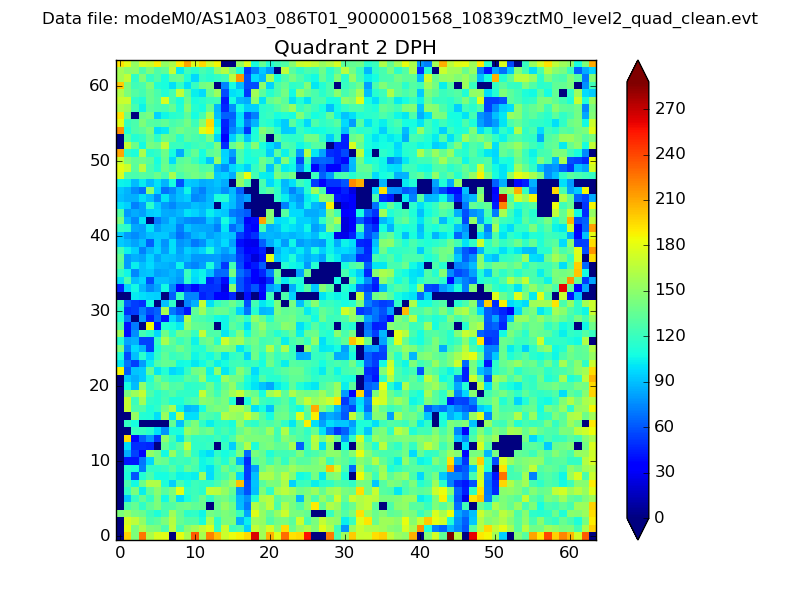
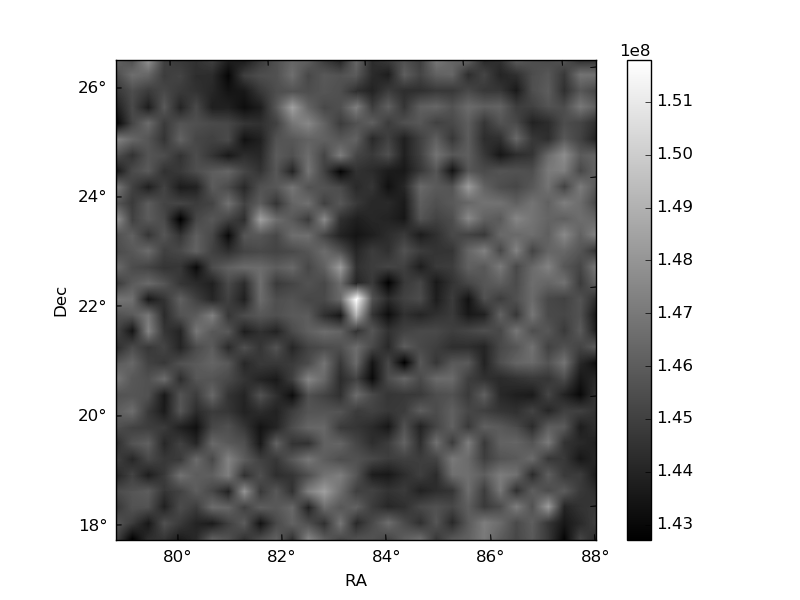
Histogram calculated using DETX and DETY for each event in the final _common_clean file
| Quadrant A | 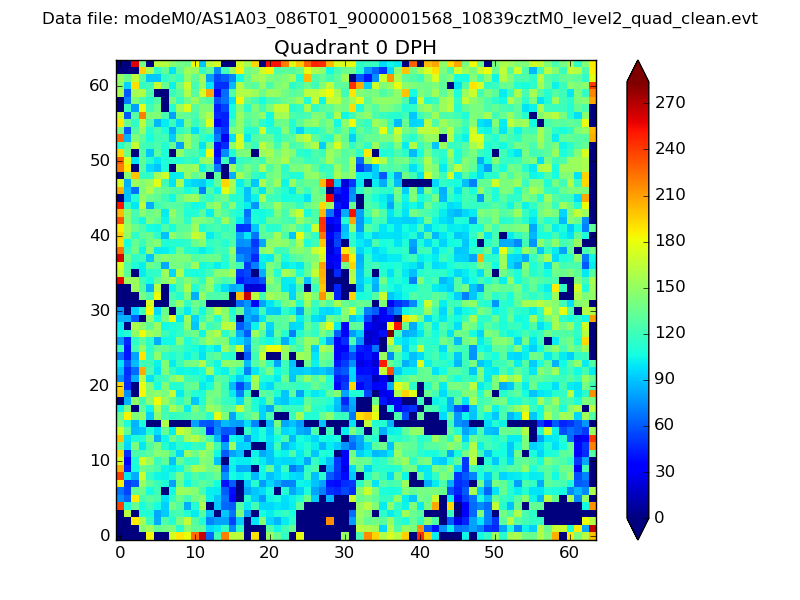 |
 |
Quadrant B |
|---|---|---|---|
| Quadrant D | 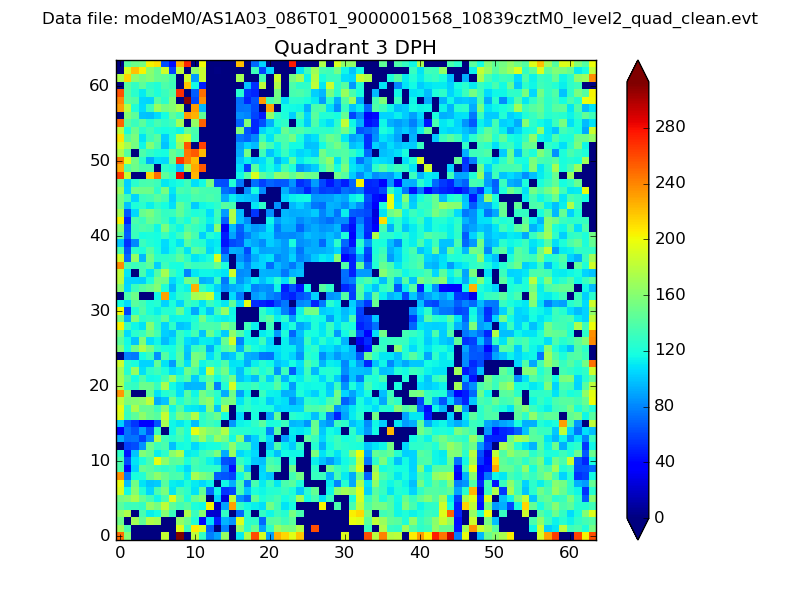 |
 |
Quadrant C |
| Plot type | Count rate plots | Images |
|---|---|---|
| Comparison with Poisson distribution Blue bars denote a histogram of data divided into 1 sec bins. Red curve is a Poisson curve with rate = median count rate of data. |
 |
 |
| Quadrant-wise count rates Data is divided into 100 sec bins |
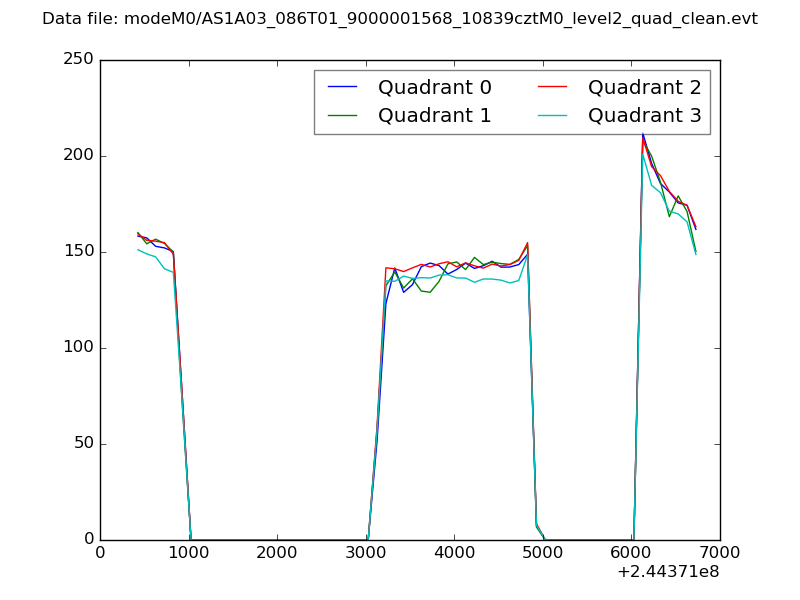 |
|
| Module-wise count rates for Quadrant A Data is divided into 100 sec bins |
 |
 |
| Module-wise count rates for Quadrant B Data is divided into 100 sec bins |
 |
 |
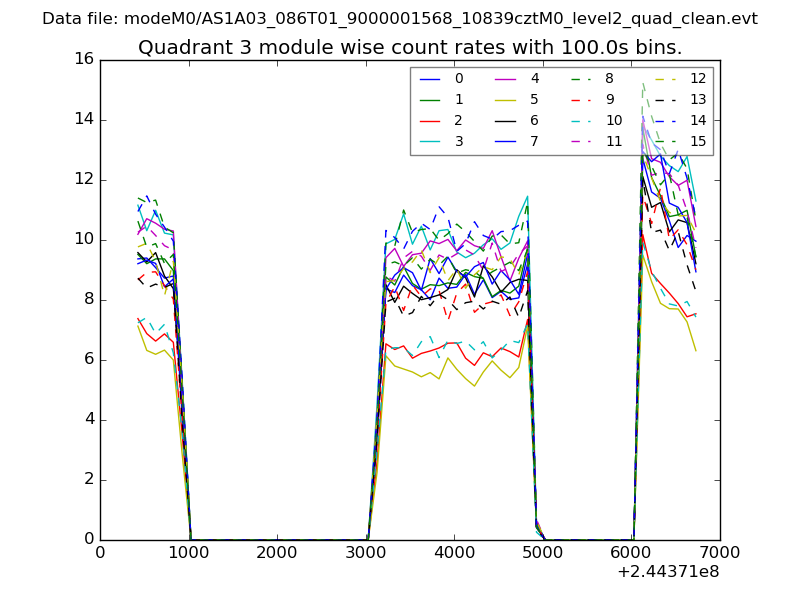
| Module-wise count rates for Quadrant C Data is divided into 100 sec bins |
 |
 |
| Module-wise count rates for Quadrant D Data is divided into 100 sec bins |
 |
 |
| Parameter | Plot |
|---|---|
| CZT HV Monitor |  |
| D_VDD | 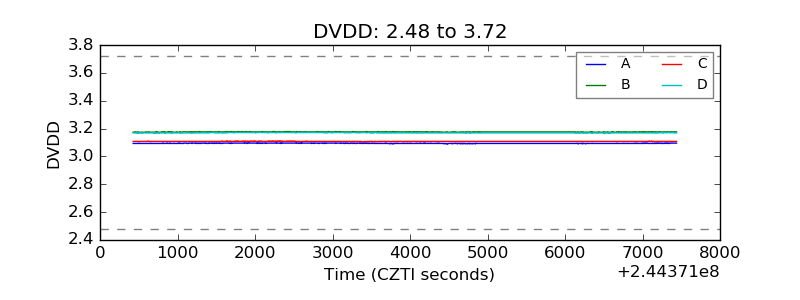 |
| Temperature 1 | 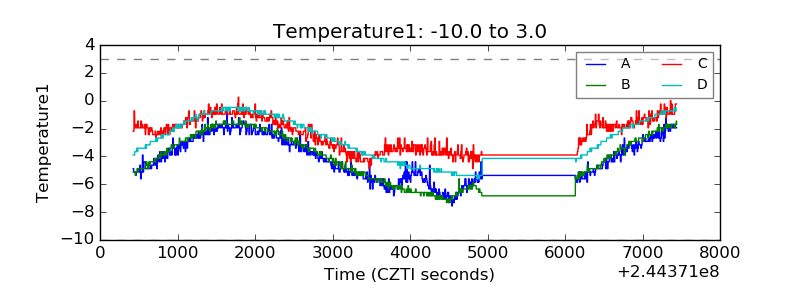 |
| Veto HV Monitor | 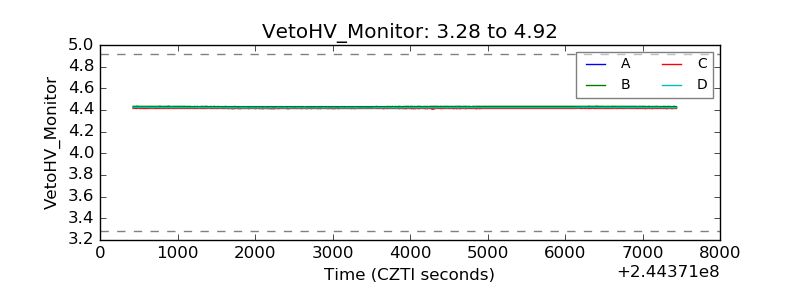 |
| Veto LLD | 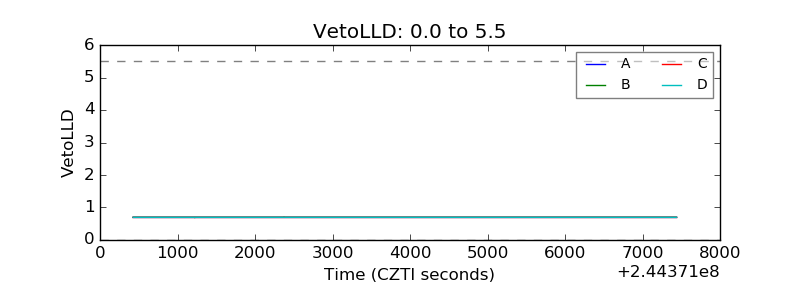 |
| Alpha Counter | 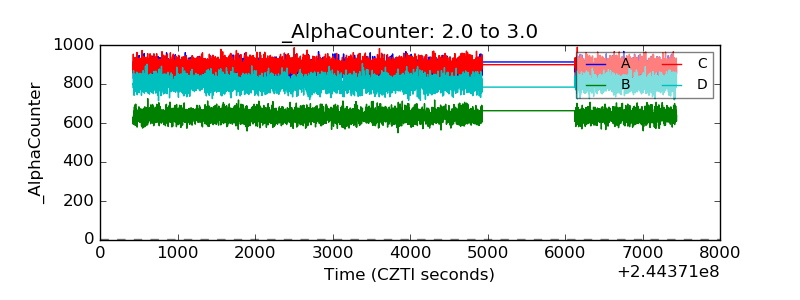 |
| _CPM_Rate | 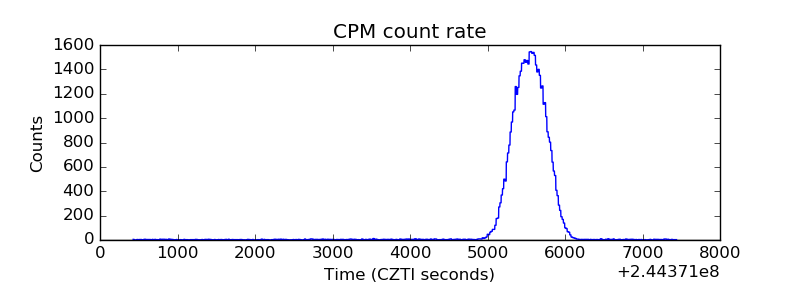 |
| CZT Counter | 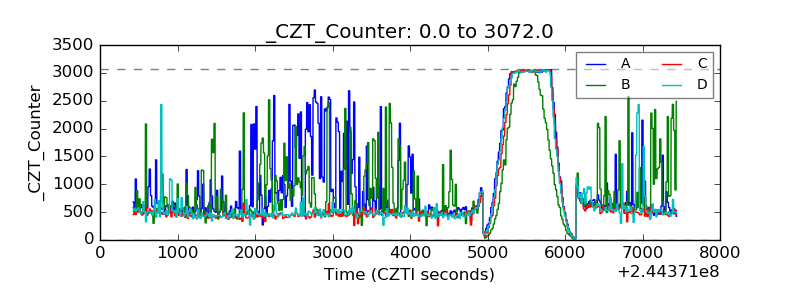 |
| +2.5 Volts monitor |  |
| +5 Volts monitor |  |
| _ROLL_ROT | 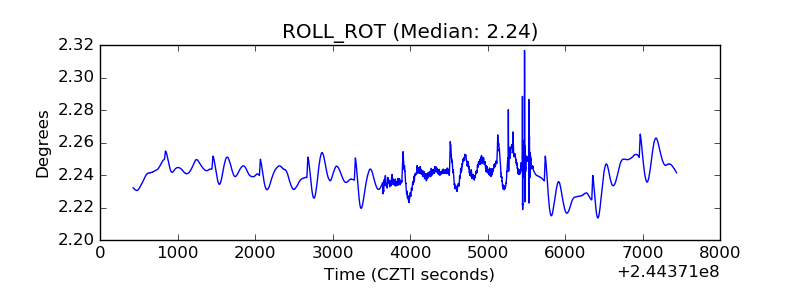 |
| _Roll_DEC | 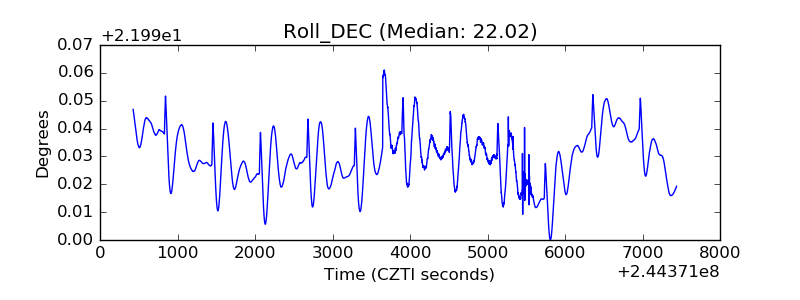 |
| _Roll_RA | 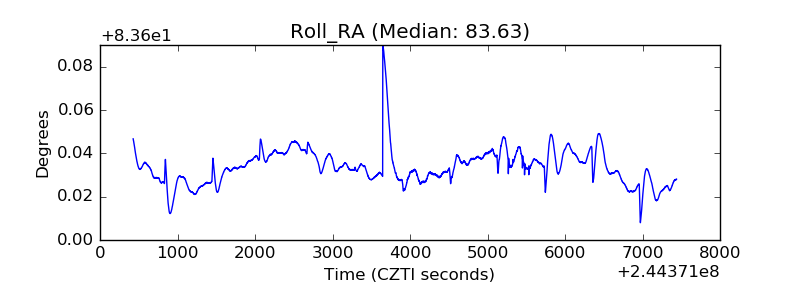 |
| Veto Counter |  |