| Param | Original file | Final file |
|---|---|---|
| Filename | modeM0/AS1A03_086T01_9000001568_10842cztM0_level2.evt | modeM0/AS1A03_086T01_9000001568_10842cztM0_level2_quad_clean.evt |
| Size (bytes) | 522,578,880 | 71,576,640 |
| Size | 498.4 MB | 68.3 MB |
| Events in quadrant A | 4,271,040 | 430,173 |
| Events in quadrant B | 4,324,893 | 431,136 |
| Events in quadrant C | 3,275,132 | 436,243 |
| Events in quadrant D | 3,513,243 | 414,806 |
| Mode M9 | |||
|---|---|---|---|
| Quadrant | BADHDUFLAG | Total packets | Discarded packets |
| A | 0 | 13 | 0 |
| B | 0 | 13 | 0 |
| C | 0 | 13 | 0 |
| D | 0 | 14 | 0 |
| Mode SS | |||
|---|---|---|---|
| Quadrant | BADHDUFLAG | Total packets | Discarded packets |
| A | 0 | 130 | 0 |
| B | 0 | 130 | 0 |
| C | 0 | 130 | 0 |
| D | 0 | 130 | 0 |
| Mode M0 | |||
|---|---|---|---|
| Quadrant | BADHDUFLAG | Total packets | Discarded packets |
| A | 0 | 16982 | 3 |
| B | 0 | 16972 | 2 |
| C | 0 | 13654 | 2 |
| D | 0 | 14641 | 4 |
| Quadrant | Total seconds | Saturated seconds | Saturation percentage |
|---|---|---|---|
| A | 6522 | 194 | 2.974548% |
| B | 6522 | 292 | 4.477154% |
| C | 6522 | 65 | 0.996627% |
| D | 6521 | 88 | 1.349486% |
Noise dominated data is calculated using 1-second bins in cleaned event files. If a bin has >2000 counts, and if more than 50% of those come from <1% of pixels, then it is considered to be noise-dominated and hence unusable.
| Quadrant | # 1 sec bins | Bins with >0 counts | Bins with >2000 counts | High rate bins dominated by noise | Noise dominated (total time) | Noise dominated (detector-on time) | Marked lightcurve |
|---|---|---|---|---|---|---|---|
| A | 7737 | 6524 | 65 | 65 | 0.84% | 1.00% | 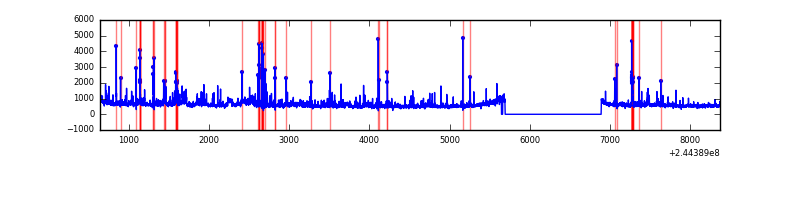 |
| B | 7737 | 6524 | 126 | 126 | 1.63% | 1.93% | 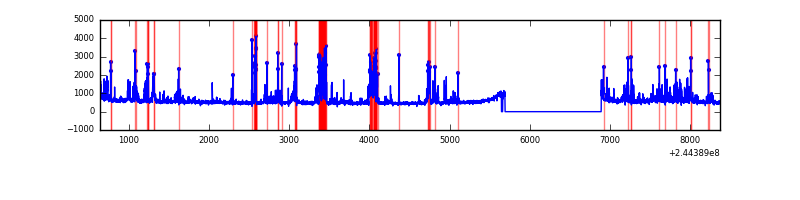 |
| C | 7737 | 6524 | 1 | 1 | 0.01% | 0.02% | 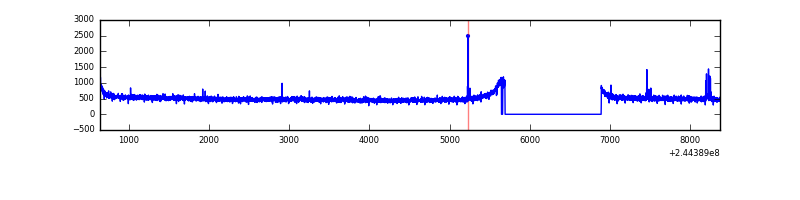 |
| D | 7737 | 6524 | 16 | 16 | 0.21% | 0.25% | 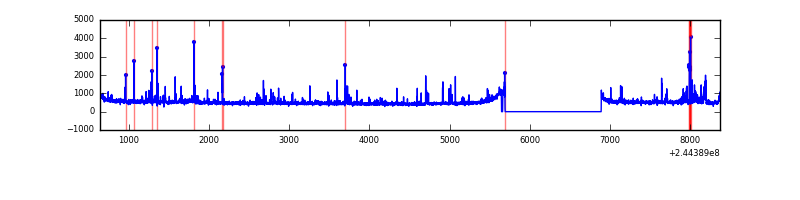 |
Top three noisy pixels from each quadrant. If the there are fewer than three noisy pixels in the level2.evt file, extra rows are filled as -1
| Pixel properties | Quadrant properties | ||||||
|---|---|---|---|---|---|---|---|
| Quadrant | DetID | PixID | Counts | Sigma | Mean | Median | Sigma |
| A | 8 | 5 | 696573 | 4074.9 | 849 | 834 | 170.7 |
| A | 13 | 251 | 209642 | 1222.97 | 849 | 834 | 170.7 |
| A | 15 | 174 | 44740 | 257.15 | 849 | 834 | 170.7 |
| B | 4 | 239 | 953051 | 5935.86 | 846 | 830 | 160.4 |
| B | 12 | 111 | 16718 | 99.04 | 846 | 830 | 160.4 |
| B | 3 | 189 | 15196 | 89.55 | 846 | 830 | 160.4 |
| C | 14 | 234 | 11448 | 55.07 | 835 | 844 | 192.5 |
| C | 3 | 254 | 7292 | 33.49 | 835 | 844 | 192.5 |
| C | 13 | 61 | 6328 | 28.48 | 835 | 844 | 192.5 |
| D | 12 | 227 | 80790 | 398.27 | 832 | 810 | 200.8 |
| D | 1 | 52 | 46554 | 227.79 | 832 | 810 | 200.8 |
| D | 14 | 34 | 45559 | 222.83 | 832 | 810 | 200.8 |
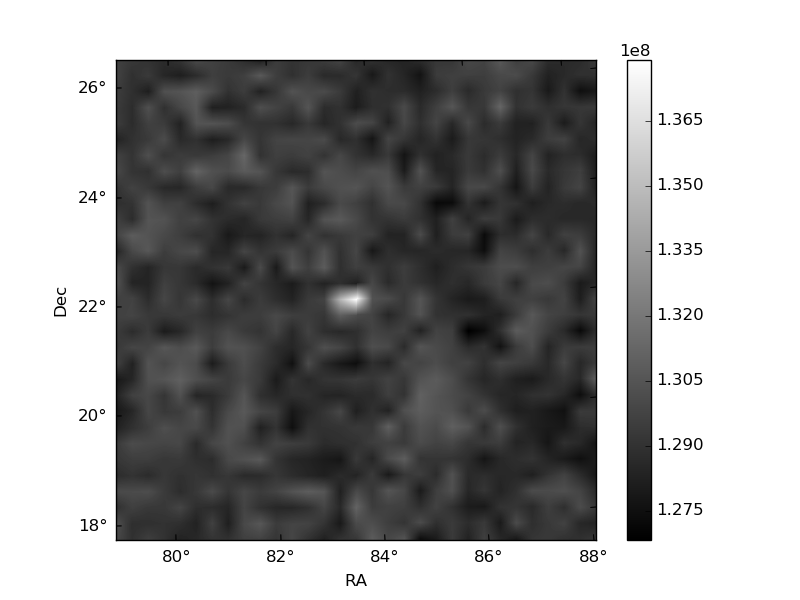
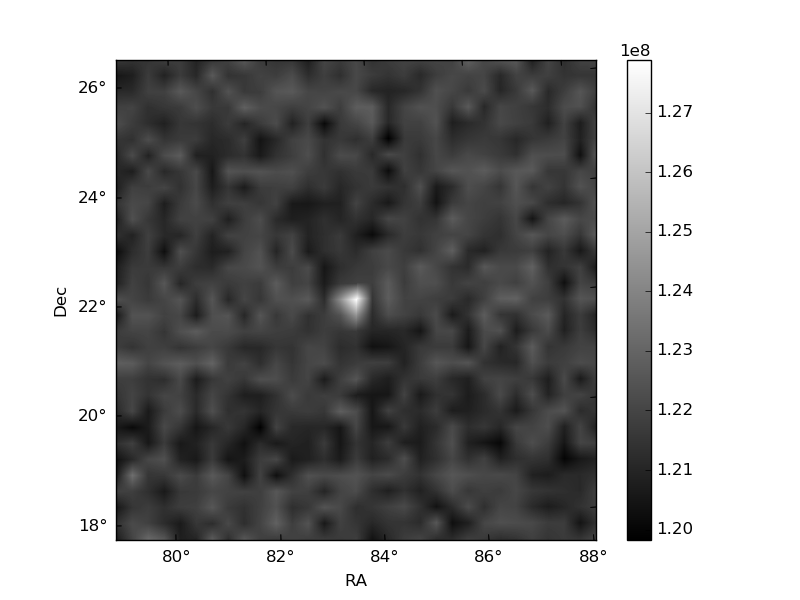
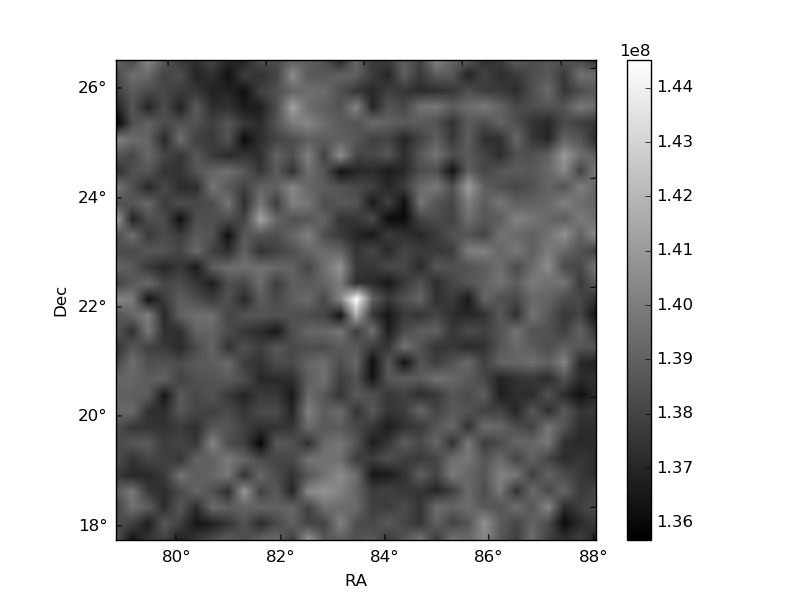
Histogram calculated using DETX and DETY for each event in the final _common_clean file
| Quadrant A | 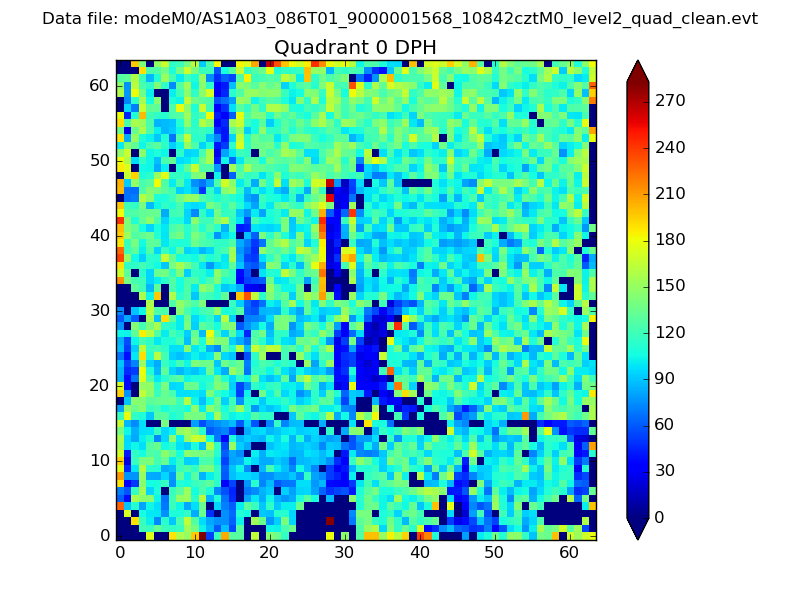 |
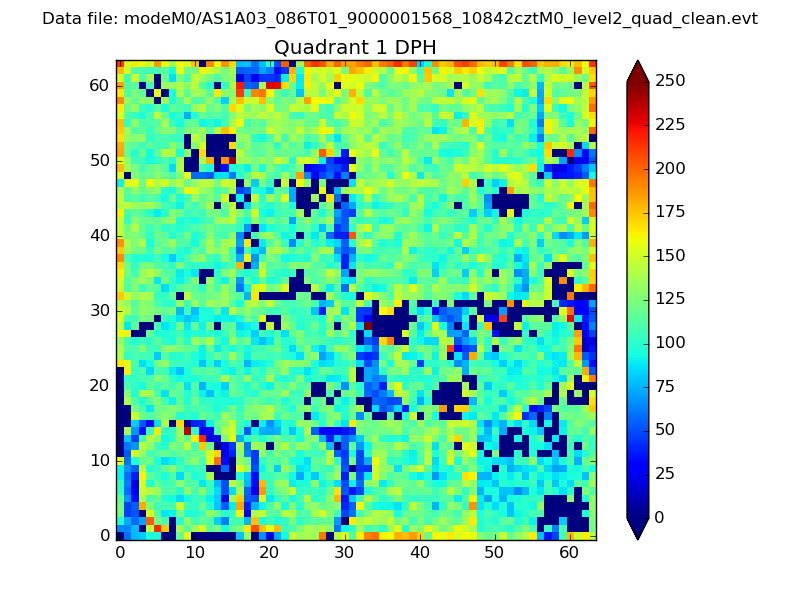 |
Quadrant B |
|---|---|---|---|
| Quadrant D | 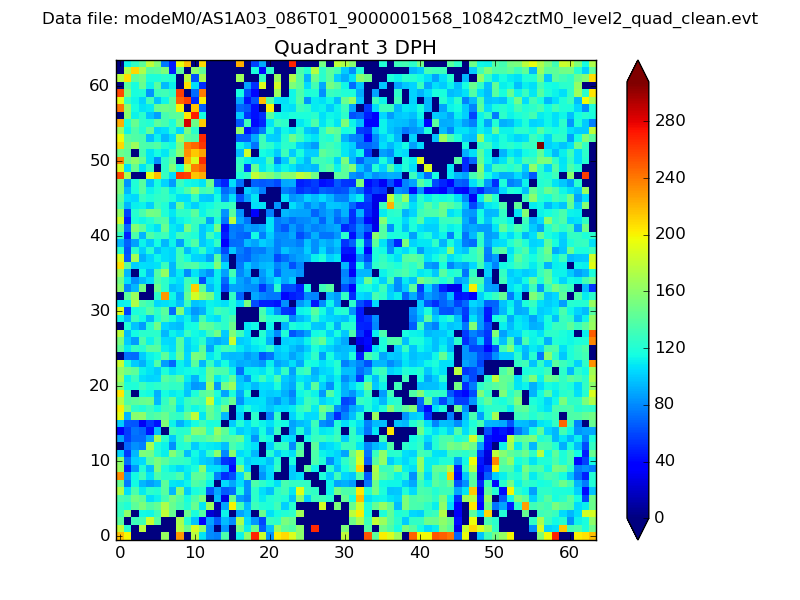 |
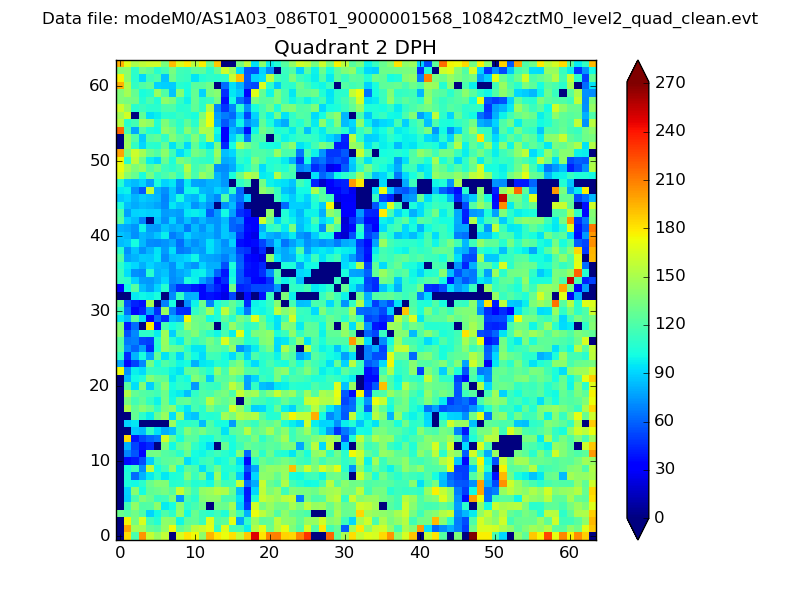 |
Quadrant C |
| Plot type | Count rate plots | Images |
|---|---|---|
| Comparison with Poisson distribution Blue bars denote a histogram of data divided into 1 sec bins. Red curve is a Poisson curve with rate = median count rate of data. |
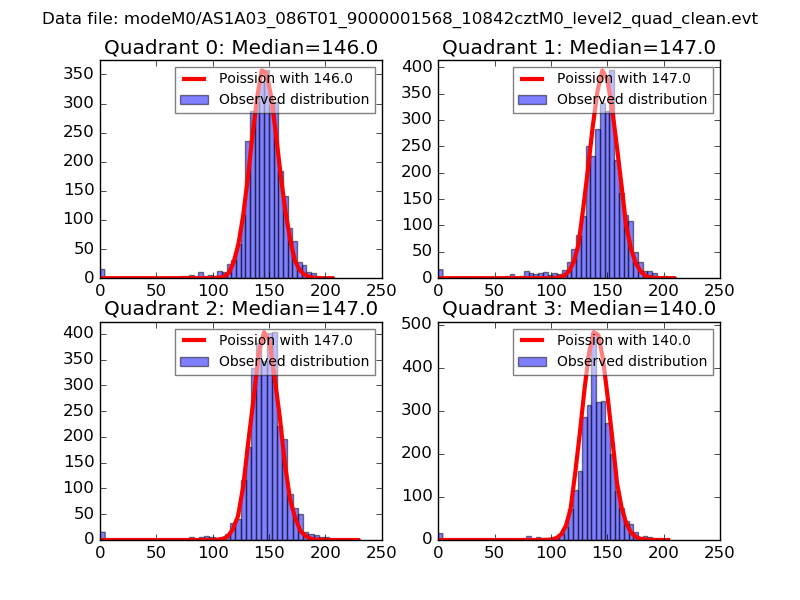 |
 |
| Quadrant-wise count rates Data is divided into 100 sec bins |
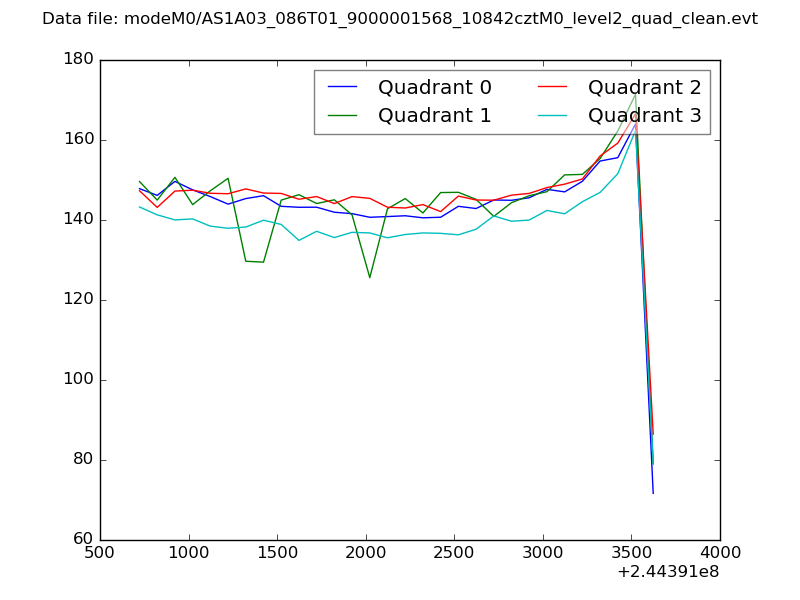 |
|
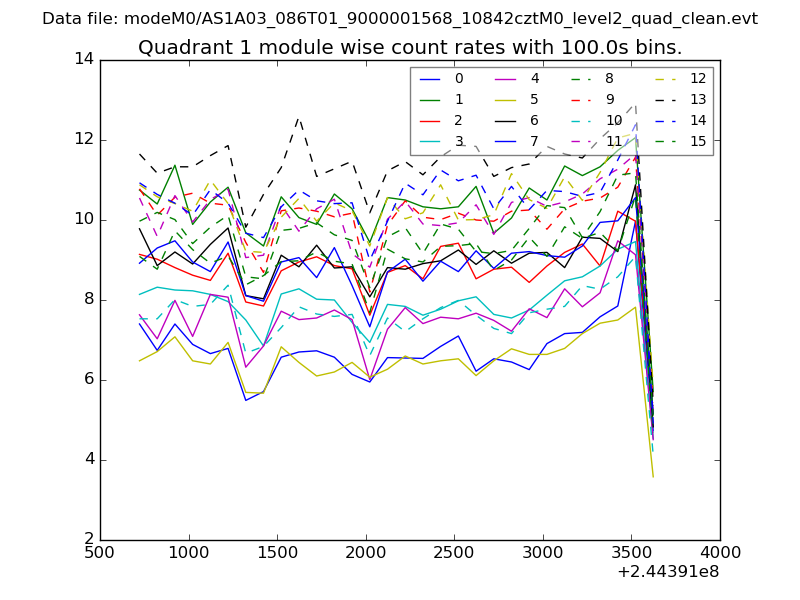
| Module-wise count rates for Quadrant A Data is divided into 100 sec bins |
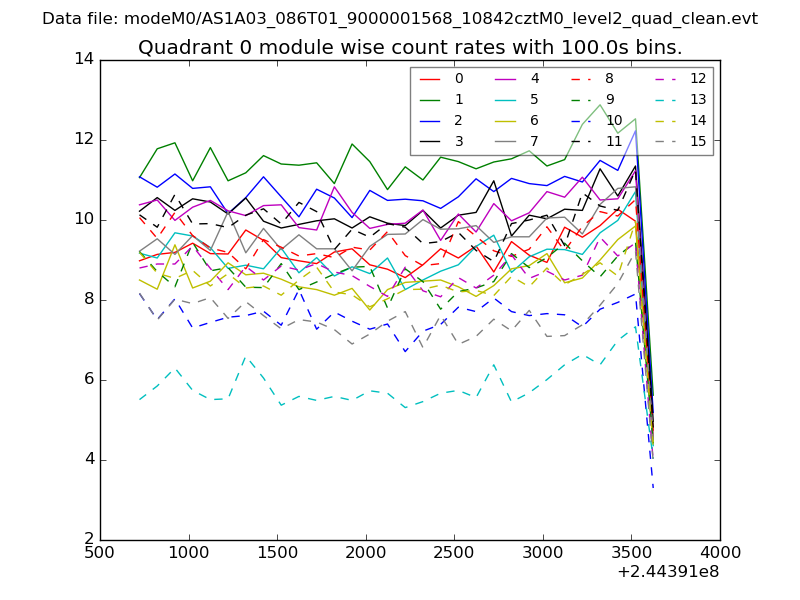 |
 |
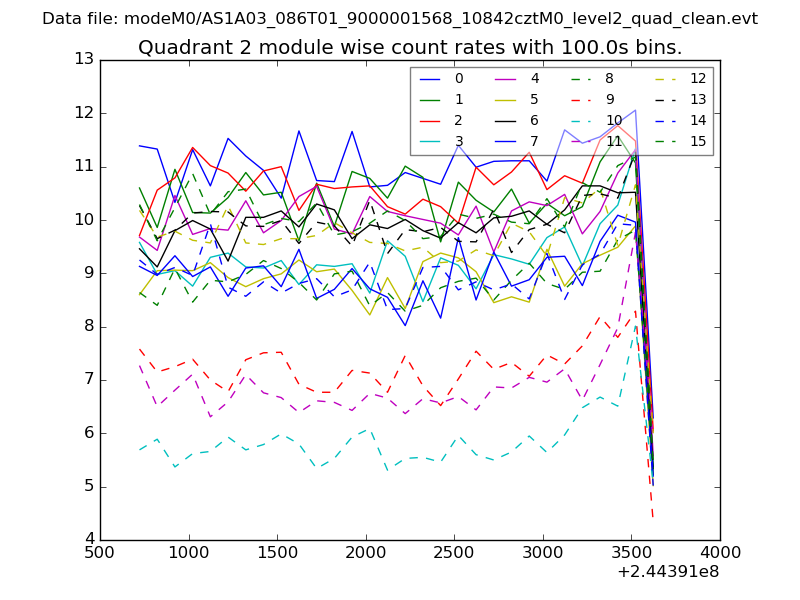
| Module-wise count rates for Quadrant B Data is divided into 100 sec bins |
 |
 |
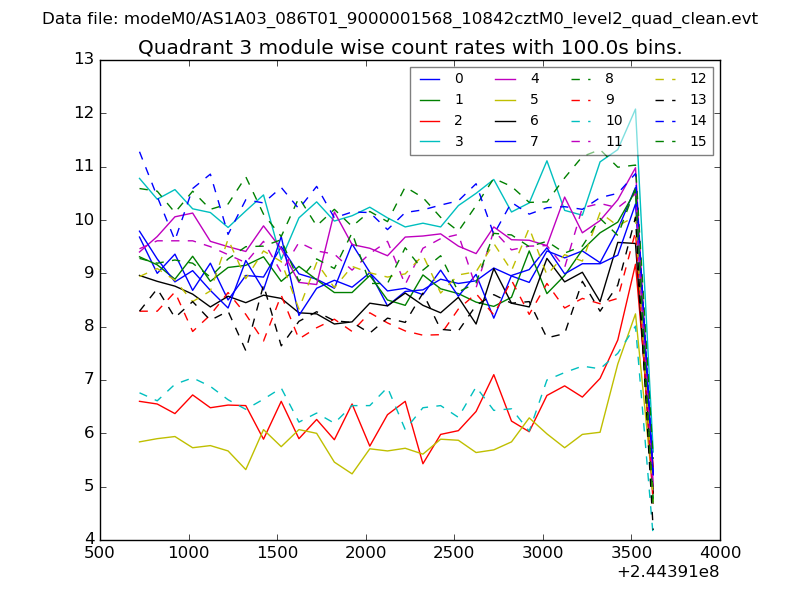
| Module-wise count rates for Quadrant C Data is divided into 100 sec bins |
 |
 |
| Module-wise count rates for Quadrant D Data is divided into 100 sec bins |
 |
 |
| Parameter | Plot |
|---|---|
| CZT HV Monitor | 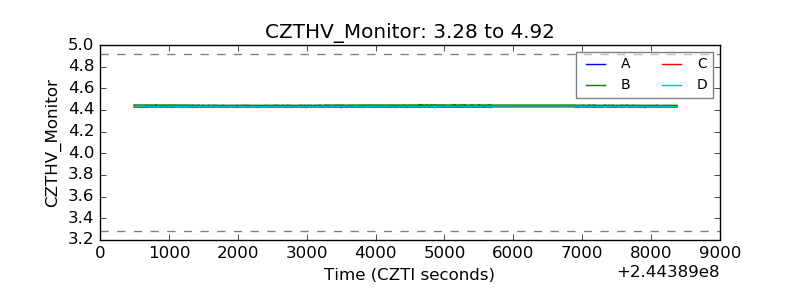 |
| D_VDD | 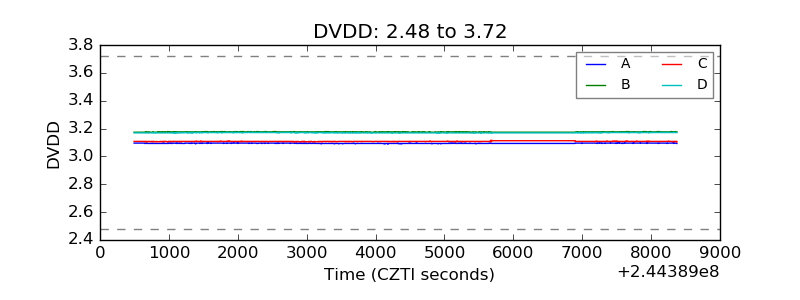 |
| Temperature 1 | 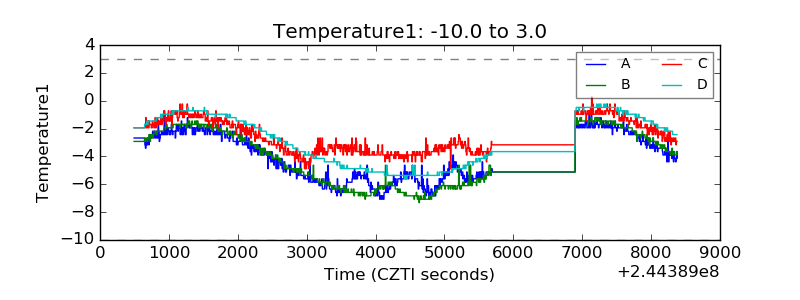 |
| Veto HV Monitor | 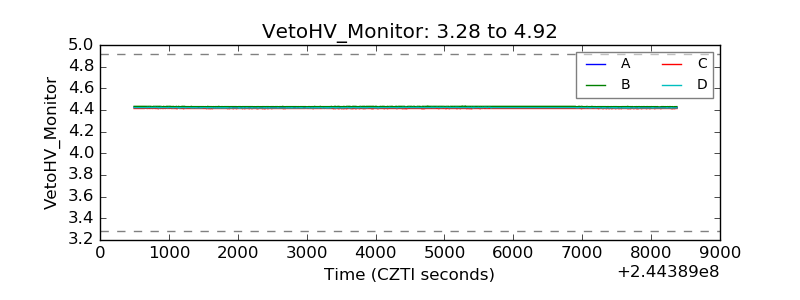 |
| Veto LLD | 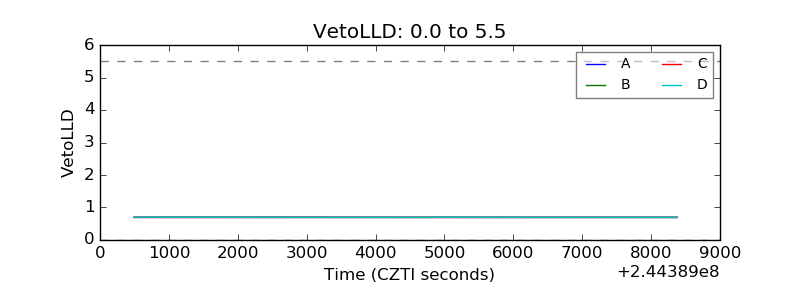 |
| Alpha Counter | 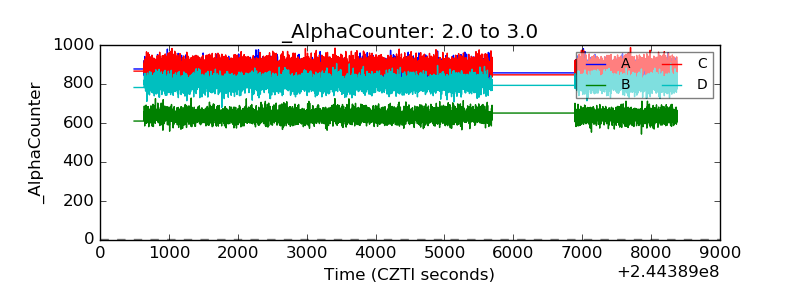 |
| _CPM_Rate |  |
| CZT Counter |  |
| +2.5 Volts monitor |  |
| +5 Volts monitor |  |
| _ROLL_ROT | 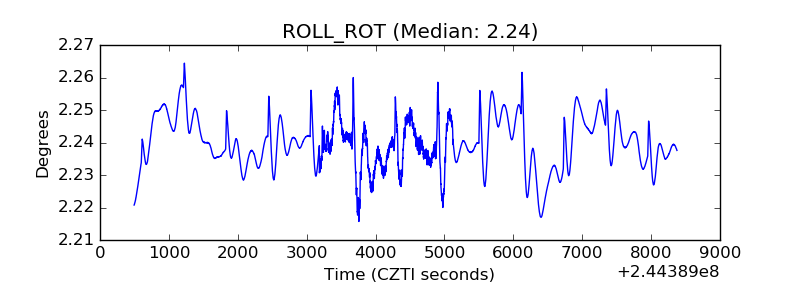 |
| _Roll_DEC | 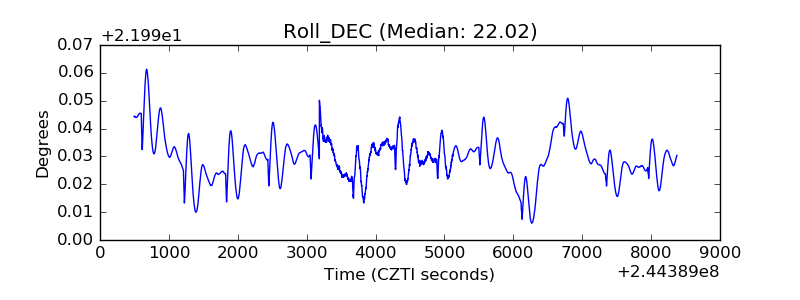 |
| _Roll_RA |  |
| Veto Counter | 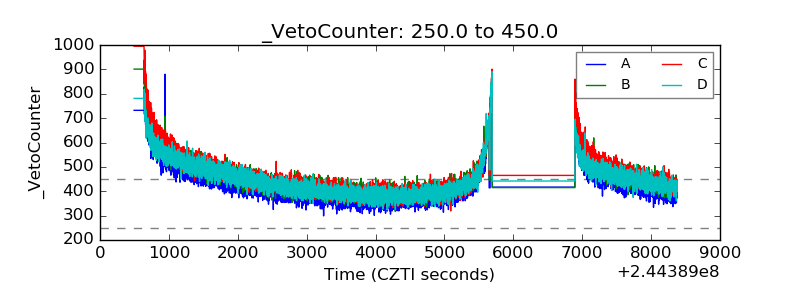 |