| Param | Original file | Final file |
|---|---|---|
| Filename | modeM0/AS1A03_086T01_9000001568_10843cztM0_level2.evt | modeM0/AS1A03_086T01_9000001568_10843cztM0_level2_quad_clean.evt |
| Size (bytes) | 484,050,240 | 68,374,080 |
| Size | 461.6 MB | 65.2 MB |
| Events in quadrant A | 3,622,163 | 412,008 |
| Events in quadrant B | 3,783,821 | 420,795 |
| Events in quadrant C | 2,864,695 | 435,194 |
| Events in quadrant D | 3,995,559 | 397,785 |
| Mode M9 | |||
|---|---|---|---|
| Quadrant | BADHDUFLAG | Total packets | Discarded packets |
| A | 0 | 20 | 1 |
| B | 0 | 20 | 1 |
| C | 0 | 20 | 2 |
| D | 0 | 21 | 0 |
| Mode SS | |||
|---|---|---|---|
| Quadrant | BADHDUFLAG | Total packets | Discarded packets |
| A | 0 | 132 | 14 |
| B | 0 | 132 | 8 |
| C | 0 | 132 | 16 |
| D | 0 | 132 | 12 |
| Mode M0 | |||
|---|---|---|---|
| Quadrant | BADHDUFLAG | Total packets | Discarded packets |
| A | 0 | 16801 | 2250 |
| B | 0 | 17369 | 2478 |
| C | 0 | 13663 | 1523 |
| D | 0 | 18218 | 2491 |
| Quadrant | Total seconds | Saturated seconds | Saturation percentage |
|---|---|---|---|
| A | 5717 | 164 | 2.868637% |
| B | 5784 | 253 | 4.374136% |
| C | 5842 | 52 | 0.890106% |
| D | 5744 | 290 | 5.048747% |
Noise dominated data is calculated using 1-second bins in cleaned event files. If a bin has >2000 counts, and if more than 50% of those come from <1% of pixels, then it is considered to be noise-dominated and hence unusable.
| Quadrant | # 1 sec bins | Bins with >0 counts | Bins with >2000 counts | High rate bins dominated by noise | Noise dominated (total time) | Noise dominated (detector-on time) | Marked lightcurve |
|---|---|---|---|---|---|---|---|
| A | 7595 | 6242 | 50 | 50 | 0.66% | 0.80% | 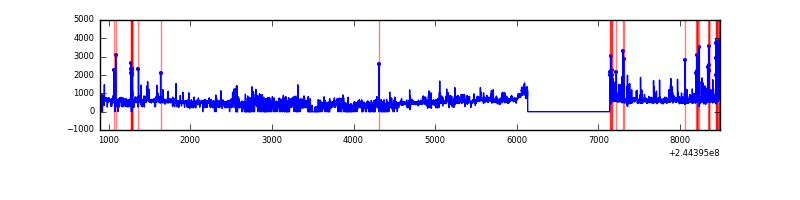 |
| B | 7596 | 6269 | 100 | 100 | 1.32% | 1.60% | 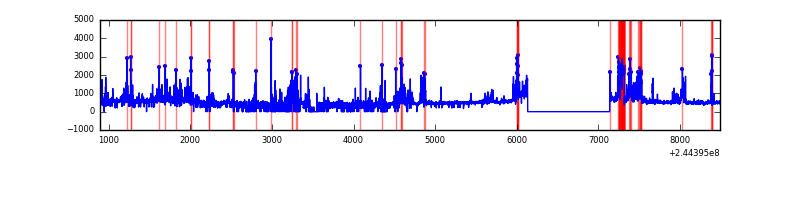 |
| C | 7596 | 6337 | 2 | 2 | 0.03% | 0.03% | 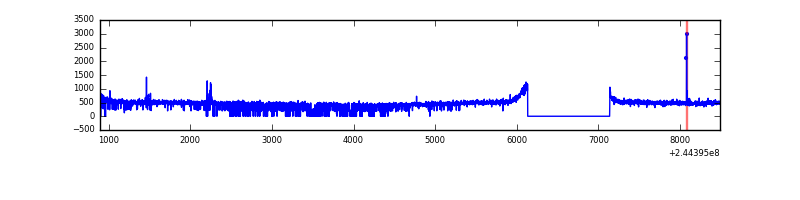 |
| D | 7596 | 6241 | 192 | 192 | 2.53% | 3.08% | 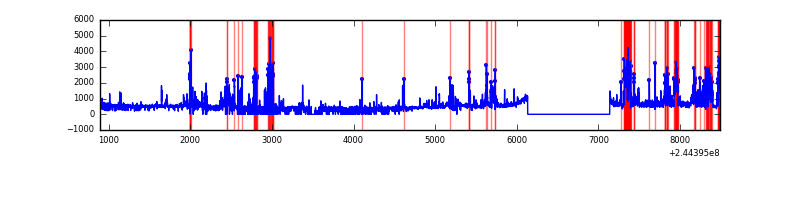 |
Top three noisy pixels from each quadrant. If the there are fewer than three noisy pixels in the level2.evt file, extra rows are filled as -1
| Pixel properties | Quadrant properties | ||||||
|---|---|---|---|---|---|---|---|
| Quadrant | DetID | PixID | Counts | Sigma | Mean | Median | Sigma |
| A | 8 | 5 | 670839 | 4531.71 | 725 | 713 | 147.9 |
| A | 13 | 251 | 83461 | 559.58 | 725 | 713 | 147.9 |
| A | 15 | 174 | 35765 | 237.04 | 725 | 713 | 147.9 |
| B | 4 | 239 | 873047 | 6230.85 | 728 | 713 | 140.0 |
| B | 4 | 173 | 17534 | 120.15 | 728 | 713 | 140.0 |
| B | 12 | 111 | 14361 | 97.48 | 728 | 713 | 140.0 |
| C | 14 | 234 | 15916 | 89.99 | 728 | 736 | 168.7 |
| C | 3 | 254 | 6159 | 32.15 | 728 | 736 | 168.7 |
| C | 13 | 61 | 5478 | 28.11 | 728 | 736 | 168.7 |
| D | 14 | 34 | 768365 | 4480.47 | 706 | 689 | 171.3 |
| D | 13 | 105 | 191761 | 1115.18 | 706 | 689 | 171.3 |
| D | 12 | 227 | 84123 | 486.96 | 706 | 689 | 171.3 |
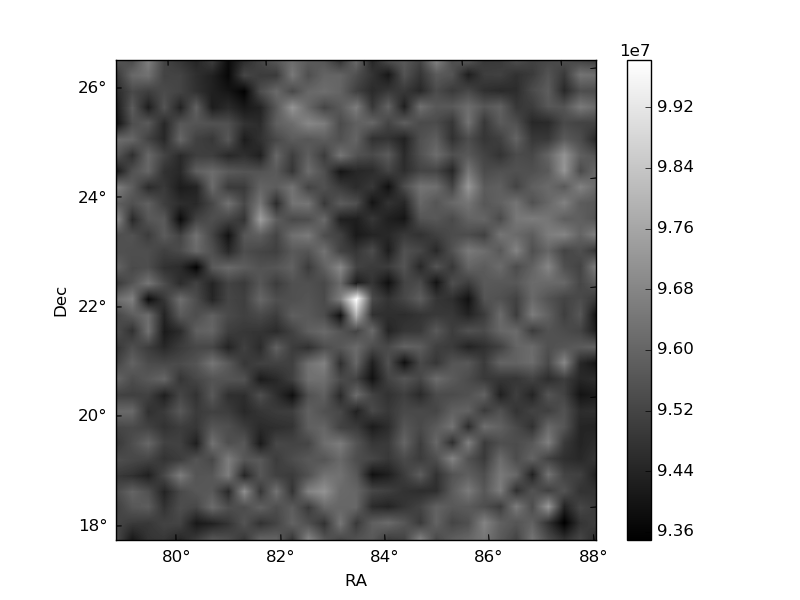
Histogram calculated using DETX and DETY for each event in the final _common_clean file
| Quadrant A | 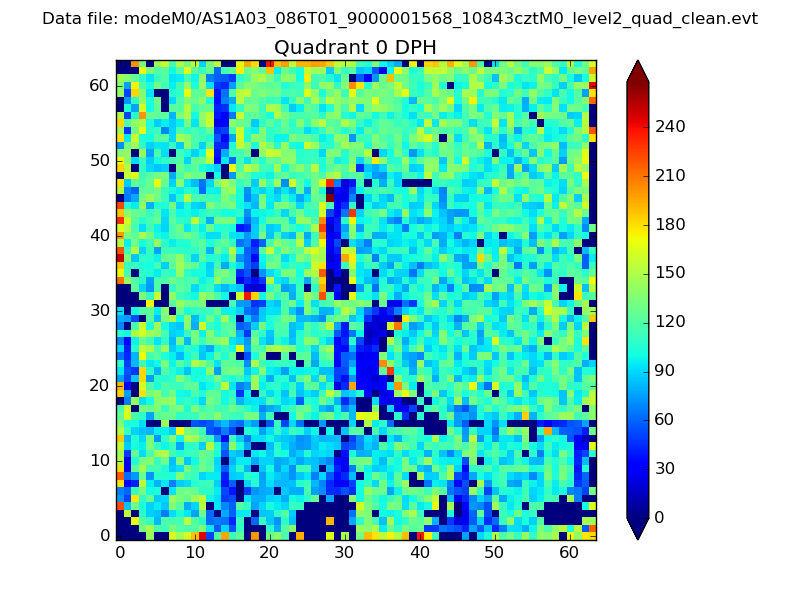 |
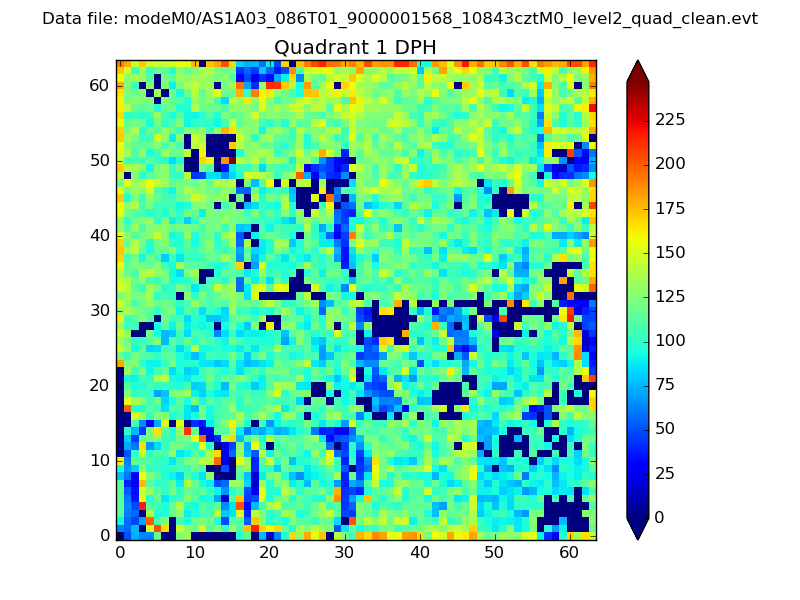 |
Quadrant B |
|---|---|---|---|
| Quadrant D | 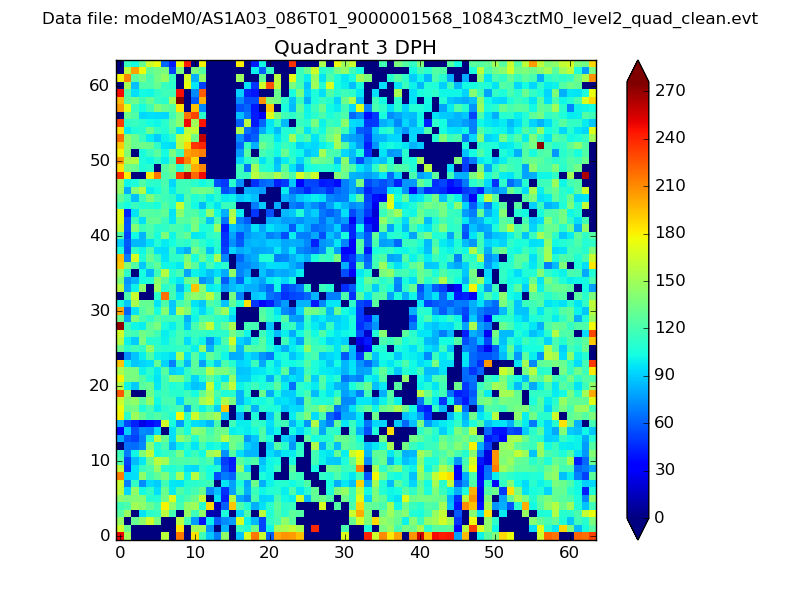 |
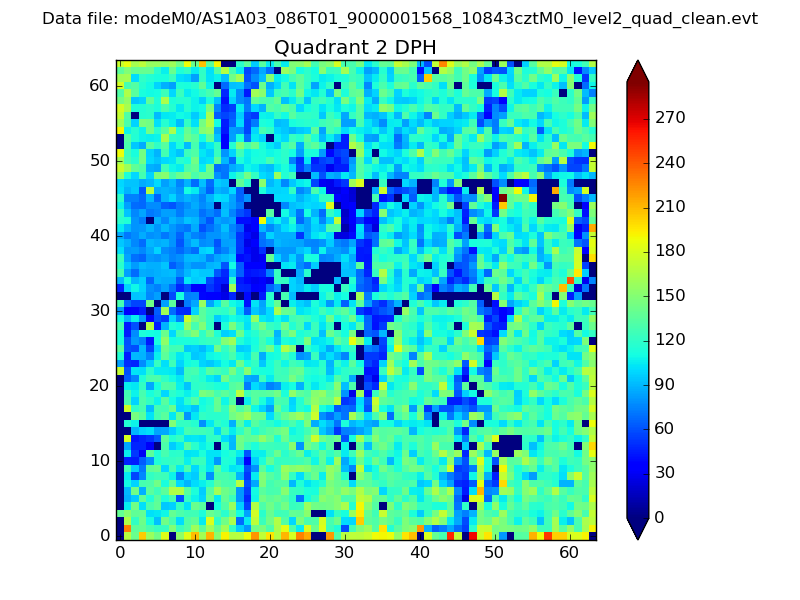 |
Quadrant C |
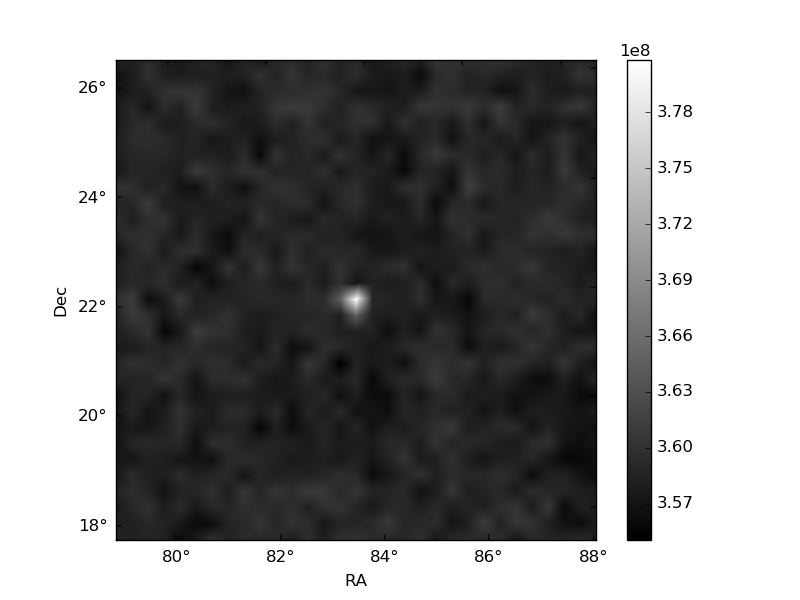
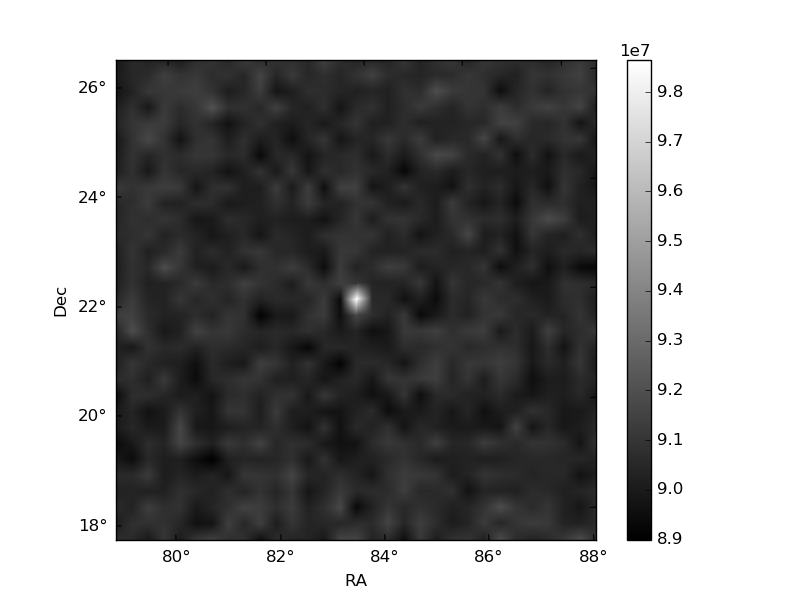
| Plot type | Count rate plots | Images |
|---|---|---|
| Comparison with Poisson distribution Blue bars denote a histogram of data divided into 1 sec bins. Red curve is a Poisson curve with rate = median count rate of data. |
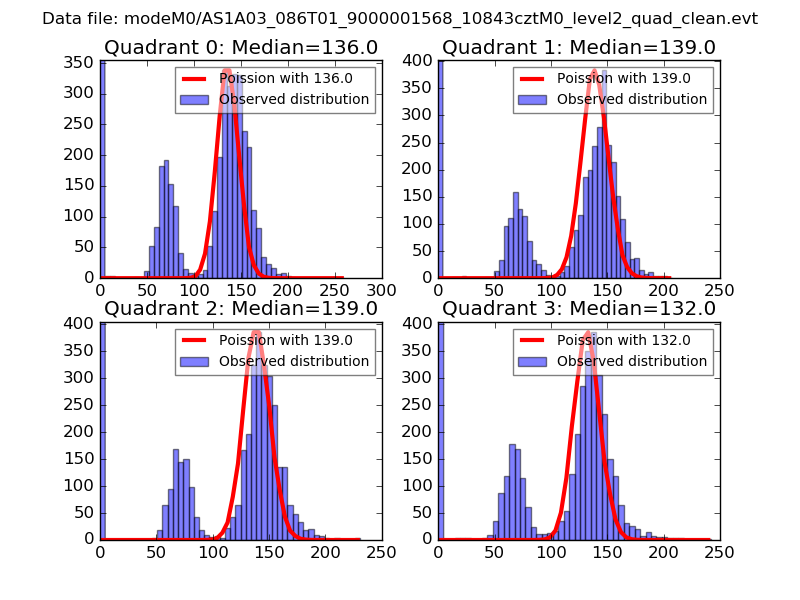 |
 |
| Quadrant-wise count rates Data is divided into 100 sec bins |
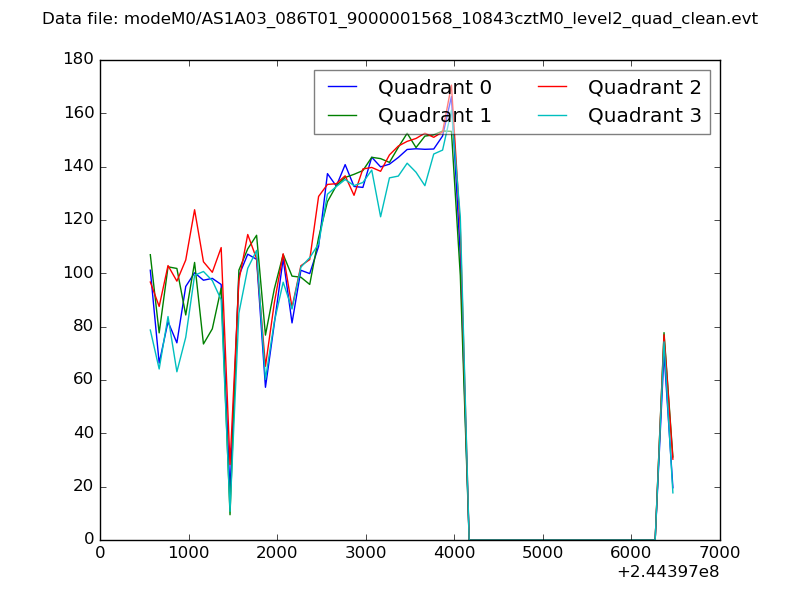 |
|
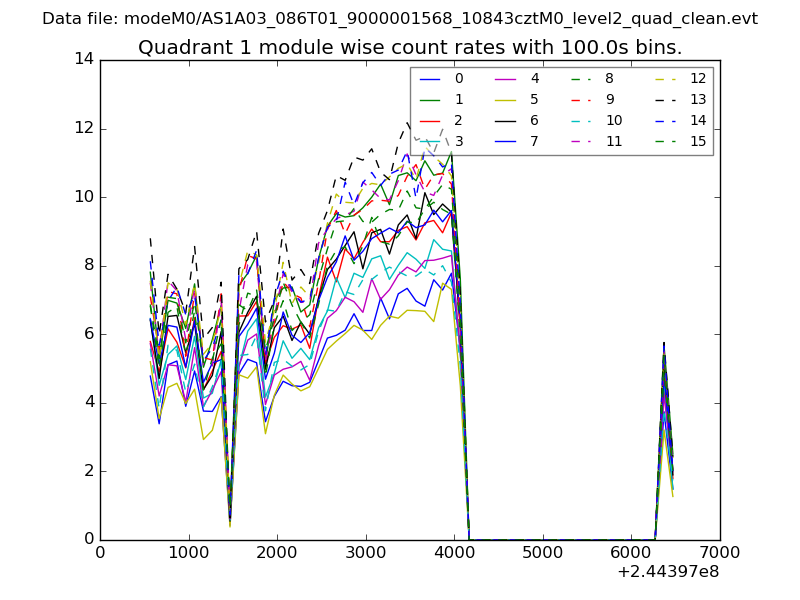
| Module-wise count rates for Quadrant A Data is divided into 100 sec bins |
 |
 |
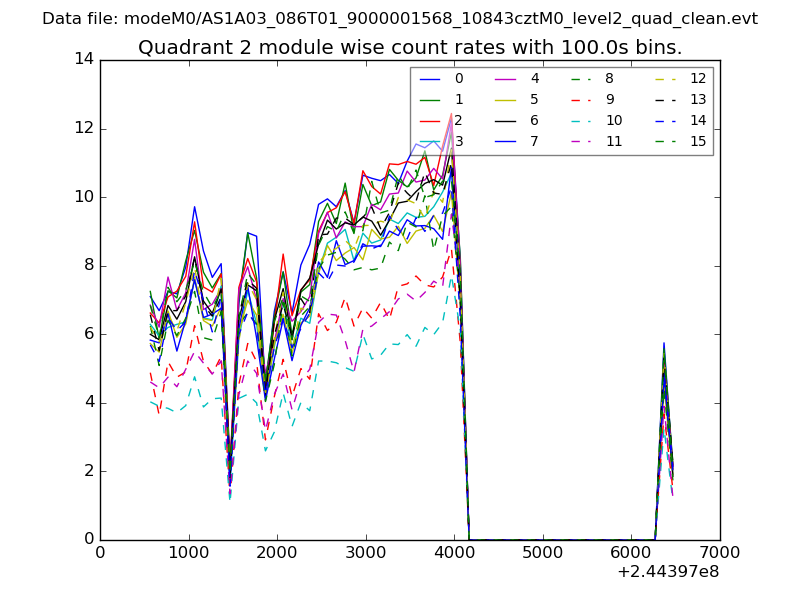
| Module-wise count rates for Quadrant B Data is divided into 100 sec bins |
 |
 |
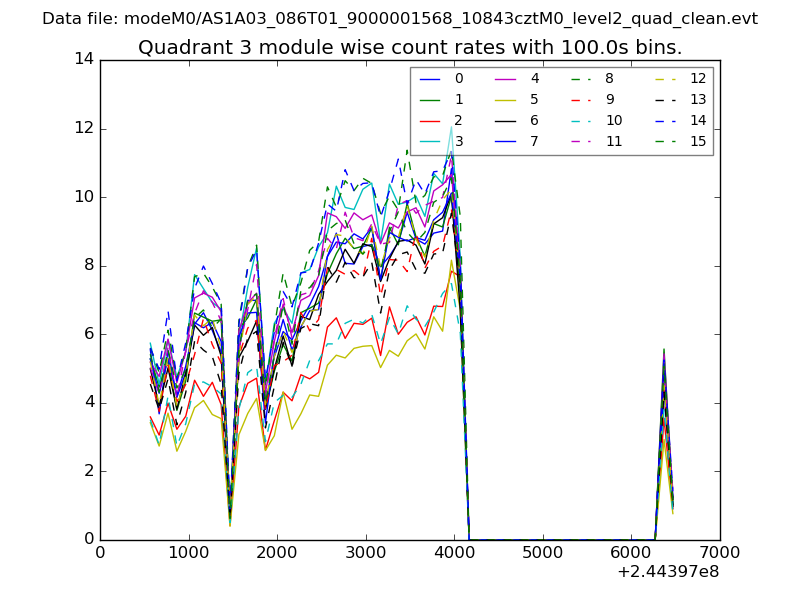
| Module-wise count rates for Quadrant C Data is divided into 100 sec bins |
 |
 |
| Module-wise count rates for Quadrant D Data is divided into 100 sec bins |
 |
 |
| Parameter | Plot |
|---|---|
| CZT HV Monitor | 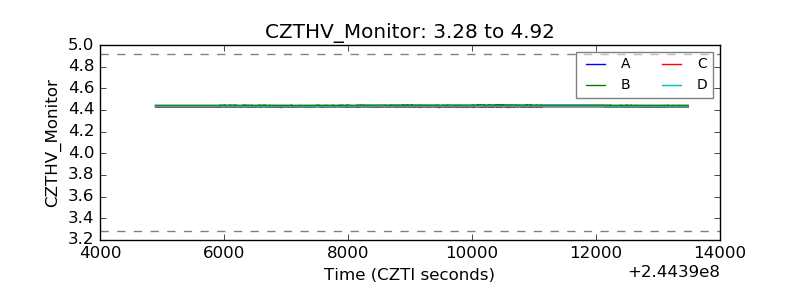 |
| D_VDD | 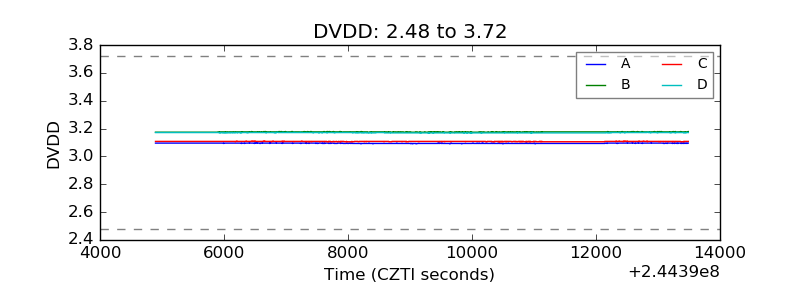 |
| Temperature 1 | 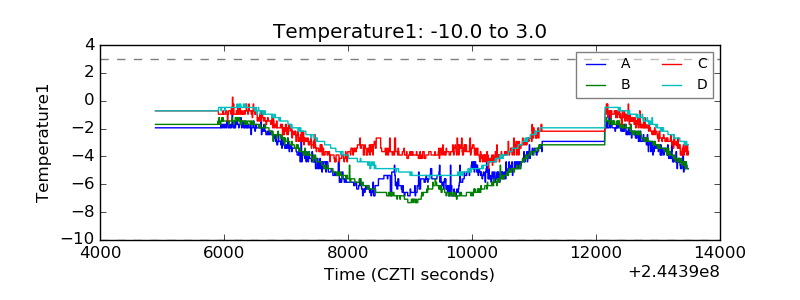 |
| Veto HV Monitor | 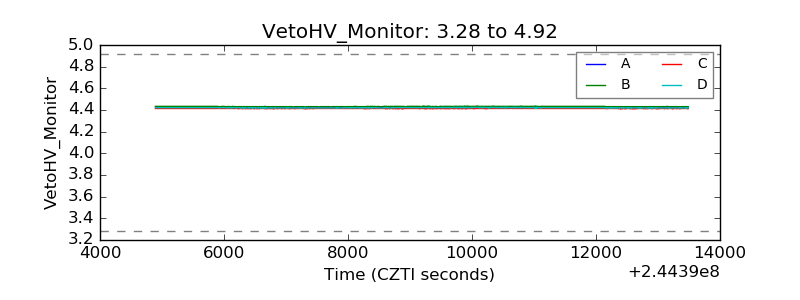 |
| Veto LLD |  |
| Alpha Counter | 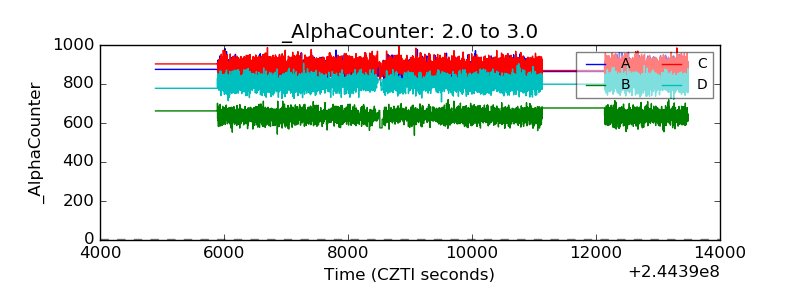 |
| _CPM_Rate | 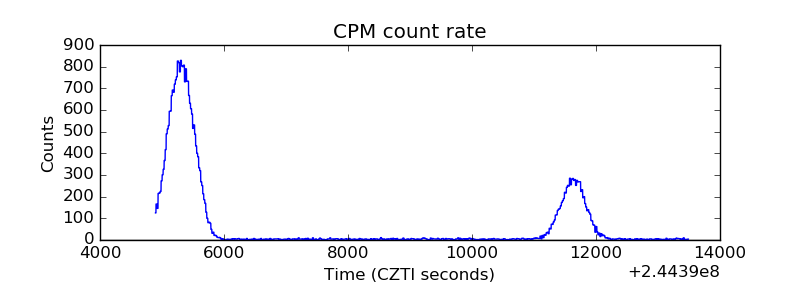 |
| CZT Counter | 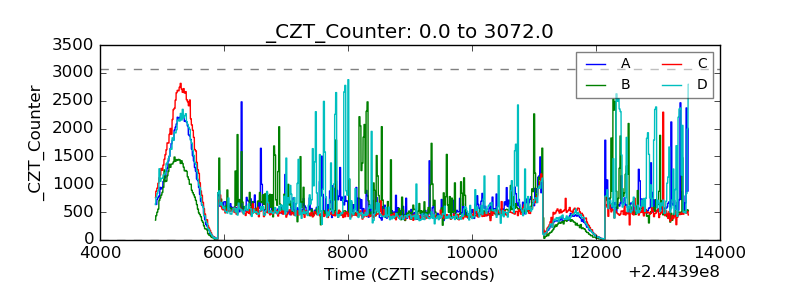 |
| +2.5 Volts monitor |  |
| +5 Volts monitor | 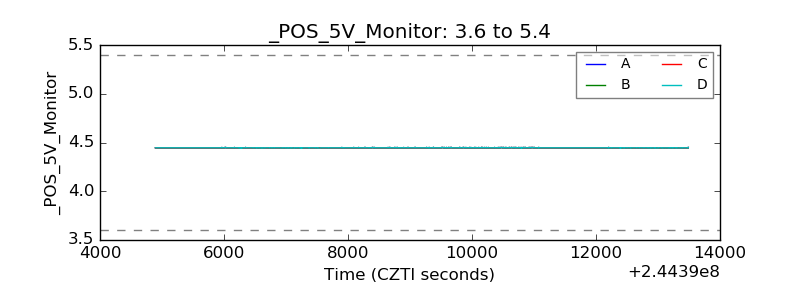 |
| _ROLL_ROT | 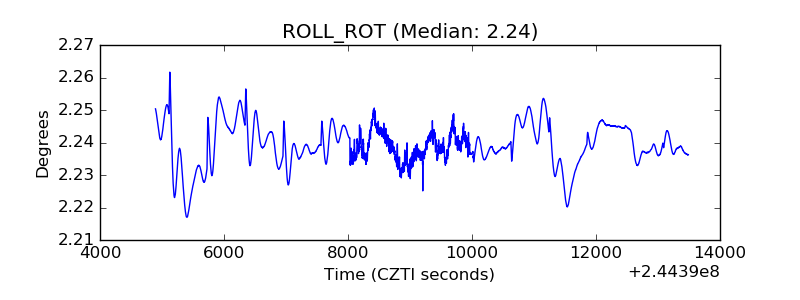 |
| _Roll_DEC | 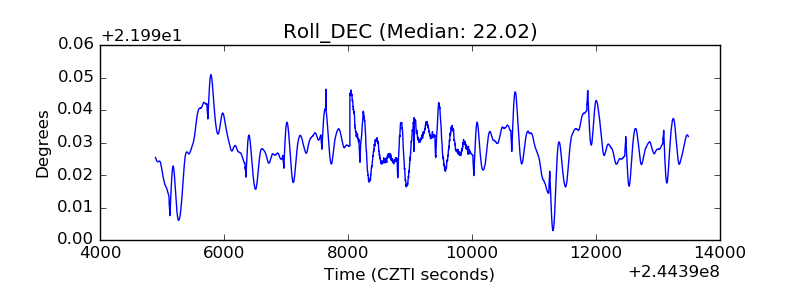 |
| _Roll_RA | 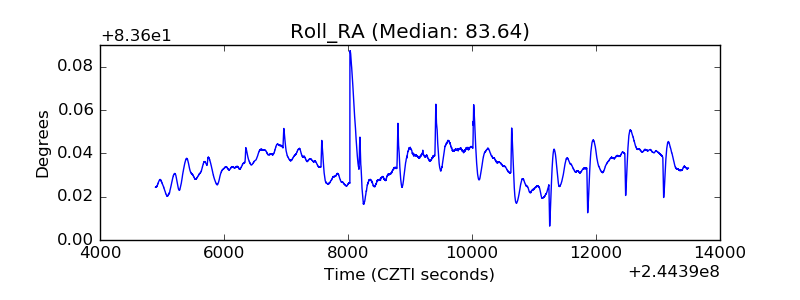 |
| Veto Counter |  |