| Param | Original file | Final file |
|---|---|---|
| Filename | modeM0/AS1A03_086T01_9000001568_10844cztM0_level2.evt | modeM0/AS1A03_086T01_9000001568_10844cztM0_level2_quad_clean.evt |
| Size (bytes) | 617,506,560 | 86,483,520 |
| Size | 588.9 MB | 82.5 MB |
| Events in quadrant A | 6,256,802 | 485,143 |
| Events in quadrant B | 4,531,661 | 566,587 |
| Events in quadrant C | 3,096,841 | 576,640 |
| Events in quadrant D | 4,374,426 | 535,583 |
| Mode M9 | |||
|---|---|---|---|
| Quadrant | BADHDUFLAG | Total packets | Discarded packets |
| A | 0 | 6 | 0 |
| B | 0 | 6 | 0 |
| C | 0 | 6 | 0 |
| D | 0 | 6 | 0 |
| Mode SS | |||
|---|---|---|---|
| Quadrant | BADHDUFLAG | Total packets | Discarded packets |
| A | 0 | 134 | 2 |
| B | 0 | 134 | 2 |
| C | 0 | 134 | 0 |
| D | 0 | 134 | 0 |
| Mode M0 | |||
|---|---|---|---|
| Quadrant | BADHDUFLAG | Total packets | Discarded packets |
| A | 0 | 23381 | 390 |
| B | 0 | 17781 | 193 |
| C | 0 | 13596 | 95 |
| D | 0 | 17480 | 157 |
| Quadrant | Total seconds | Saturated seconds | Saturation percentage |
|---|---|---|---|
| A | 6487 | 1161 | 17.897333% |
| B | 6519 | 478 | 7.332413% |
| C | 6530 | 44 | 0.673813% |
| D | 6515 | 271 | 4.159632% |
Noise dominated data is calculated using 1-second bins in cleaned event files. If a bin has >2000 counts, and if more than 50% of those come from <1% of pixels, then it is considered to be noise-dominated and hence unusable.
| Quadrant | # 1 sec bins | Bins with >0 counts | Bins with >2000 counts | High rate bins dominated by noise | Noise dominated (total time) | Noise dominated (detector-on time) | Marked lightcurve |
|---|---|---|---|---|---|---|---|
| A | 7193 | 6550 | 797 | 797 | 11.08% | 12.17% | 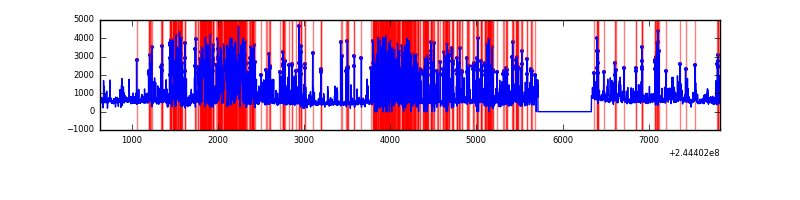 |
| B | 7193 | 6571 | 220 | 220 | 3.06% | 3.35% | 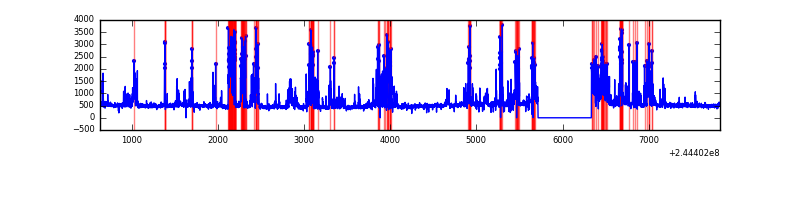 |
| C | 7193 | 6573 | 4 | 4 | 0.06% | 0.06% | 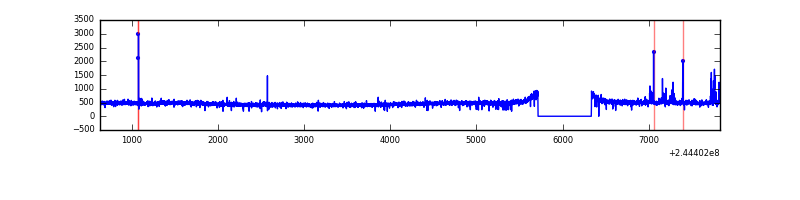 |
| D | 7193 | 6574 | 203 | 203 | 2.82% | 3.09% | 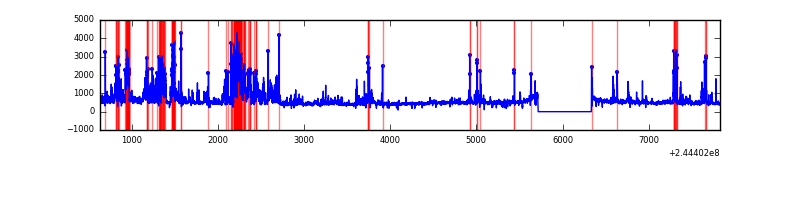 |
Top three noisy pixels from each quadrant. If the there are fewer than three noisy pixels in the level2.evt file, extra rows are filled as -1
| Pixel properties | Quadrant properties | ||||||
|---|---|---|---|---|---|---|---|
| Quadrant | DetID | PixID | Counts | Sigma | Mean | Median | Sigma |
| A | 8 | 5 | 3321352 | 22596.14 | 716 | 702 | 147.0 |
| A | 13 | 251 | 127305 | 861.5 | 716 | 702 | 147.0 |
| A | 3 | 1 | 19298 | 126.54 | 716 | 702 | 147.0 |
| B | 4 | 239 | 1391121 | 9367.63 | 776 | 760 | 148.4 |
| B | 0 | 219 | 40017 | 264.5 | 776 | 760 | 148.4 |
| B | 0 | 214 | 30739 | 201.99 | 776 | 760 | 148.4 |
| C | 15 | 48 | 52033 | 283.16 | 778 | 785 | 181.0 |
| C | 14 | 234 | 11564 | 59.56 | 778 | 785 | 181.0 |
| C | 13 | 61 | 5749 | 27.43 | 778 | 785 | 181.0 |
| D | 14 | 34 | 1122713 | 6069.33 | 763 | 743 | 184.9 |
| D | 13 | 104 | 91209 | 489.38 | 763 | 743 | 184.9 |
| D | 12 | 233 | 88796 | 476.33 | 763 | 743 | 184.9 |
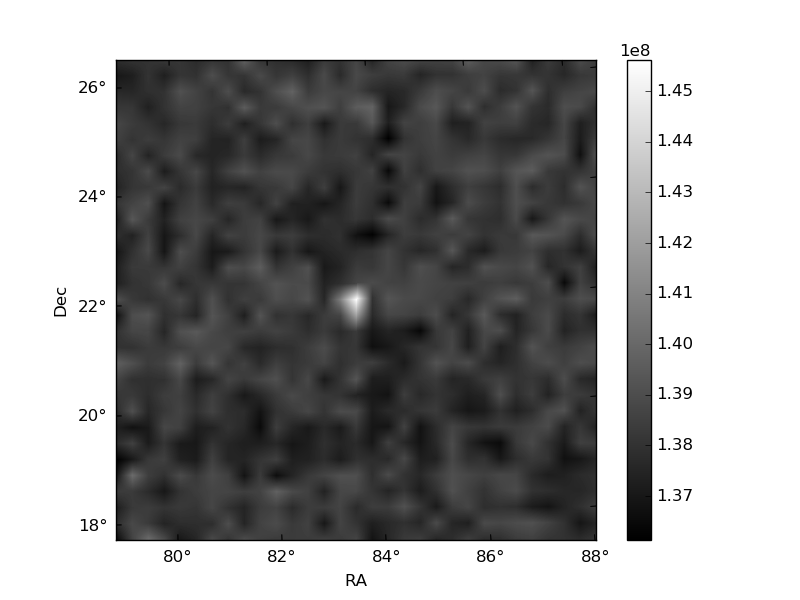
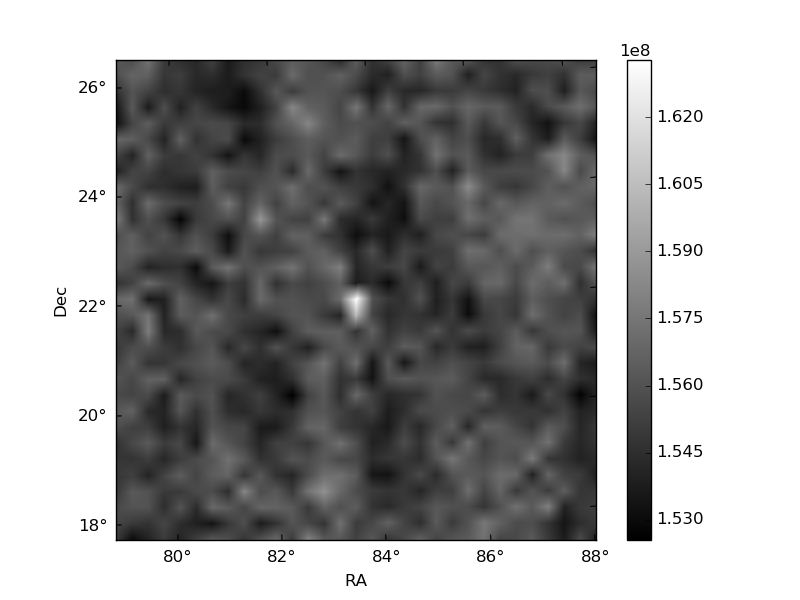
Histogram calculated using DETX and DETY for each event in the final _common_clean file
| Quadrant A | 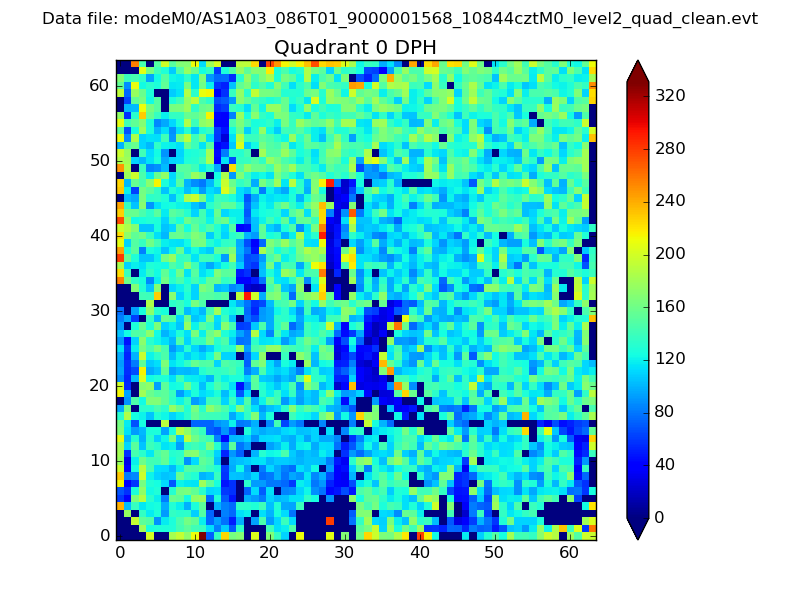 |
 |
Quadrant B |
|---|---|---|---|
| Quadrant D |  |
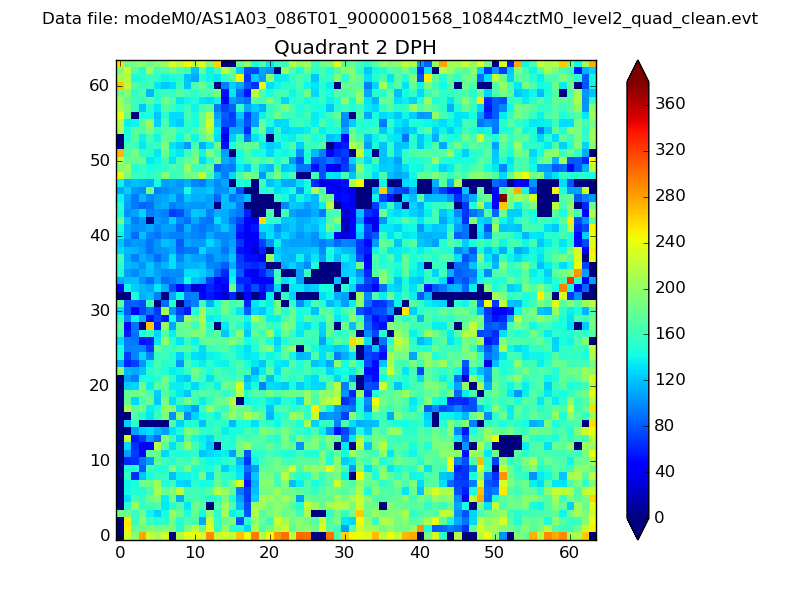 |
Quadrant C |
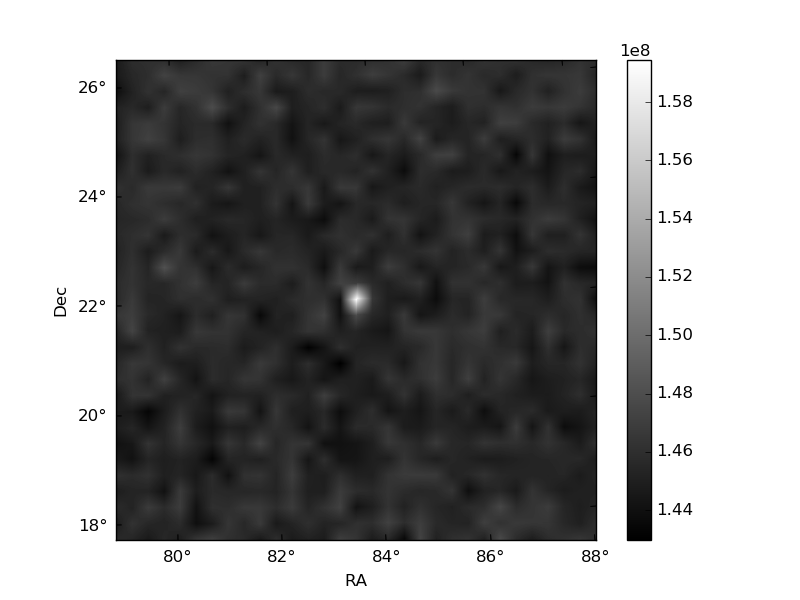
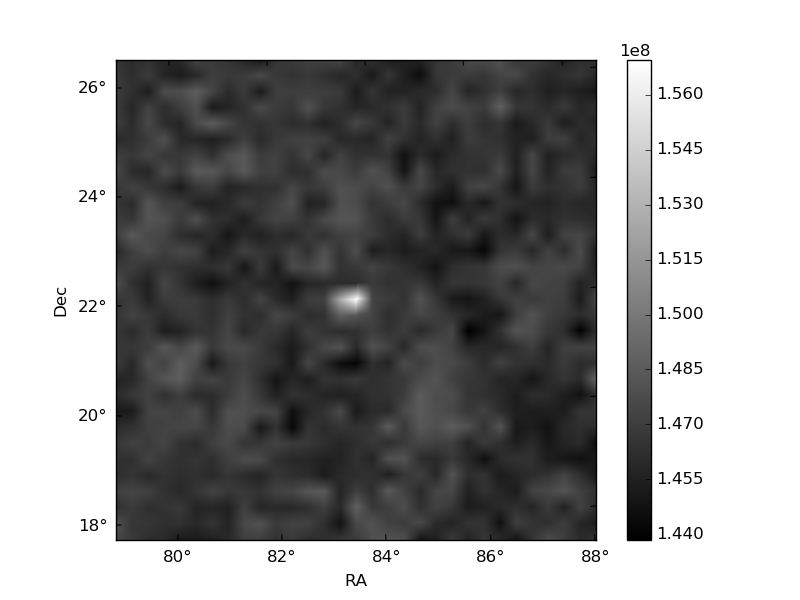
| Plot type | Count rate plots | Images |
|---|---|---|
| Comparison with Poisson distribution Blue bars denote a histogram of data divided into 1 sec bins. Red curve is a Poisson curve with rate = median count rate of data. |
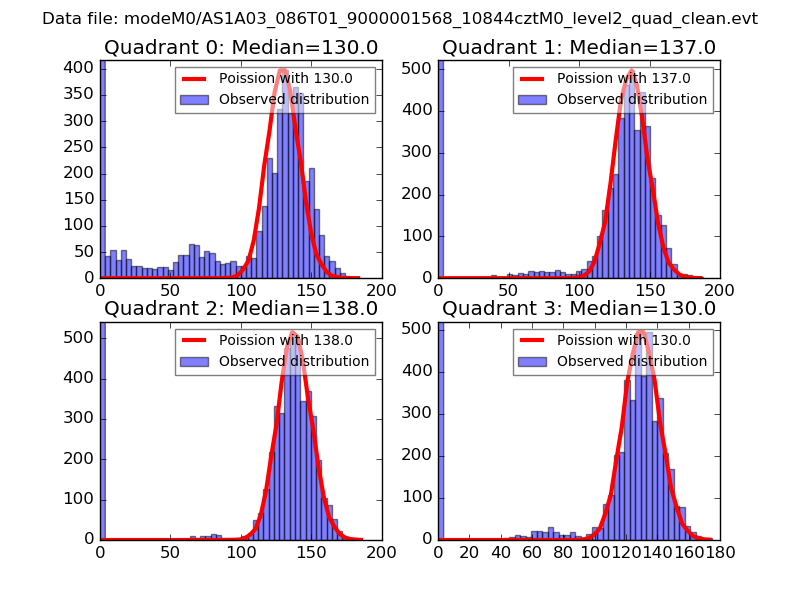 |
 |
| Quadrant-wise count rates Data is divided into 100 sec bins |
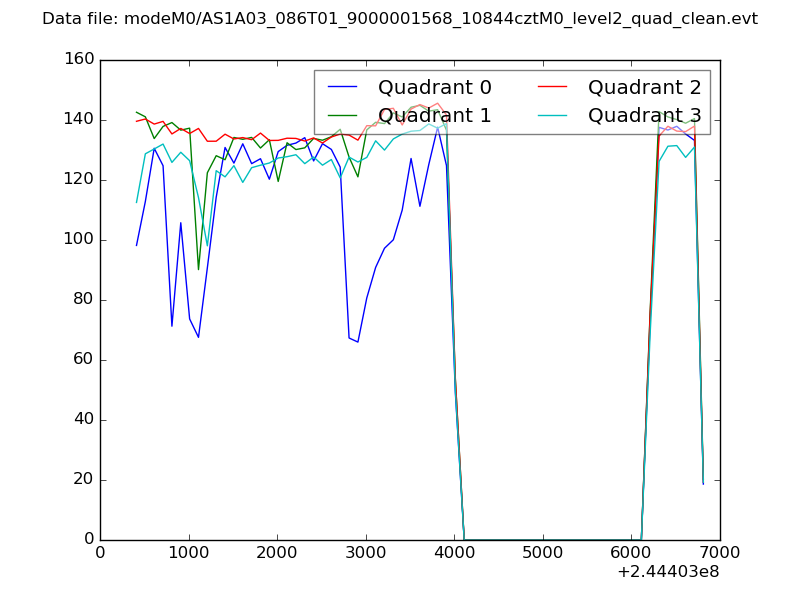 |
|
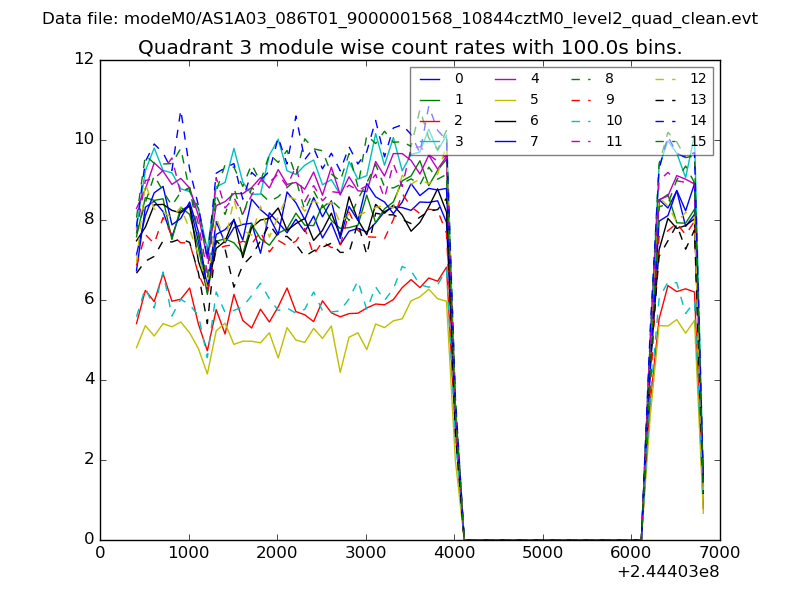
| Module-wise count rates for Quadrant A Data is divided into 100 sec bins |
 |
 |
| Module-wise count rates for Quadrant B Data is divided into 100 sec bins |
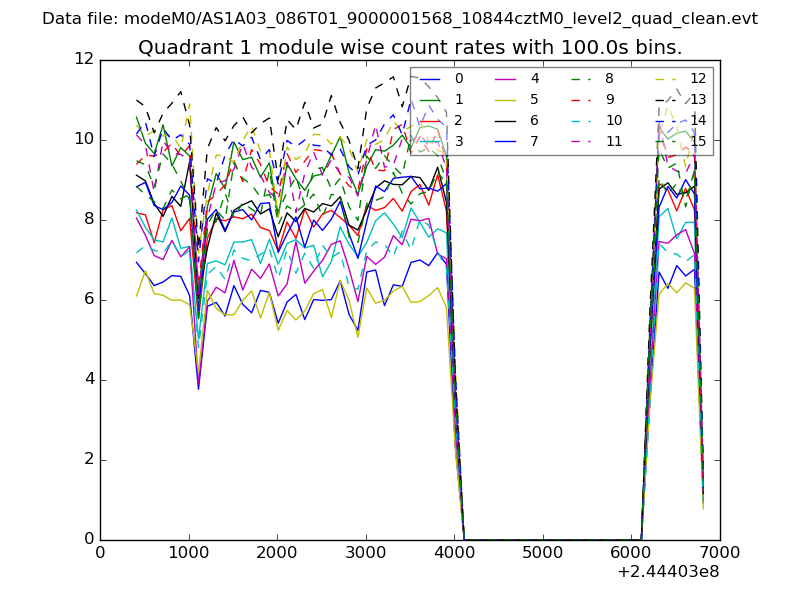 |
 |
| Module-wise count rates for Quadrant C Data is divided into 100 sec bins |
 |
 |
| Module-wise count rates for Quadrant D Data is divided into 100 sec bins |
 |
 |
| Parameter | Plot |
|---|---|
| CZT HV Monitor |  |
| D_VDD | 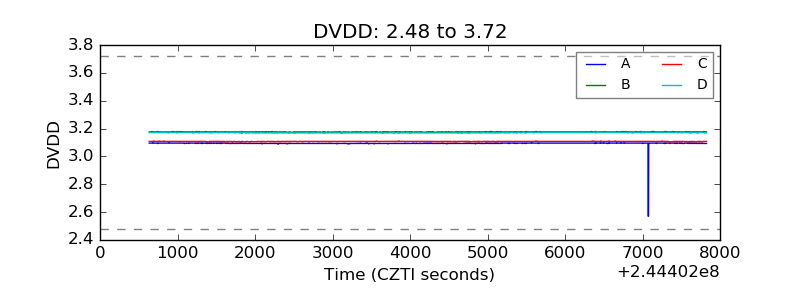 |
| Temperature 1 | 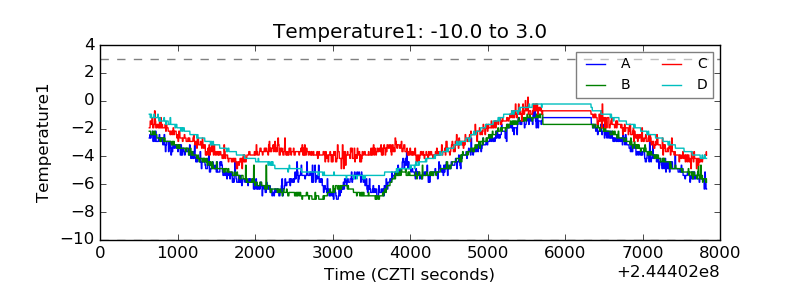 |
| Veto HV Monitor | 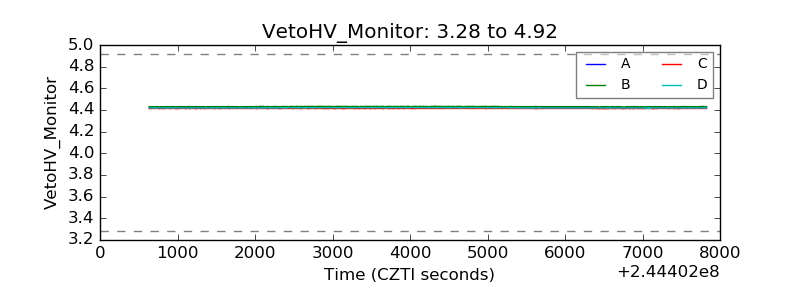 |
| Veto LLD | 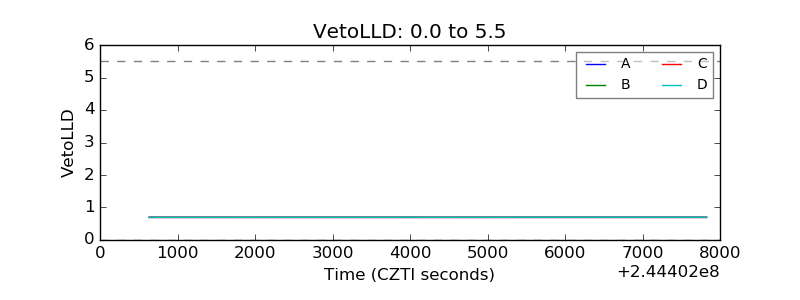 |
| Alpha Counter | 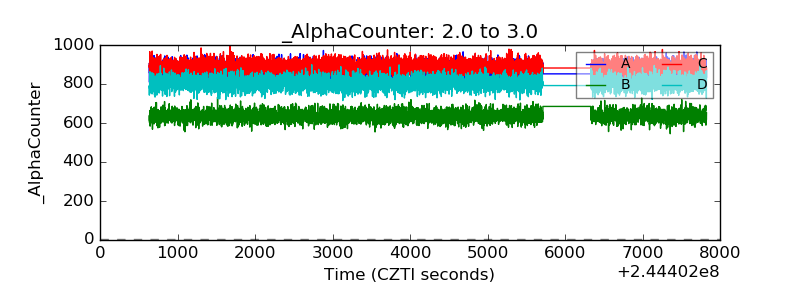 |
| _CPM_Rate | 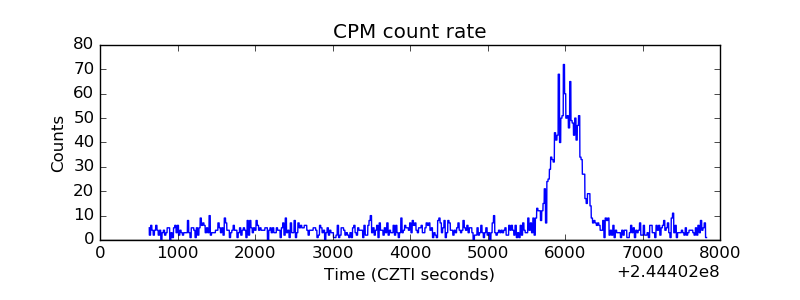 |
| CZT Counter | 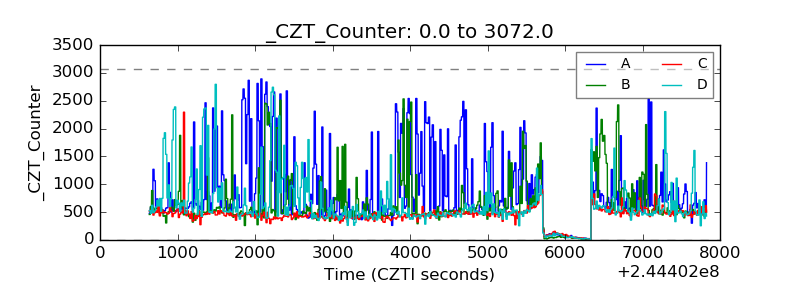 |
| +2.5 Volts monitor |  |
| +5 Volts monitor |  |
| _ROLL_ROT | 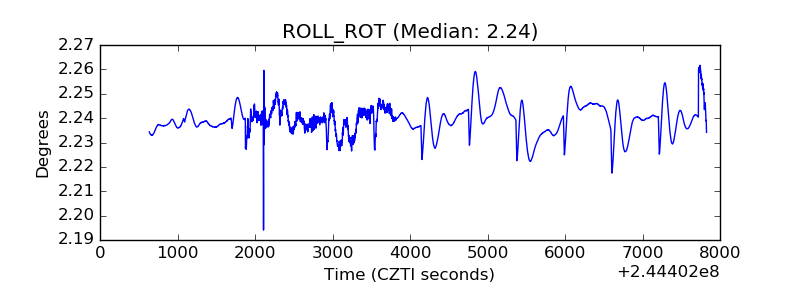 |
| _Roll_DEC | 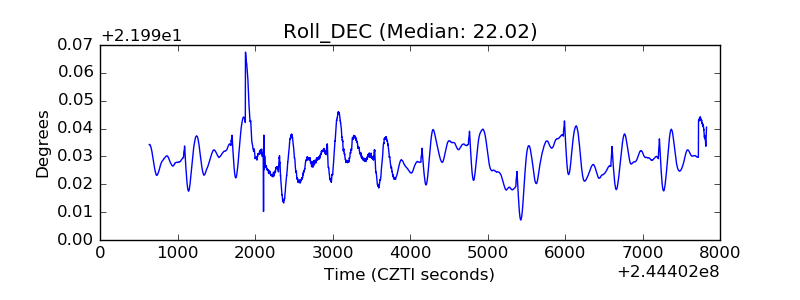 |
| _Roll_RA | 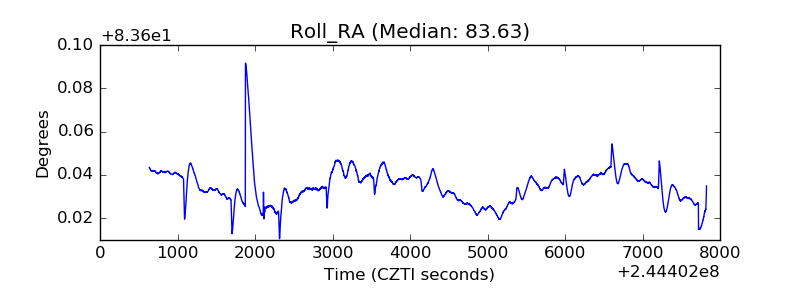 |
| Veto Counter | 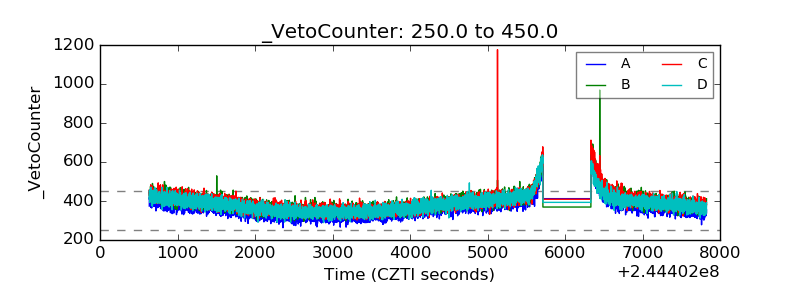 |