| Param | Original file | Final file |
|---|---|---|
| Filename | modeM0/AS1A03_086T01_9000001568_10845cztM0_level2.evt | modeM0/AS1A03_086T01_9000001568_10845cztM0_level2_quad_clean.evt |
| Size (bytes) | 636,321,600 | 95,662,080 |
| Size | 606.8 MB | 91.2 MB |
| Events in quadrant A | 6,158,862 | 570,639 |
| Events in quadrant B | 4,916,986 | 616,388 |
| Events in quadrant C | 3,568,016 | 626,146 |
| Events in quadrant D | 4,150,952 | 593,925 |
| Mode M9 | |||
|---|---|---|---|
| Quadrant | BADHDUFLAG | Total packets | Discarded packets |
| A | 0 | 2 | 0 |
| B | 0 | 2 | 0 |
| C | 0 | 2 | 0 |
| D | 0 | 2 | 0 |
| Mode SS | |||
|---|---|---|---|
| Quadrant | BADHDUFLAG | Total packets | Discarded packets |
| A | 0 | 144 | 0 |
| B | 0 | 144 | 0 |
| C | 0 | 144 | 0 |
| D | 0 | 144 | 0 |
| Mode M0 | |||
|---|---|---|---|
| Quadrant | BADHDUFLAG | Total packets | Discarded packets |
| A | 0 | 23001 | 15 |
| B | 0 | 19223 | 17 |
| C | 0 | 15310 | 8 |
| D | 0 | 17231 | 21 |
| Quadrant | Total seconds | Saturated seconds | Saturation percentage |
|---|---|---|---|
| A | 7026 | 845 | 12.026758% |
| B | 7023 | 584 | 8.315535% |
| C | 7026 | 98 | 1.394819% |
| D | 7024 | 339 | 4.826310% |
Noise dominated data is calculated using 1-second bins in cleaned event files. If a bin has >2000 counts, and if more than 50% of those come from <1% of pixels, then it is considered to be noise-dominated and hence unusable.
| Quadrant | # 1 sec bins | Bins with >0 counts | Bins with >2000 counts | High rate bins dominated by noise | Noise dominated (total time) | Noise dominated (detector-on time) | Marked lightcurve |
|---|---|---|---|---|---|---|---|
| A | 7254 | 7029 | 605 | 605 | 8.34% | 8.61% | 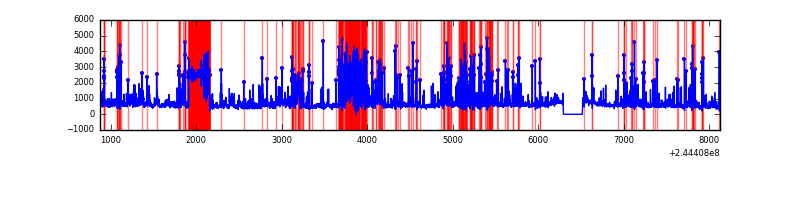 |
| B | 7254 | 7030 | 262 | 262 | 3.61% | 3.73% | 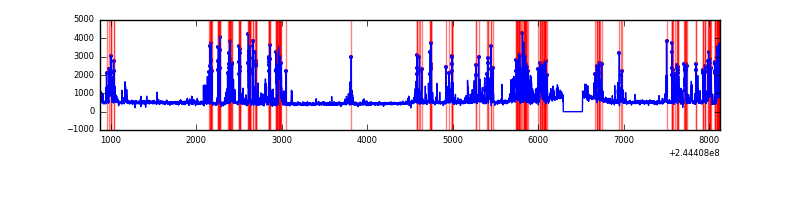 |
| C | 7254 | 7030 | 31 | 31 | 0.43% | 0.44% | 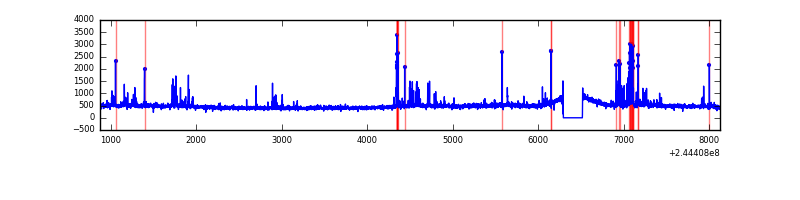 |
| D | 7254 | 7030 | 218 | 218 | 3.01% | 3.10% | 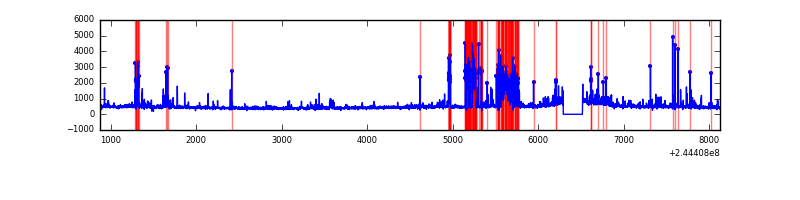 |
Top three noisy pixels from each quadrant. If the there are fewer than three noisy pixels in the level2.evt file, extra rows are filled as -1
| Pixel properties | Quadrant properties | ||||||
|---|---|---|---|---|---|---|---|
| Quadrant | DetID | PixID | Counts | Sigma | Mean | Median | Sigma |
| A | 8 | 5 | 2528281 | 15228.1 | 809 | 794 | 166.0 |
| A | 13 | 251 | 204559 | 1227.68 | 809 | 794 | 166.0 |
| A | 15 | 223 | 176976 | 1061.5 | 809 | 794 | 166.0 |
| B | 4 | 239 | 1545671 | 9518.22 | 843 | 825 | 162.3 |
| B | 0 | 219 | 31638 | 189.85 | 843 | 825 | 162.3 |
| B | 0 | 214 | 30789 | 184.62 | 843 | 825 | 162.3 |
| C | 4 | 254 | 175114 | 894.15 | 835 | 843 | 194.9 |
| C | 15 | 48 | 120517 | 614.03 | 835 | 843 | 194.9 |
| C | 14 | 234 | 7114 | 32.18 | 835 | 843 | 194.9 |
| D | 13 | 105 | 479624 | 2418.11 | 813 | 791 | 198.0 |
| D | 13 | 104 | 133905 | 672.23 | 813 | 791 | 198.0 |
| D | 12 | 233 | 94095 | 471.19 | 813 | 791 | 198.0 |
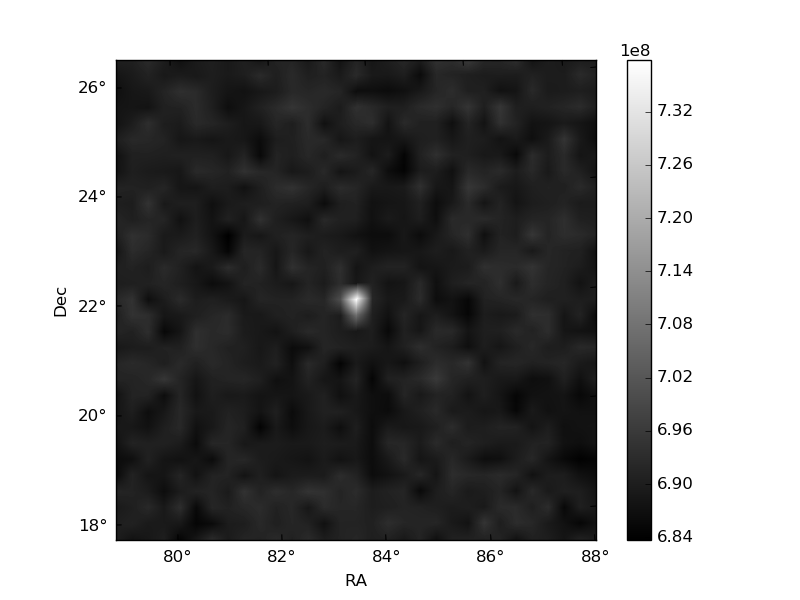
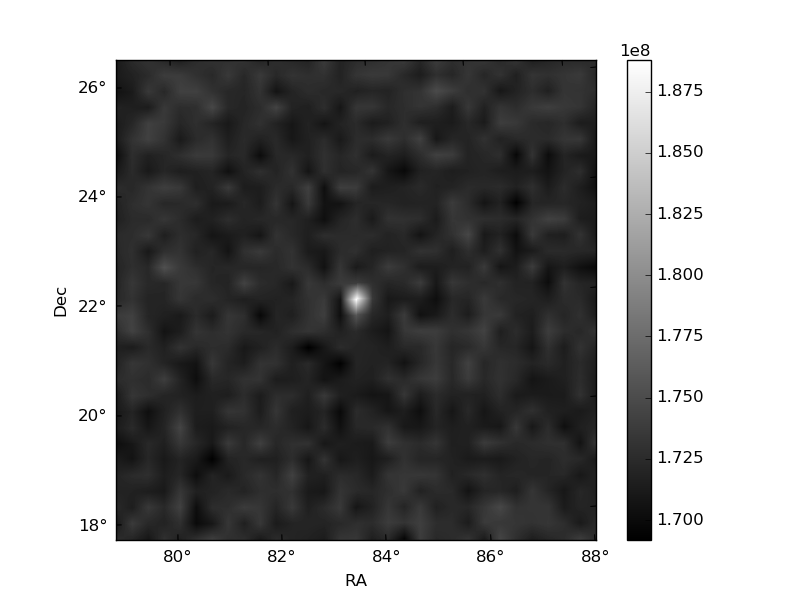
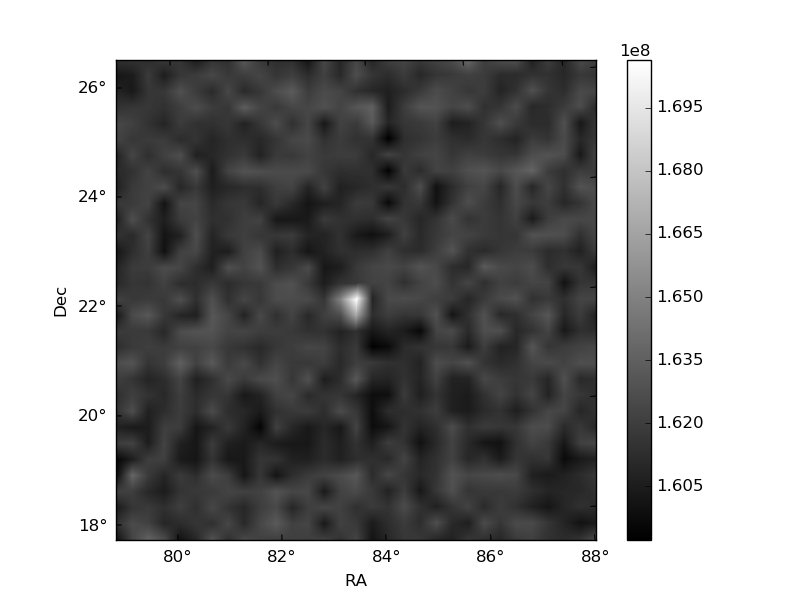
Histogram calculated using DETX and DETY for each event in the final _common_clean file
| Quadrant A | 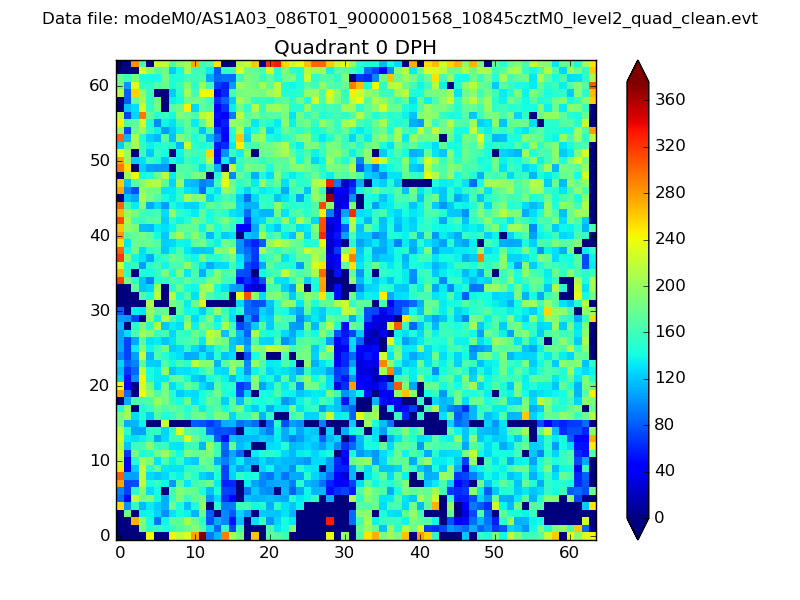 |
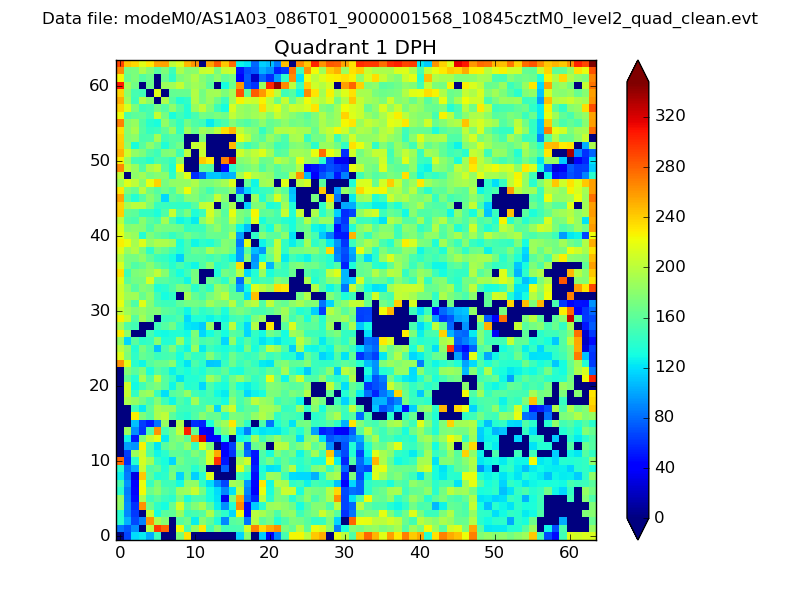 |
Quadrant B |
|---|---|---|---|
| Quadrant D | 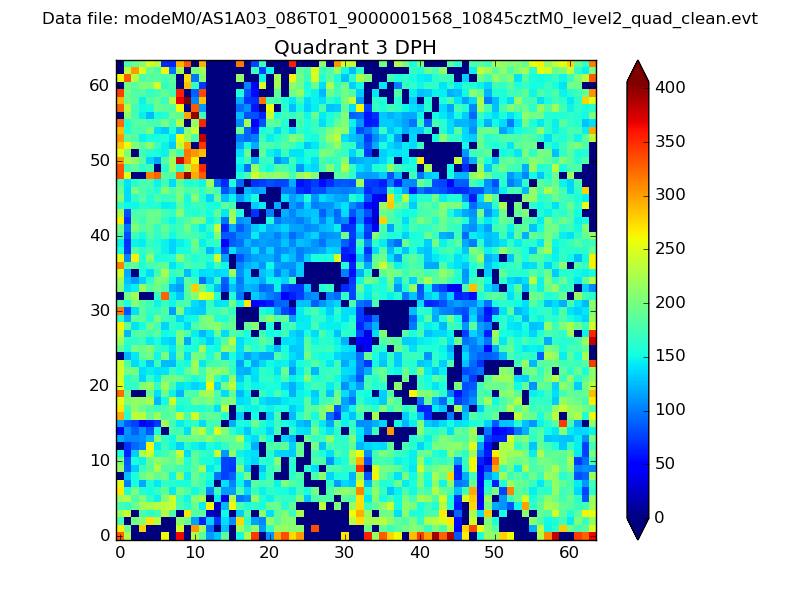 |
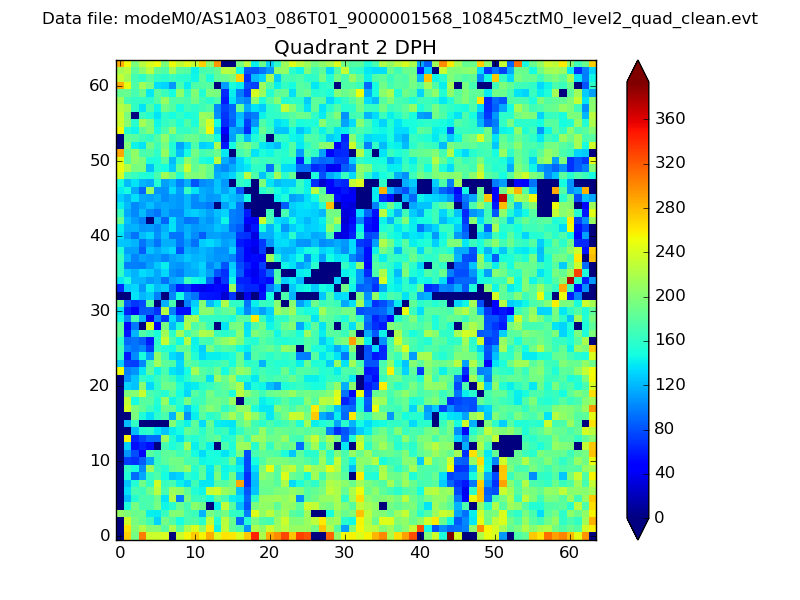 |
Quadrant C |
| Plot type | Count rate plots | Images |
|---|---|---|
| Comparison with Poisson distribution Blue bars denote a histogram of data divided into 1 sec bins. Red curve is a Poisson curve with rate = median count rate of data. |
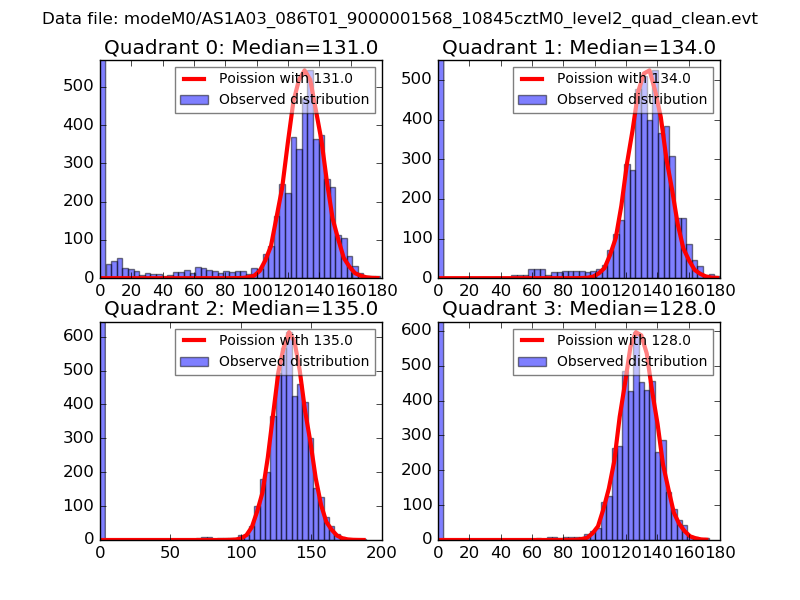 |
 |
| Quadrant-wise count rates Data is divided into 100 sec bins |
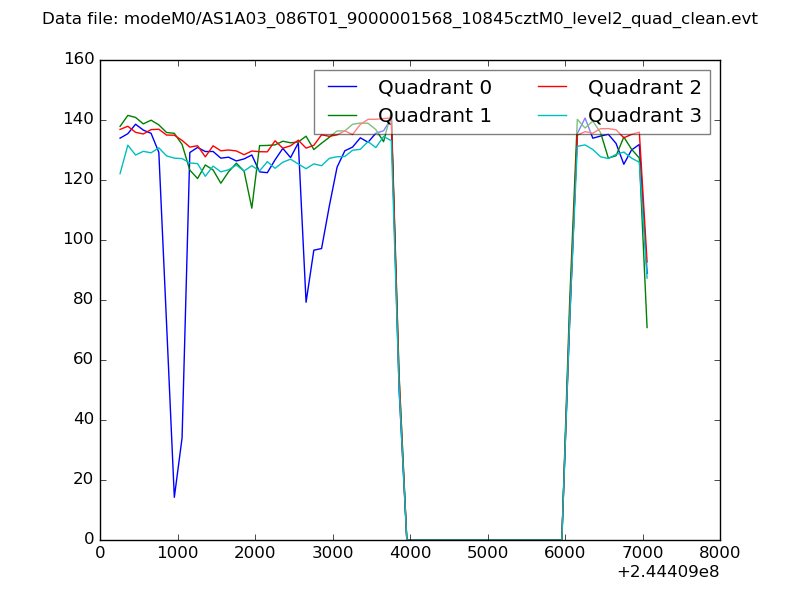 |
|
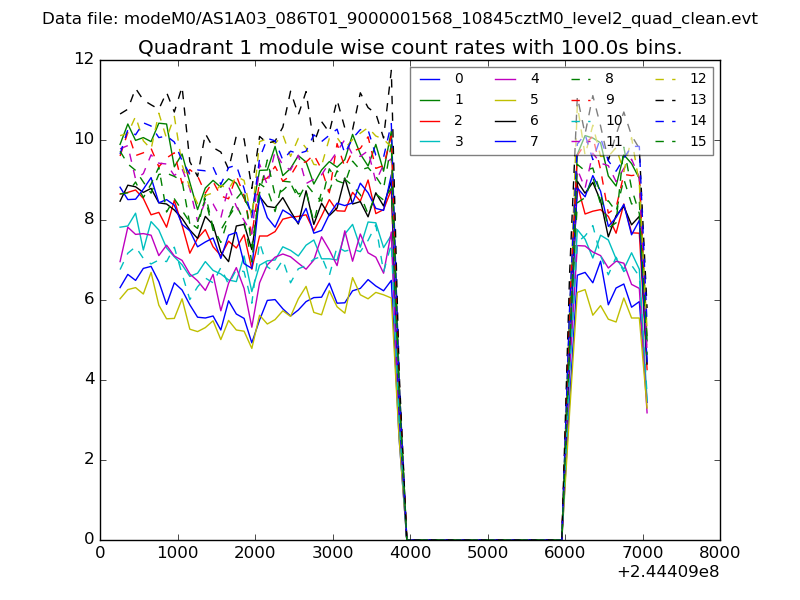
| Module-wise count rates for Quadrant A Data is divided into 100 sec bins |
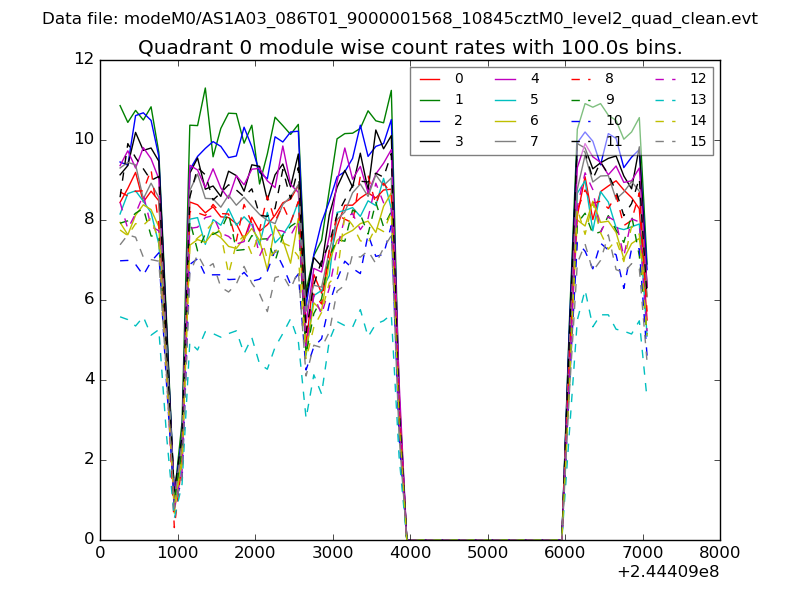 |
 |
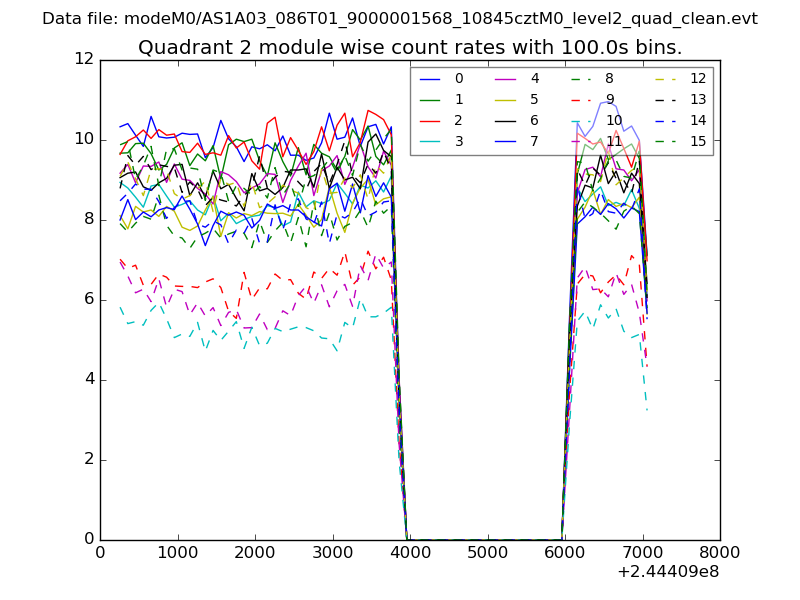
| Module-wise count rates for Quadrant B Data is divided into 100 sec bins |
 |
 |
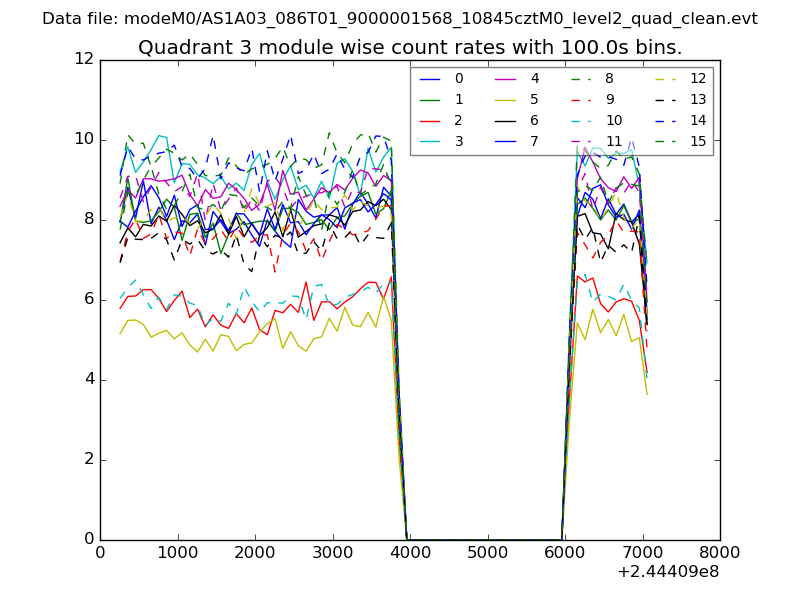
| Module-wise count rates for Quadrant C Data is divided into 100 sec bins |
 |
 |
| Module-wise count rates for Quadrant D Data is divided into 100 sec bins |
 |
 |
| Parameter | Plot |
|---|---|
| CZT HV Monitor | 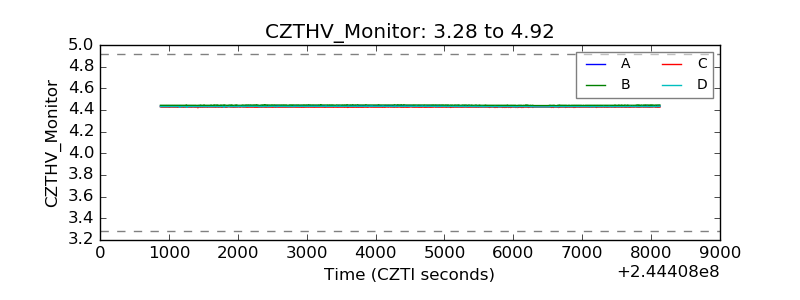 |
| D_VDD | 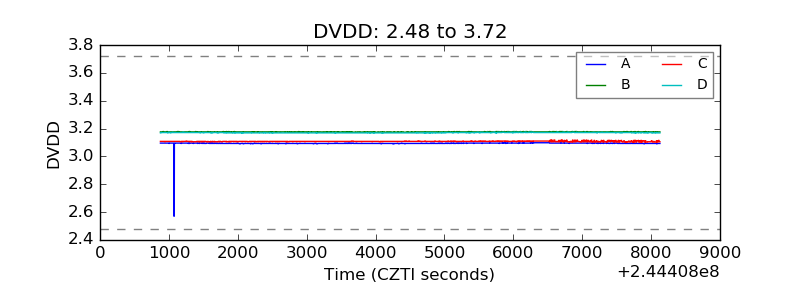 |
| Temperature 1 | 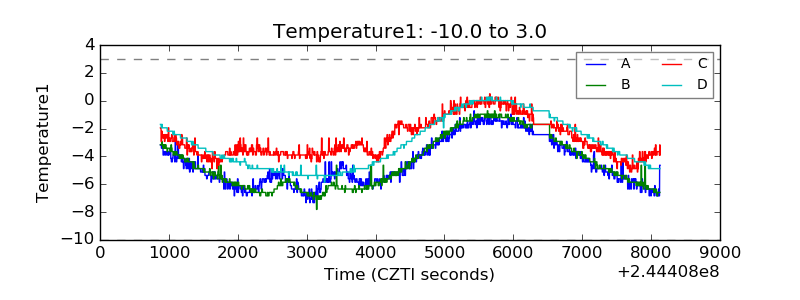 |
| Veto HV Monitor | 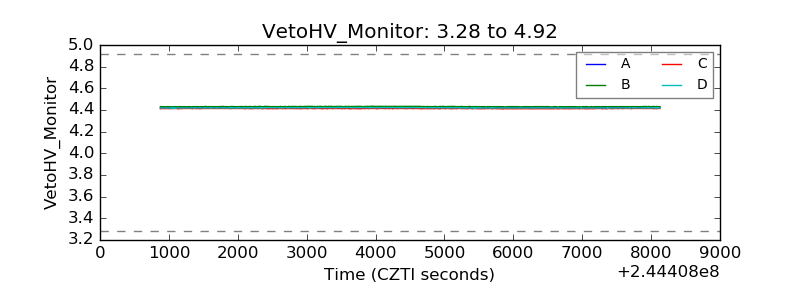 |
| Veto LLD | 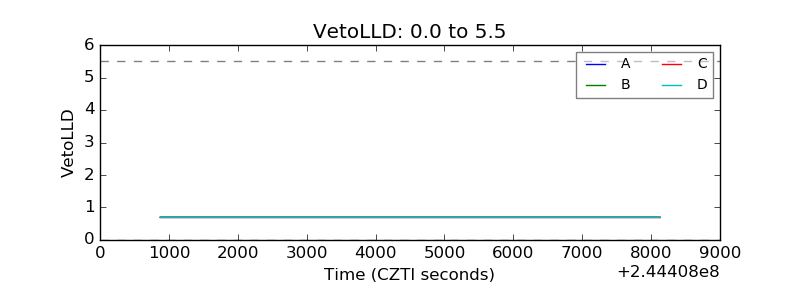 |
| Alpha Counter | 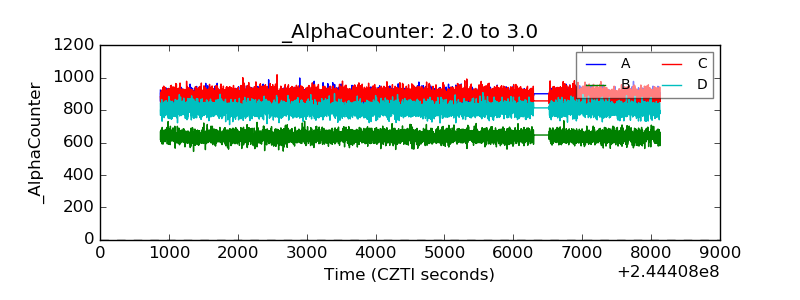 |
| _CPM_Rate | 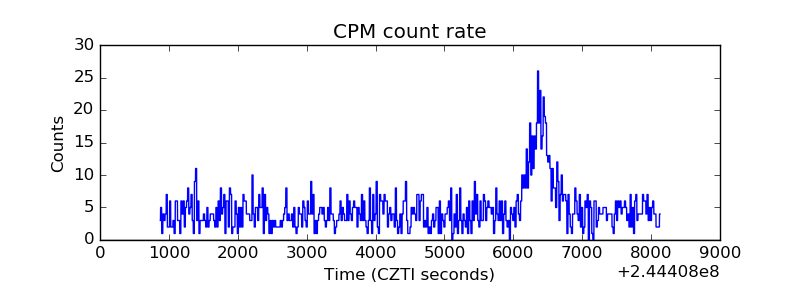 |
| CZT Counter | 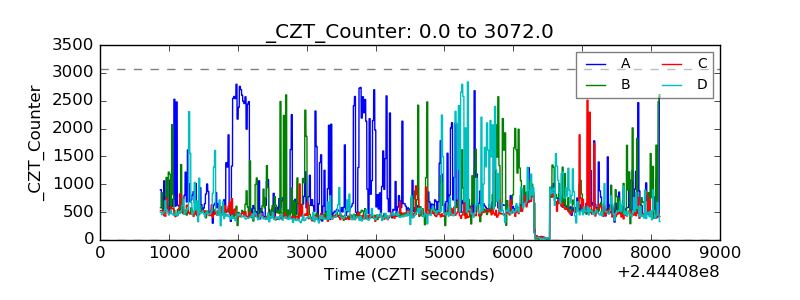 |
| +2.5 Volts monitor |  |
| +5 Volts monitor |  |
| _ROLL_ROT | 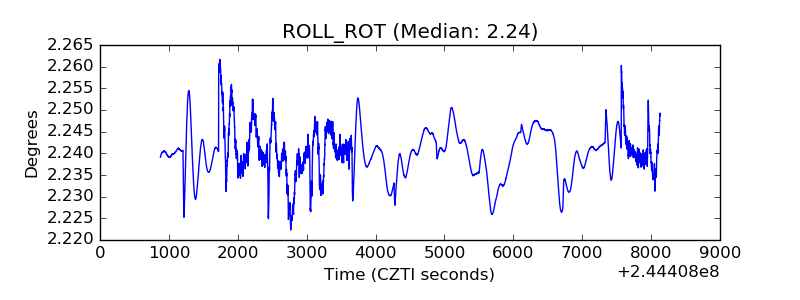 |
| _Roll_DEC | 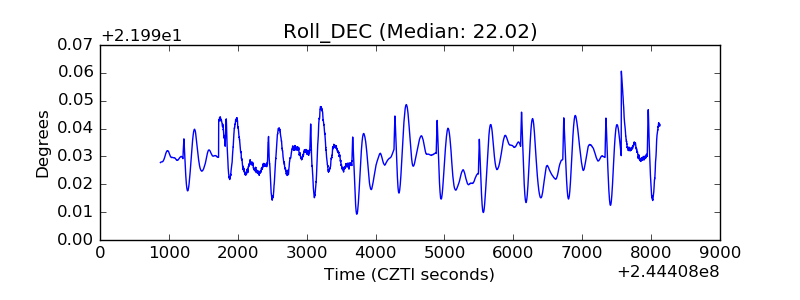 |
| _Roll_RA | 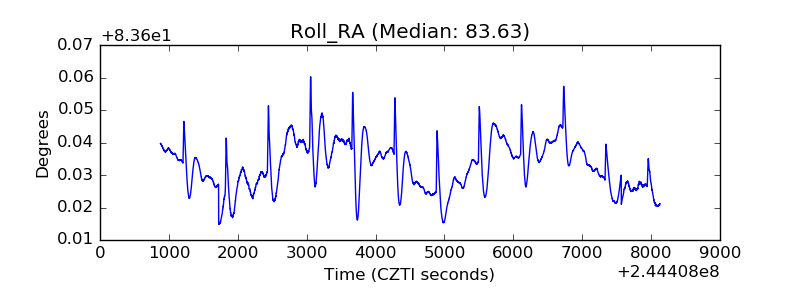 |
| Veto Counter | 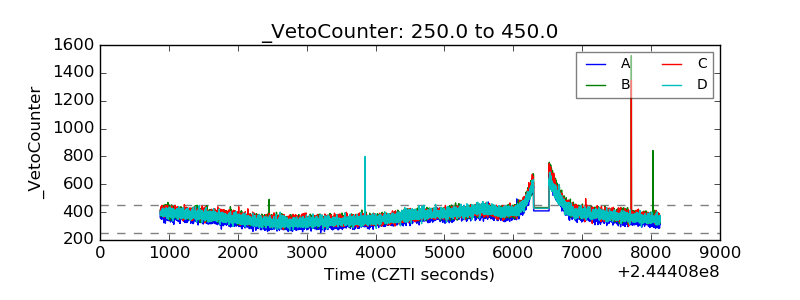 |