| Param | Original file | Final file |
|---|---|---|
| Filename | modeM0/AS1A03_086T01_9000001568_10846cztM0_level2.evt | modeM0/AS1A03_086T01_9000001568_10846cztM0_level2_quad_clean.evt |
| Size (bytes) | 600,379,200 | 103,317,120 |
| Size | 572.6 MB | 98.5 MB |
| Events in quadrant A | 4,880,187 | 660,011 |
| Events in quadrant B | 5,002,405 | 664,630 |
| Events in quadrant C | 3,951,196 | 669,666 |
| Events in quadrant D | 3,867,668 | 640,393 |
| Mode M9 | |||
|---|---|---|---|
| Quadrant | BADHDUFLAG | Total packets | Discarded packets |
| A | 0 | 2 | 0 |
| B | 0 | 2 | 0 |
| C | 0 | 2 | 0 |
| D | 0 | 2 | 0 |
| Mode SS | |||
|---|---|---|---|
| Quadrant | BADHDUFLAG | Total packets | Discarded packets |
| A | 0 | 146 | 2 |
| B | 0 | 146 | 2 |
| C | 0 | 146 | 0 |
| D | 0 | 146 | 0 |
| Mode M0 | |||
|---|---|---|---|
| Quadrant | BADHDUFLAG | Total packets | Discarded packets |
| A | 0 | 19377 | 213 |
| B | 0 | 19736 | 235 |
| C | 0 | 16574 | 186 |
| D | 0 | 16618 | 153 |
| Quadrant | Total seconds | Saturated seconds | Saturation percentage |
|---|---|---|---|
| A | 7095 | 420 | 5.919662% |
| B | 7085 | 491 | 6.930134% |
| C | 7087 | 151 | 2.130662% |
| D | 7097 | 121 | 1.704946% |
Noise dominated data is calculated using 1-second bins in cleaned event files. If a bin has >2000 counts, and if more than 50% of those come from <1% of pixels, then it is considered to be noise-dominated and hence unusable.
| Quadrant | # 1 sec bins | Bins with >0 counts | Bins with >2000 counts | High rate bins dominated by noise | Noise dominated (total time) | Noise dominated (detector-on time) | Marked lightcurve |
|---|---|---|---|---|---|---|---|
| A | 7377 | 7158 | 225 | 225 | 3.05% | 3.14% | 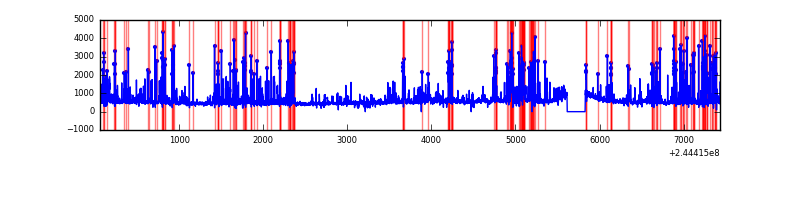 |
| B | 7377 | 7154 | 221 | 221 | 3.00% | 3.09% | 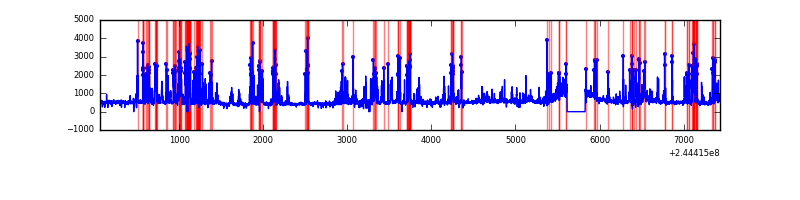 |
| C | 7377 | 7159 | 87 | 87 | 1.18% | 1.22% |  |
| D | 7377 | 7161 | 55 | 55 | 0.75% | 0.77% | 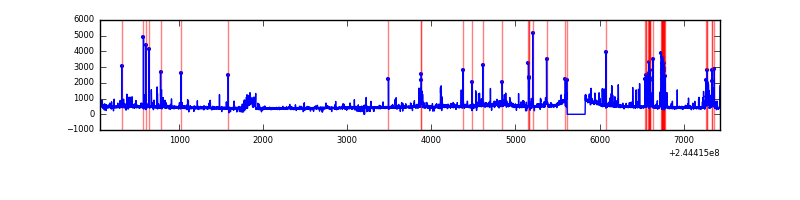 |
Top three noisy pixels from each quadrant. If the there are fewer than three noisy pixels in the level2.evt file, extra rows are filled as -1
| Pixel properties | Quadrant properties | ||||||
|---|---|---|---|---|---|---|---|
| Quadrant | DetID | PixID | Counts | Sigma | Mean | Median | Sigma |
| A | 8 | 5 | 1265668 | 7298.59 | 842 | 826 | 173.3 |
| A | 15 | 223 | 183947 | 1056.67 | 842 | 826 | 173.3 |
| A | 13 | 251 | 87314 | 499.07 | 842 | 826 | 173.3 |
| B | 4 | 239 | 1515539 | 9172.45 | 850 | 831 | 165.1 |
| B | 0 | 219 | 68889 | 412.13 | 850 | 831 | 165.1 |
| B | 0 | 214 | 31143 | 183.56 | 850 | 831 | 165.1 |
| C | 4 | 254 | 667797 | 3399.36 | 835 | 843 | 196.2 |
| C | 8 | 128 | 9809 | 45.7 | 835 | 843 | 196.2 |
| C | 4 | 238 | 6829 | 30.51 | 835 | 843 | 196.2 |
| D | 2 | 14 | 162504 | 799.59 | 828 | 807 | 202.2 |
| D | 13 | 104 | 143311 | 704.68 | 828 | 807 | 202.2 |
| D | 7 | 71 | 123924 | 608.81 | 828 | 807 | 202.2 |
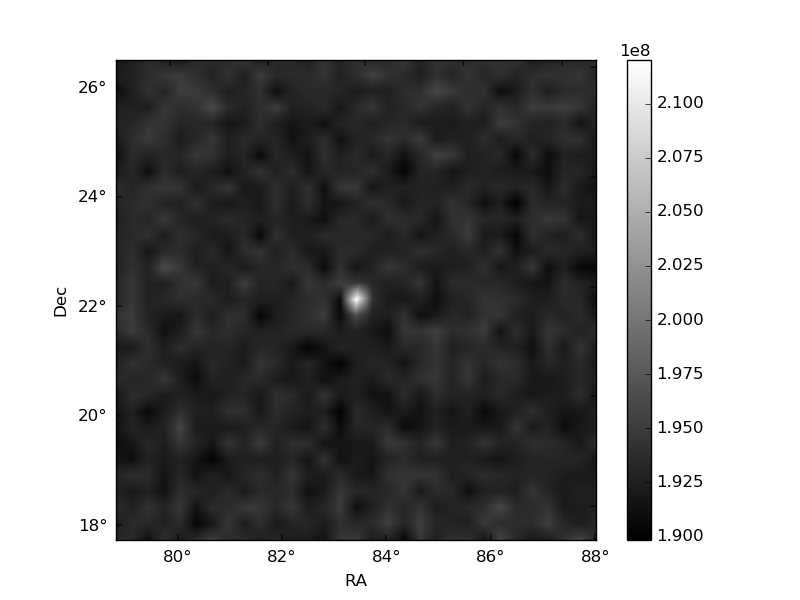
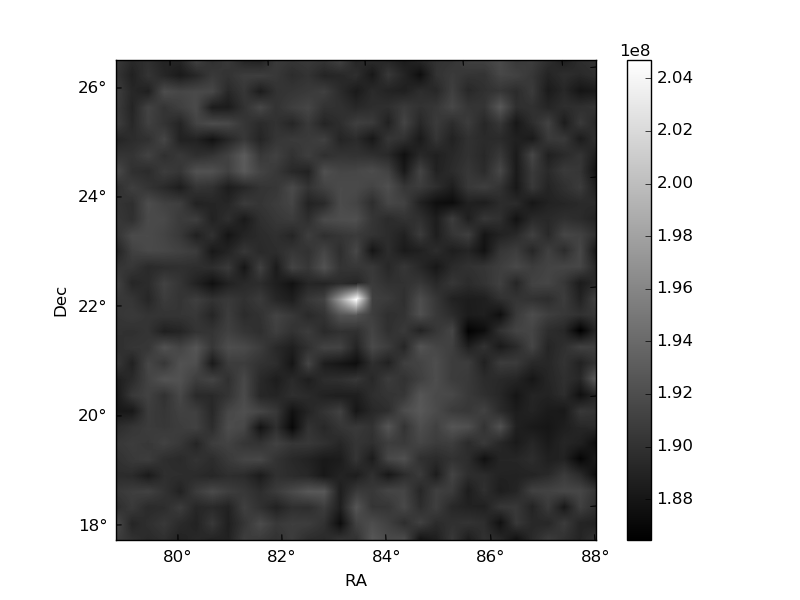
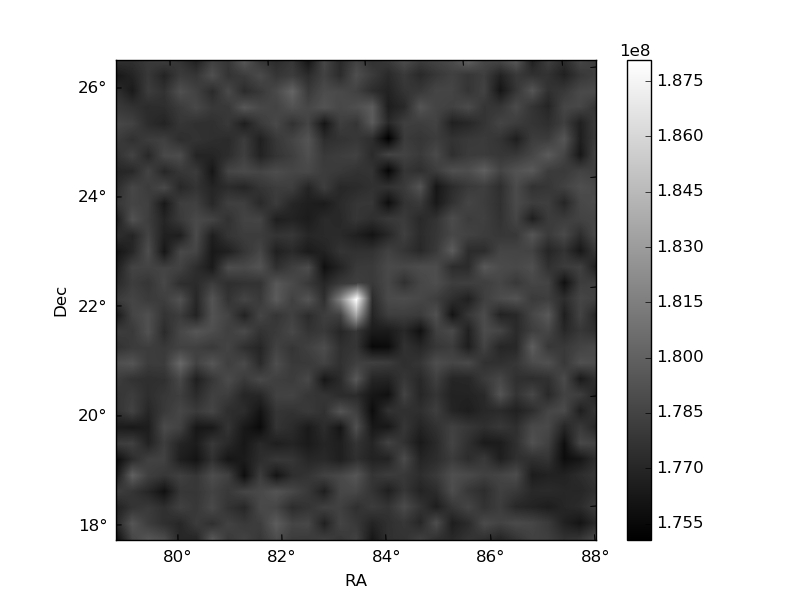
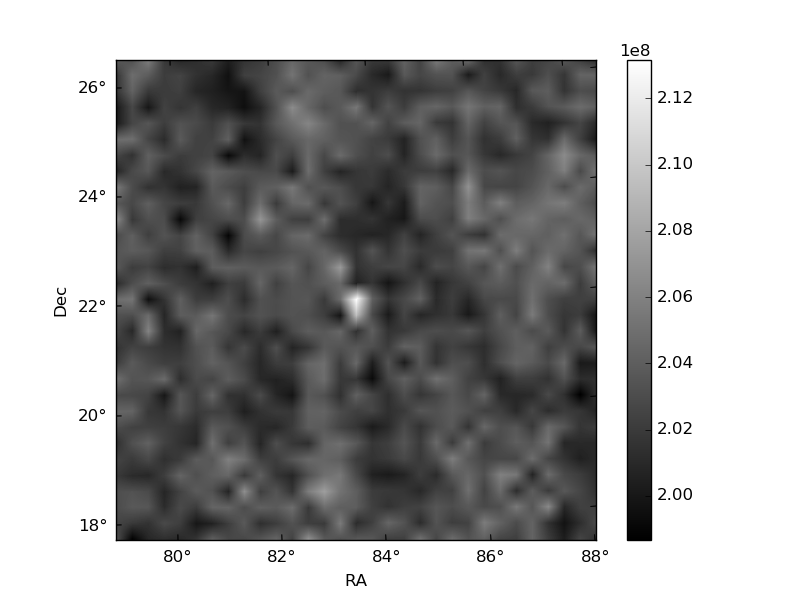
Histogram calculated using DETX and DETY for each event in the final _common_clean file
| Quadrant A |  |
 |
Quadrant B |
|---|---|---|---|
| Quadrant D | 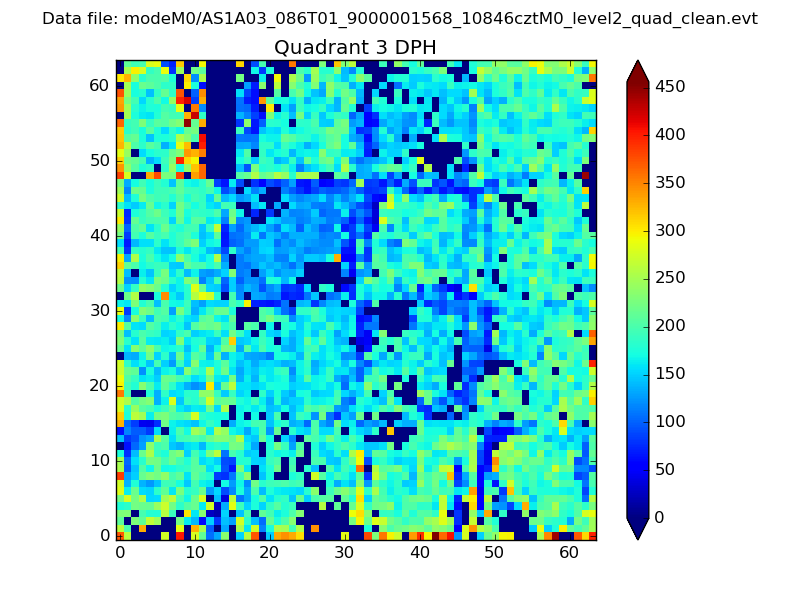 |
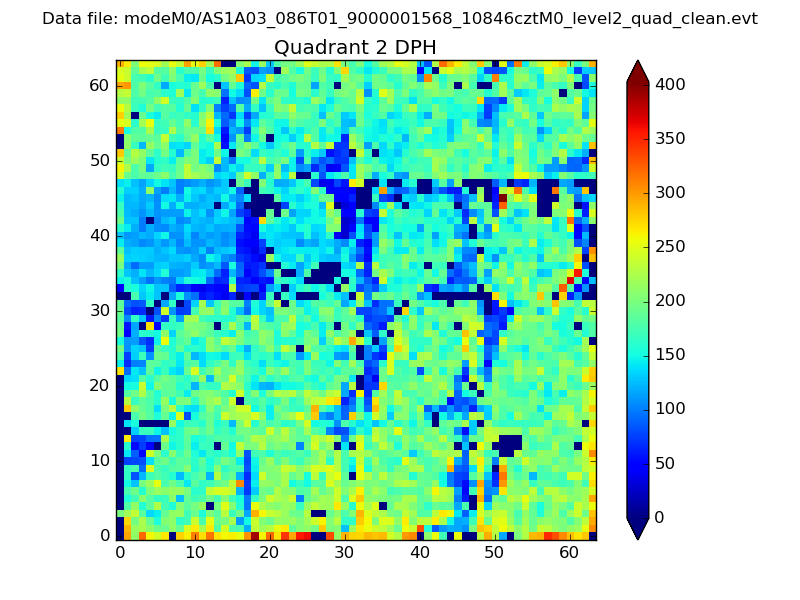 |
Quadrant C |
| Plot type | Count rate plots | Images |
|---|---|---|
| Comparison with Poisson distribution Blue bars denote a histogram of data divided into 1 sec bins. Red curve is a Poisson curve with rate = median count rate of data. |
 |
 |
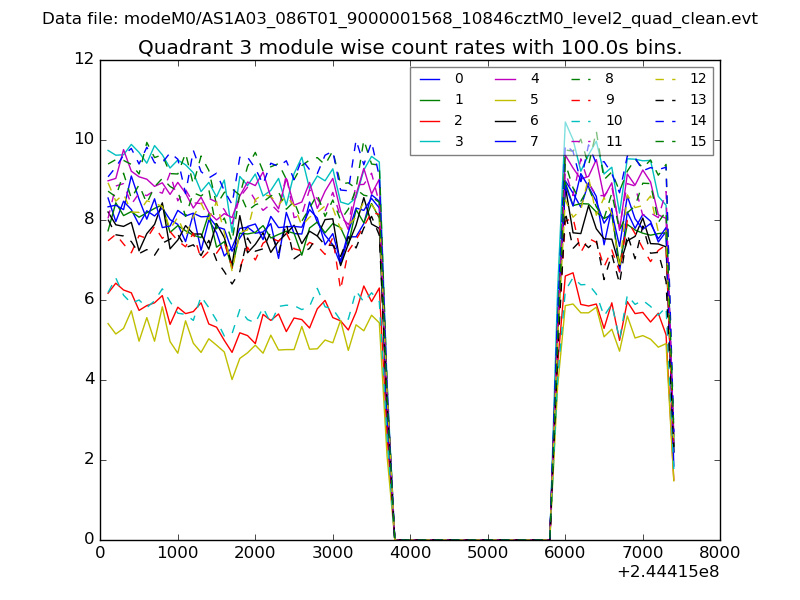
| Quadrant-wise count rates Data is divided into 100 sec bins |
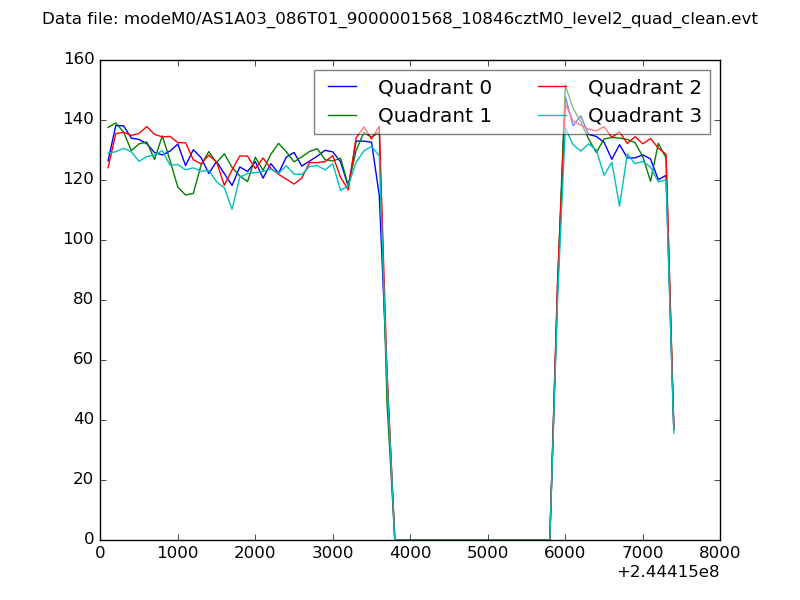 |
|
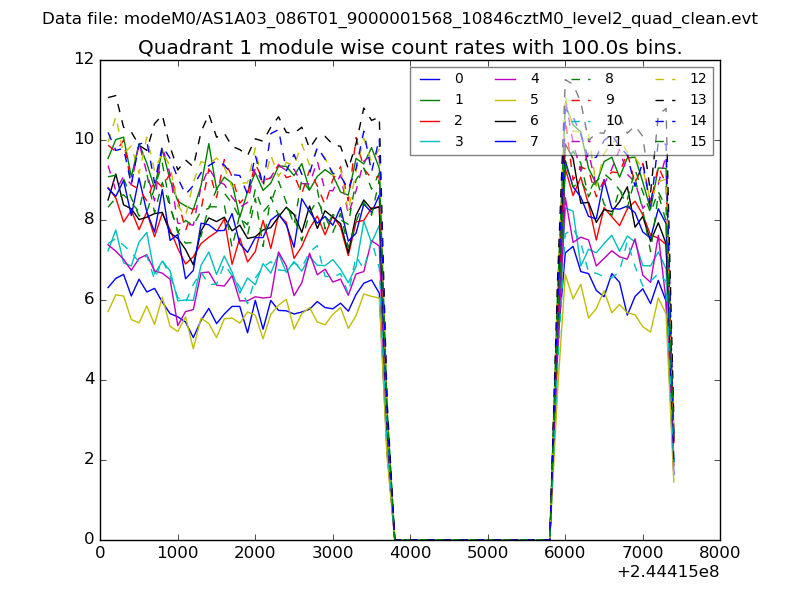
| Module-wise count rates for Quadrant A Data is divided into 100 sec bins |
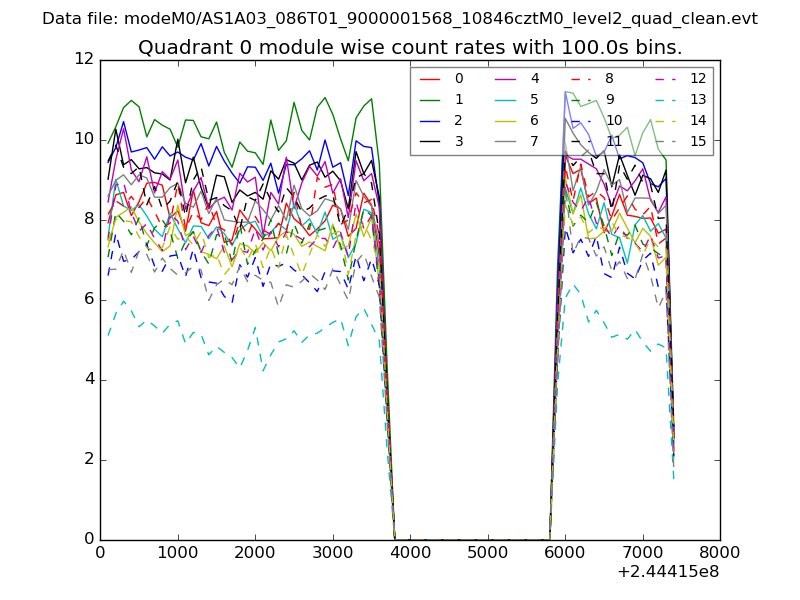 |
 |
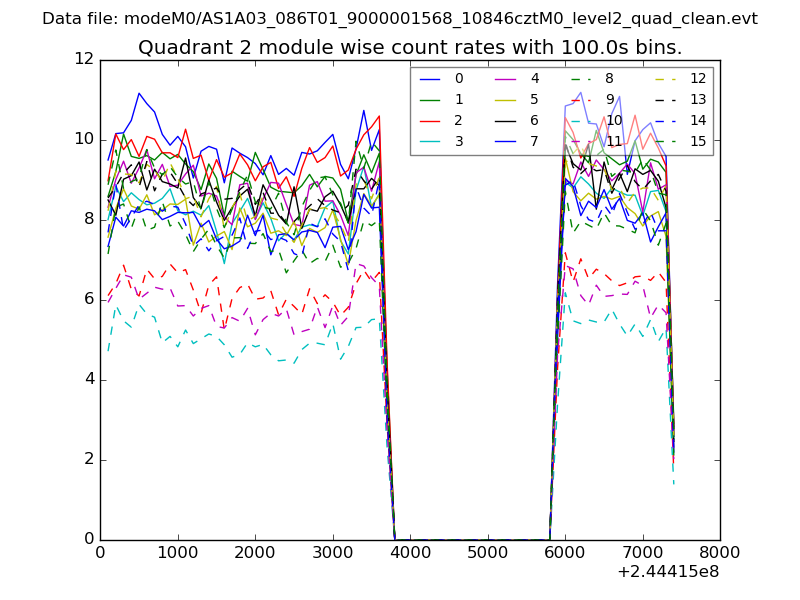
| Module-wise count rates for Quadrant B Data is divided into 100 sec bins |
 |
 |
| Module-wise count rates for Quadrant C Data is divided into 100 sec bins |
 |
 |
| Module-wise count rates for Quadrant D Data is divided into 100 sec bins |
 |
 |
| Parameter | Plot |
|---|---|
| CZT HV Monitor |  |
| D_VDD | 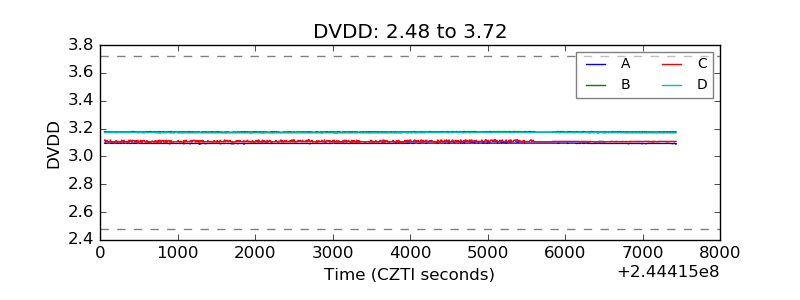 |
| Temperature 1 | 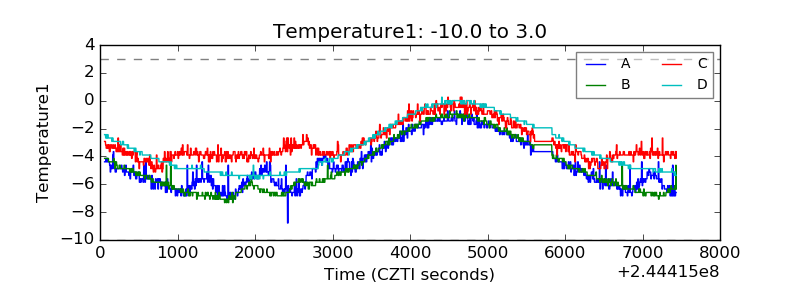 |
| Veto HV Monitor | 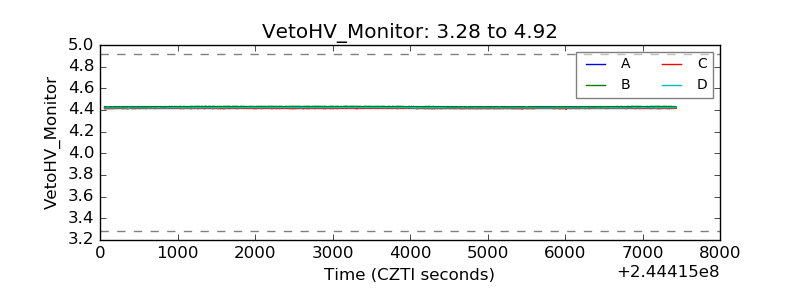 |
| Veto LLD | 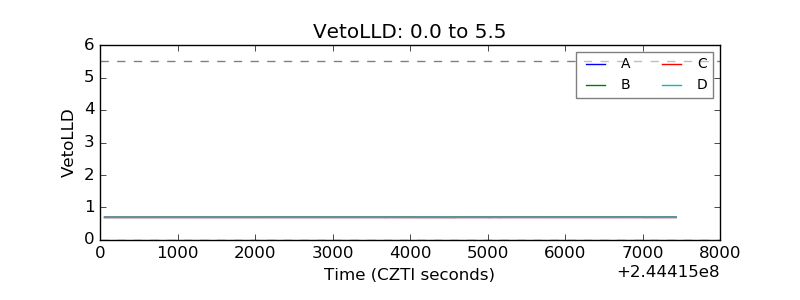 |
| Alpha Counter | 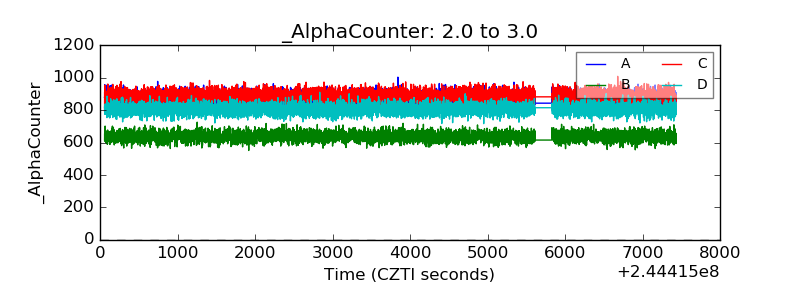 |
| _CPM_Rate | 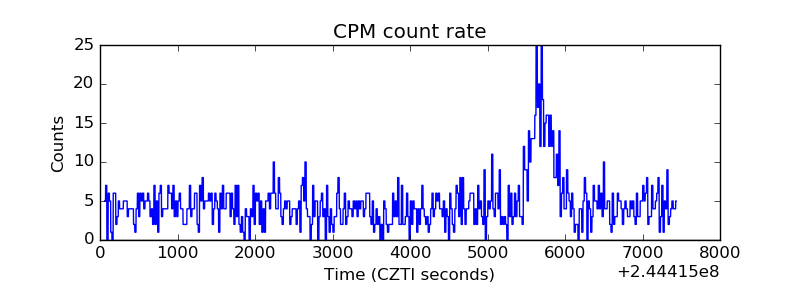 |
| CZT Counter | 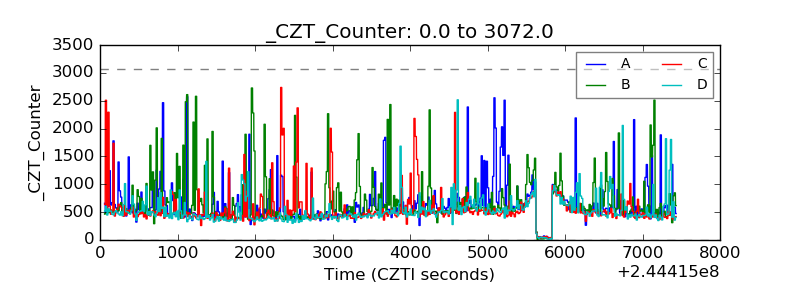 |
| +2.5 Volts monitor |  |
| +5 Volts monitor |  |
| _ROLL_ROT | 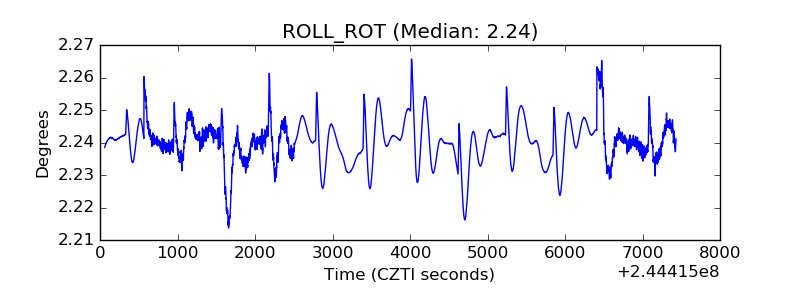 |
| _Roll_DEC | 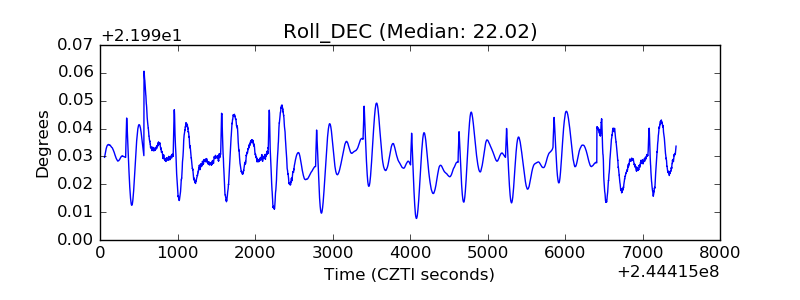 |
| _Roll_RA | 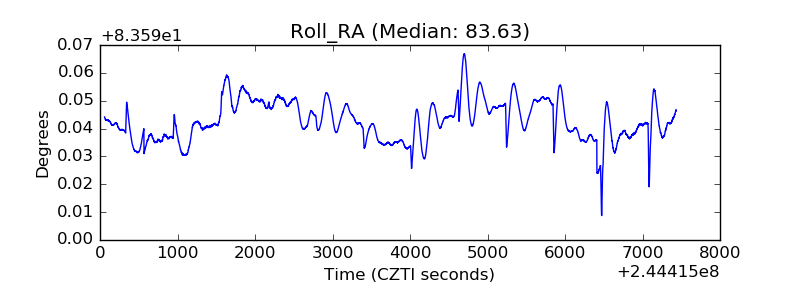 |
| Veto Counter | 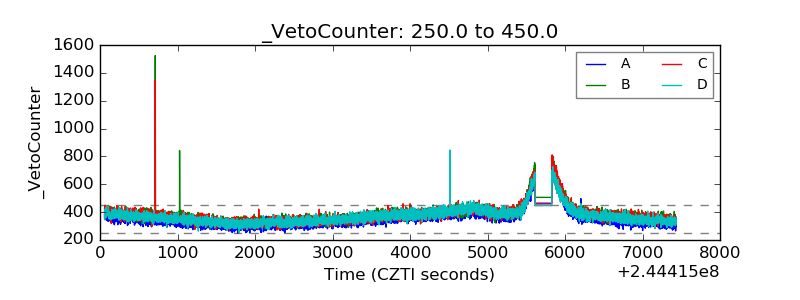 |