| Param | Original file | Final file |
|---|---|---|
| Filename | modeM0/AS1A03_086T01_9000001568_10852cztM0_level2.evt | modeM0/AS1A03_086T01_9000001568_10852cztM0_level2_quad_clean.evt |
| Size (bytes) | 2,784,962,880 | 348,445,440 |
| Size | 2.6 GB | 332.3 MB |
| Events in quadrant A | 24,539,824 | 2,148,718 |
| Events in quadrant B | 18,006,071 | 2,257,116 |
| Events in quadrant C | 13,421,713 | 2,284,581 |
| Events in quadrant D | 26,508,151 | 1,952,593 |
| Mode M9 | |||
|---|---|---|---|
| Quadrant | BADHDUFLAG | Total packets | Discarded packets |
| A | 0 | 38 | 0 |
| B | 0 | 38 | 0 |
| C | 0 | 38 | 0 |
| D | 0 | 38 | 0 |
| Mode SS | |||
|---|---|---|---|
| Quadrant | BADHDUFLAG | Total packets | Discarded packets |
| A | 0 | 564 | 0 |
| B | 0 | 564 | 0 |
| C | 0 | 564 | 0 |
| D | 0 | 564 | 0 |
| Mode M0 | |||
|---|---|---|---|
| Quadrant | BADHDUFLAG | Total packets | Discarded packets |
| A | 0 | 91556 | 6 |
| B | 0 | 71601 | 5 |
| C | 0 | 58915 | 5 |
| D | 0 | 97849 | 5 |
| Quadrant | Total seconds | Saturated seconds | Saturation percentage |
|---|---|---|---|
| A | 27763 | 3238 | 11.663005% |
| B | 27763 | 1453 | 5.233584% |
| C | 27763 | 259 | 0.932896% |
| D | 27763 | 5038 | 18.146454% |
Noise dominated data is calculated using 1-second bins in cleaned event files. If a bin has >2000 counts, and if more than 50% of those come from <1% of pixels, then it is considered to be noise-dominated and hence unusable.
| Quadrant | # 1 sec bins | Bins with >0 counts | Bins with >2000 counts | High rate bins dominated by noise | Noise dominated (total time) | Noise dominated (detector-on time) | Marked lightcurve |
|---|---|---|---|---|---|---|---|
| A | 31493 | 27768 | 2152 | 2152 | 6.83% | 7.75% | 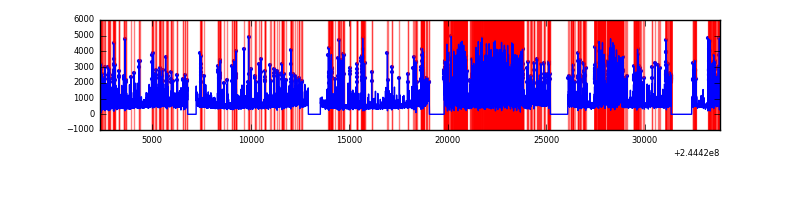 |
| B | 31493 | 27767 | 814 | 814 | 2.58% | 2.93% | 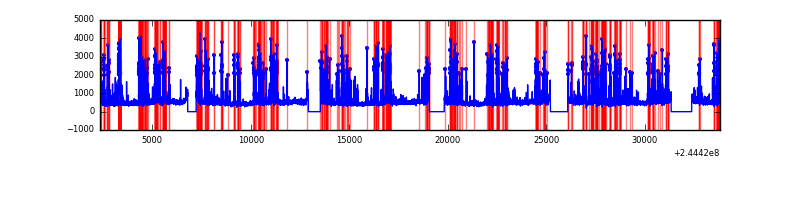 |
| C | 31493 | 27768 | 120 | 120 | 0.38% | 0.43% | 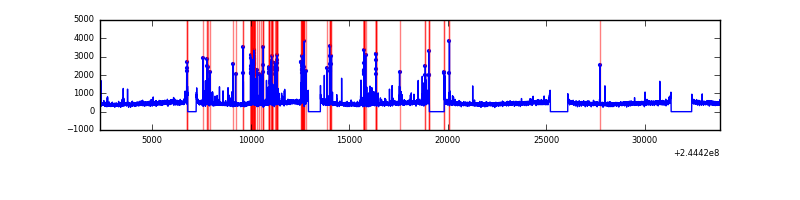 |
| D | 31493 | 27767 | 4544 | 4544 | 14.43% | 16.36% | 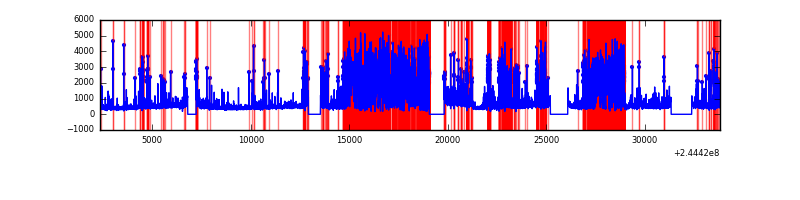 |
Top three noisy pixels from each quadrant. If the there are fewer than three noisy pixels in the level2.evt file, extra rows are filled as -1
| Pixel properties | Quadrant properties | ||||||
|---|---|---|---|---|---|---|---|
| Quadrant | DetID | PixID | Counts | Sigma | Mean | Median | Sigma |
| A | 8 | 5 | 10683045 | 16560.53 | 3166 | 3105 | 644.9 |
| A | 15 | 223 | 725831 | 1120.67 | 3166 | 3105 | 644.9 |
| A | 15 | 239 | 289222 | 443.66 | 3166 | 3105 | 644.9 |
| B | 4 | 239 | 4698610 | 7552.83 | 3277 | 3204 | 621.7 |
| B | 0 | 214 | 141611 | 222.64 | 3277 | 3204 | 621.7 |
| B | 4 | 173 | 126399 | 198.17 | 3277 | 3204 | 621.7 |
| C | 4 | 254 | 840646 | 1128.53 | 3214 | 3242 | 742.0 |
| C | 14 | 234 | 31358 | 37.89 | 3214 | 3242 | 742.0 |
| C | 13 | 61 | 23811 | 27.72 | 3214 | 3242 | 742.0 |
| D | 1 | 52 | 13159812 | 18410.38 | 2923 | 2840 | 714.6 |
| D | 5 | 222 | 944797 | 1318.07 | 2923 | 2840 | 714.6 |
| D | 12 | 233 | 294566 | 408.21 | 2923 | 2840 | 714.6 |
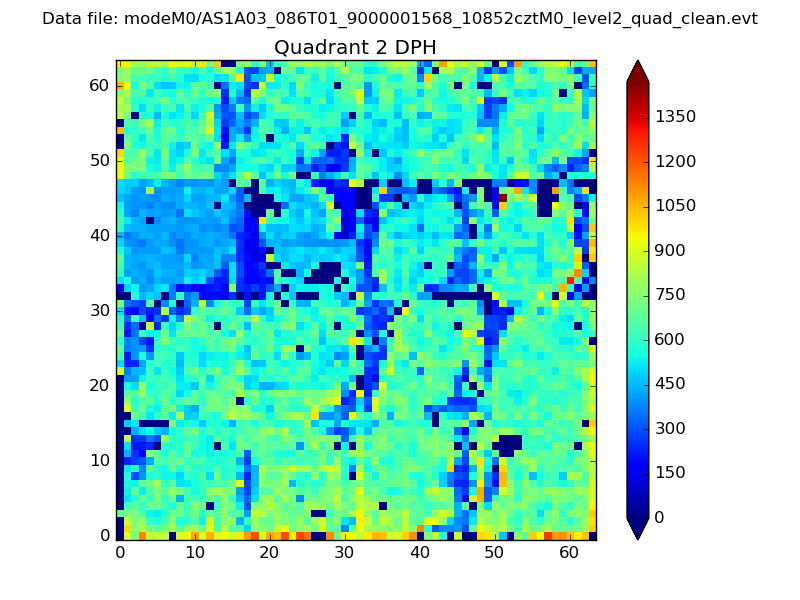
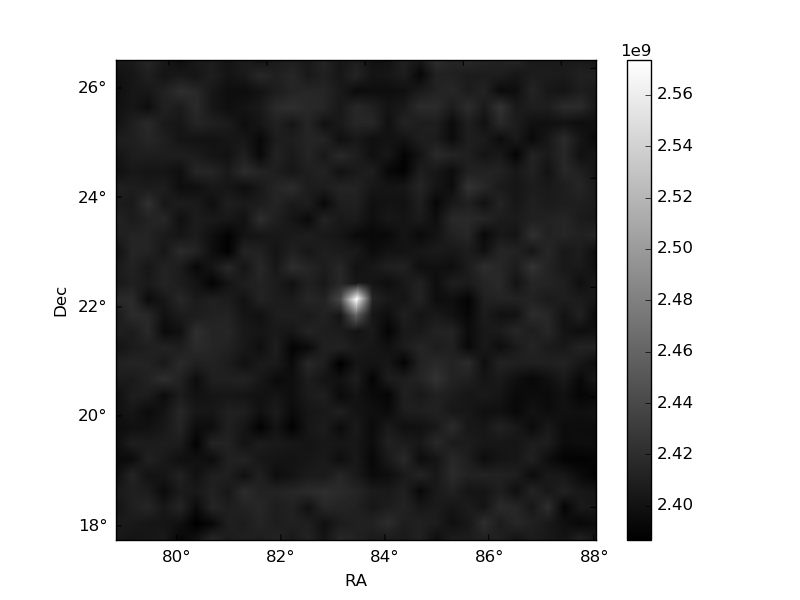
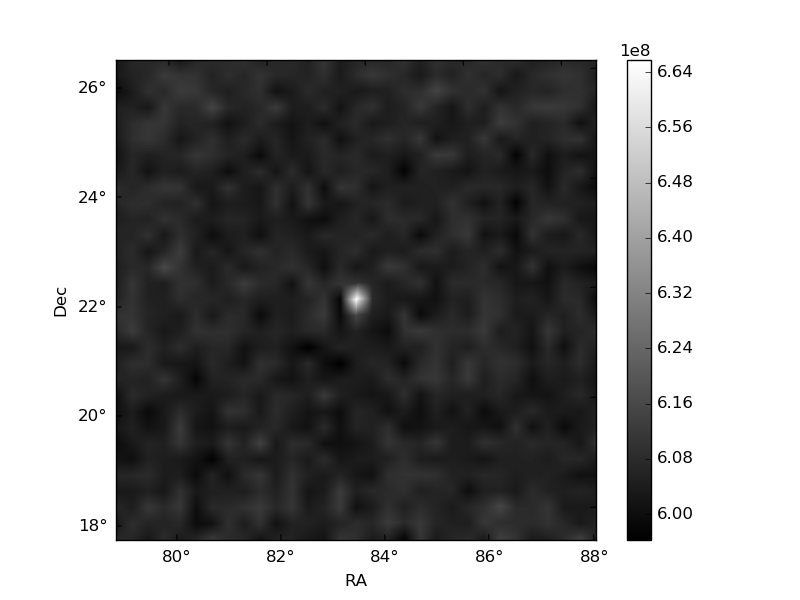
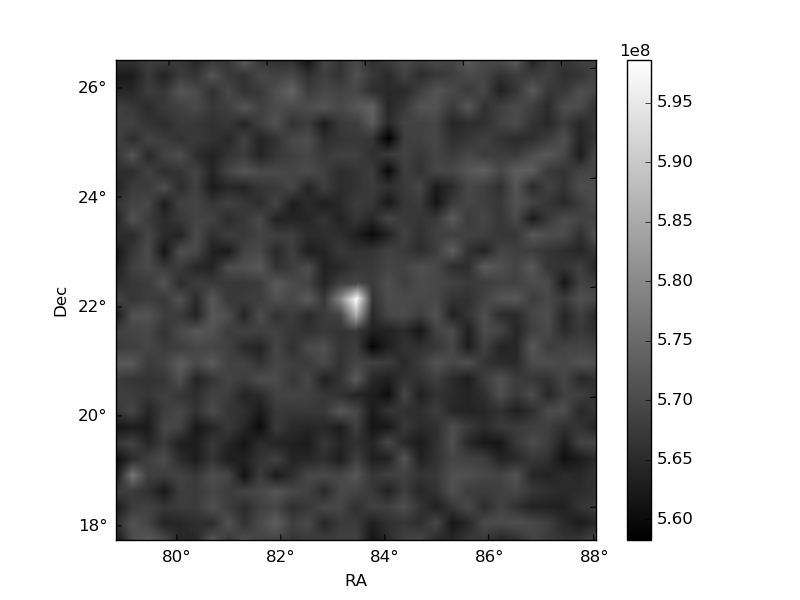
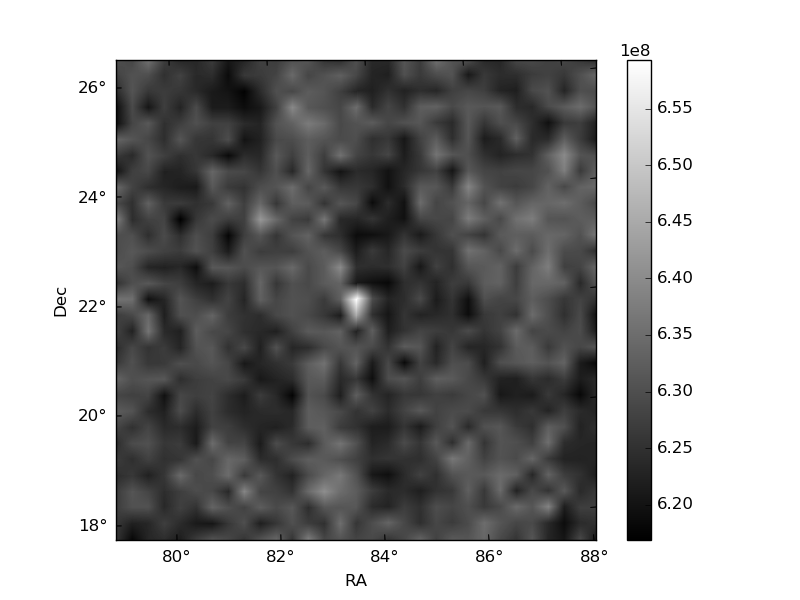
Histogram calculated using DETX and DETY for each event in the final _common_clean file
| Quadrant A | 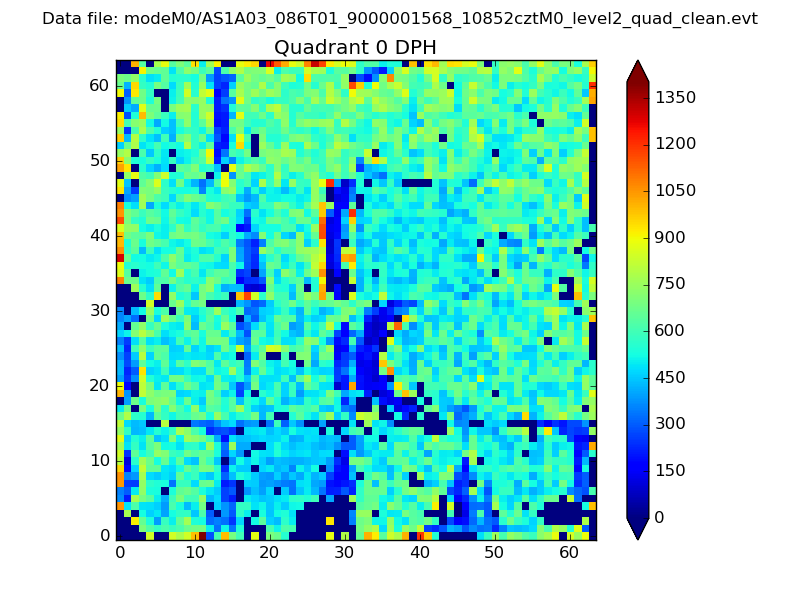 |
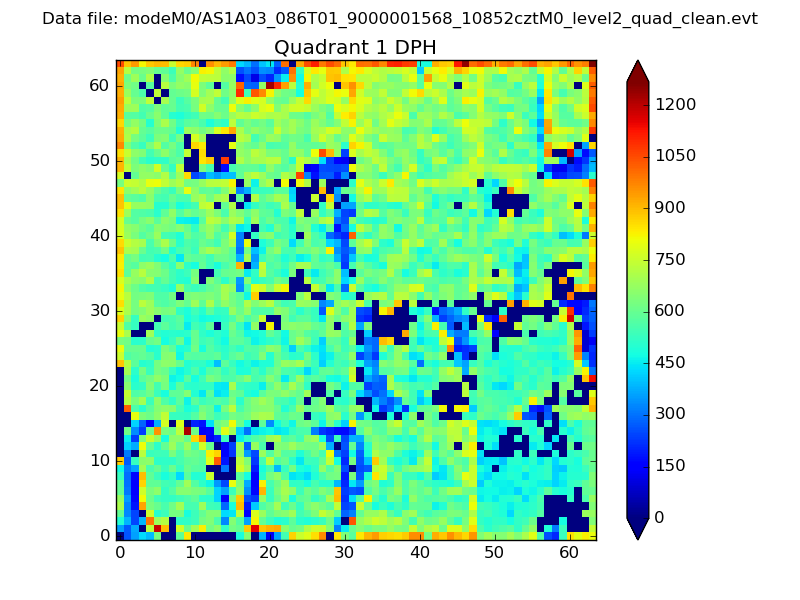 |
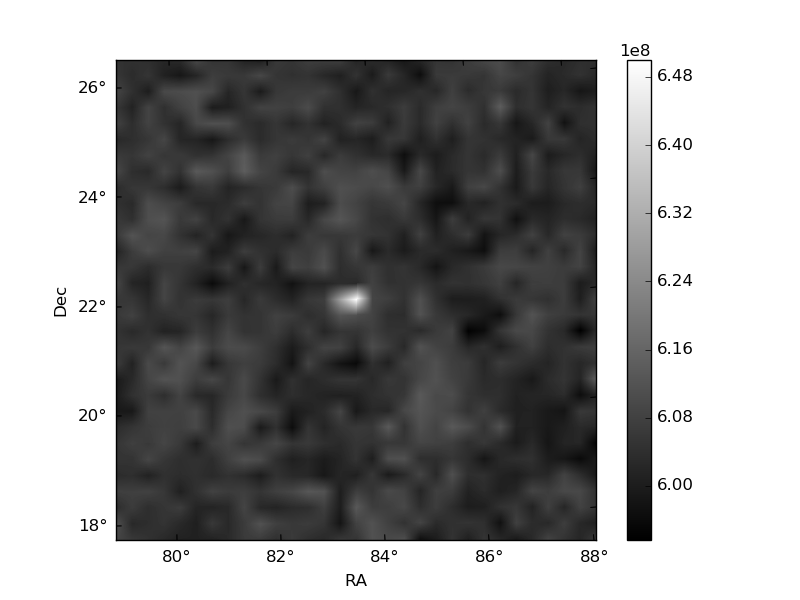
Quadrant B |
|---|---|---|---|
| Quadrant D | 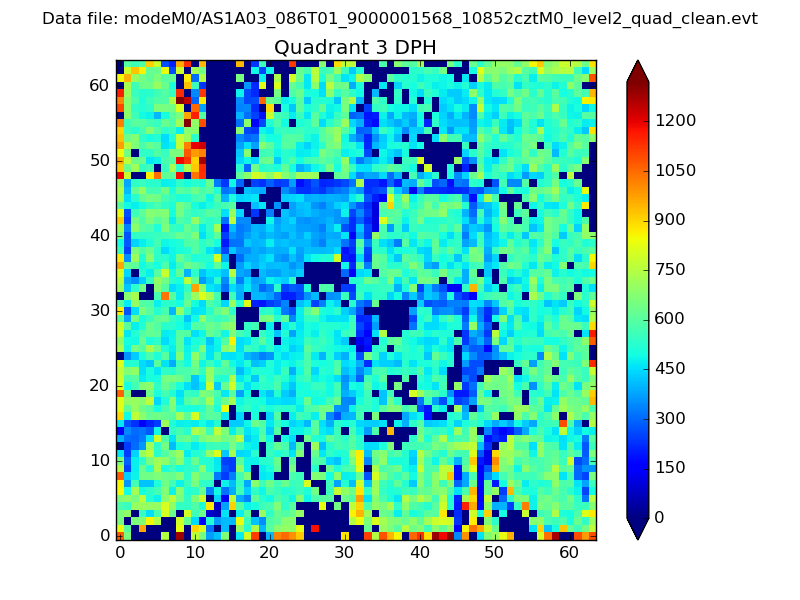 |
 |
Quadrant C |
| Plot type | Count rate plots | Images |
|---|---|---|
| Comparison with Poisson distribution Blue bars denote a histogram of data divided into 1 sec bins. Red curve is a Poisson curve with rate = median count rate of data. |
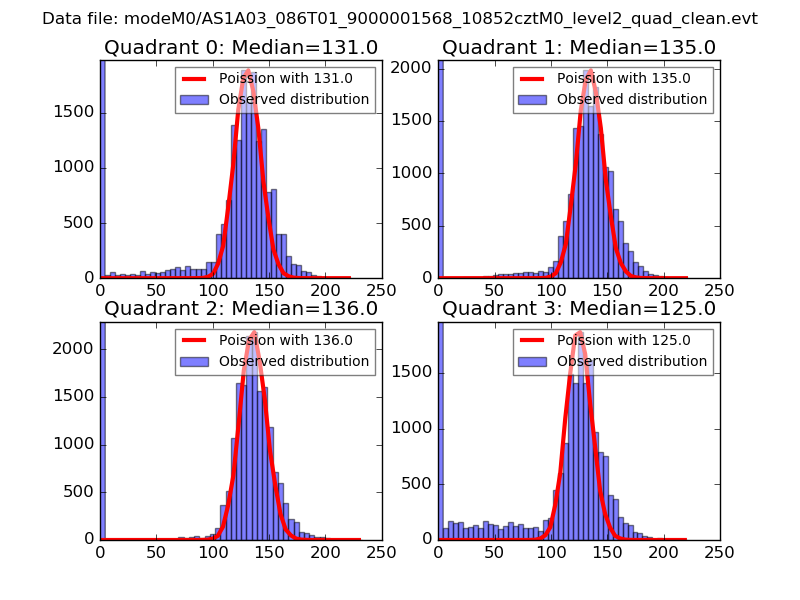 |
 |
| Quadrant-wise count rates Data is divided into 100 sec bins |
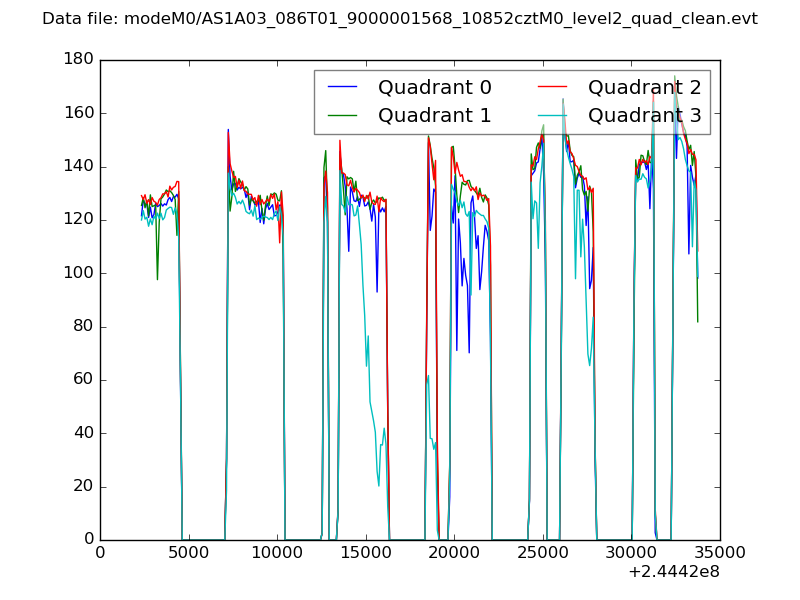 |
|
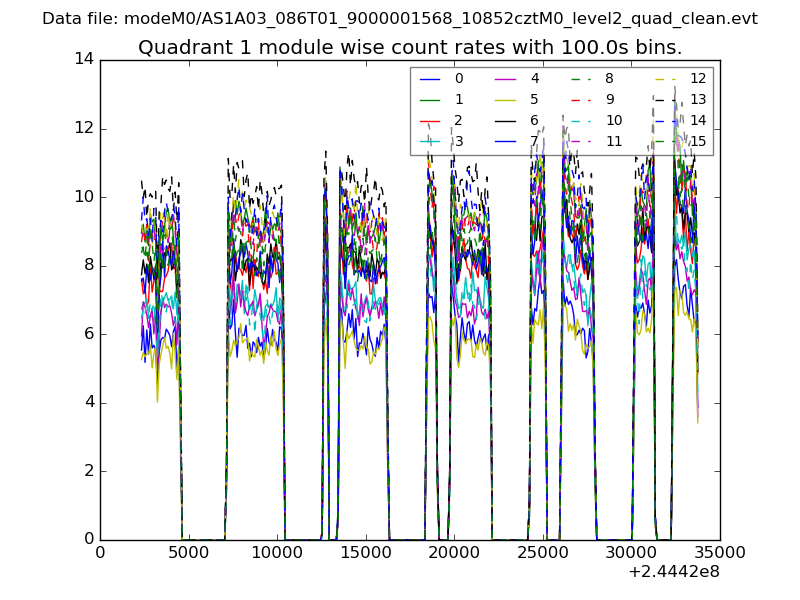
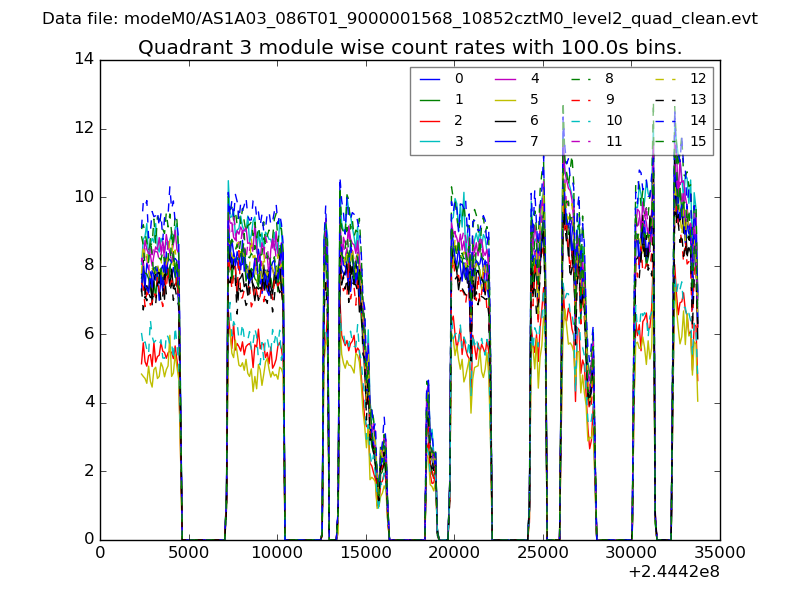
| Module-wise count rates for Quadrant A Data is divided into 100 sec bins |
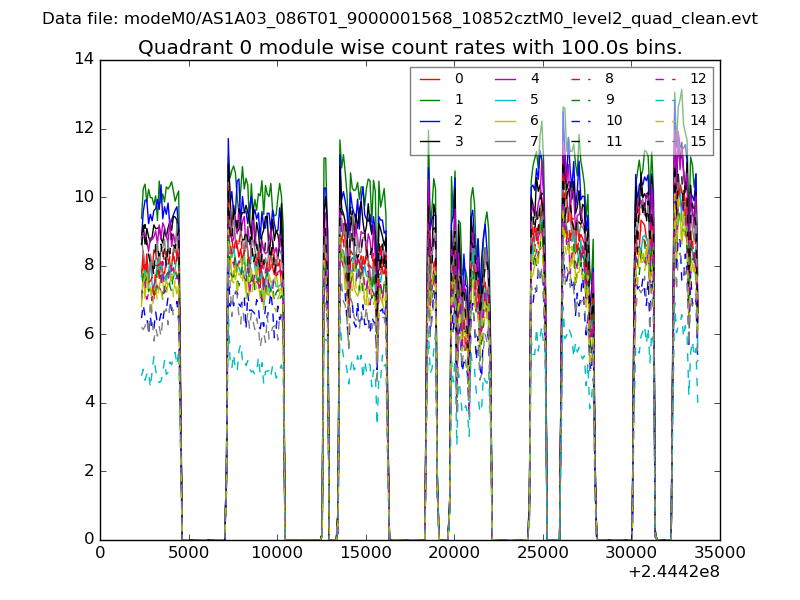 |
 |
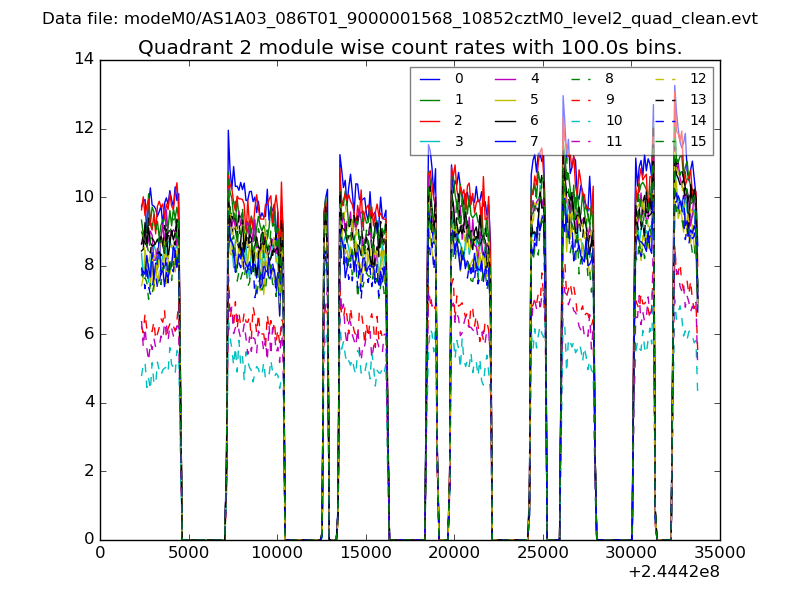
| Module-wise count rates for Quadrant B Data is divided into 100 sec bins |
 |
 |
| Module-wise count rates for Quadrant C Data is divided into 100 sec bins |
 |
 |
| Module-wise count rates for Quadrant D Data is divided into 100 sec bins |
 |
 |
| Parameter | Plot |
|---|---|
| CZT HV Monitor | 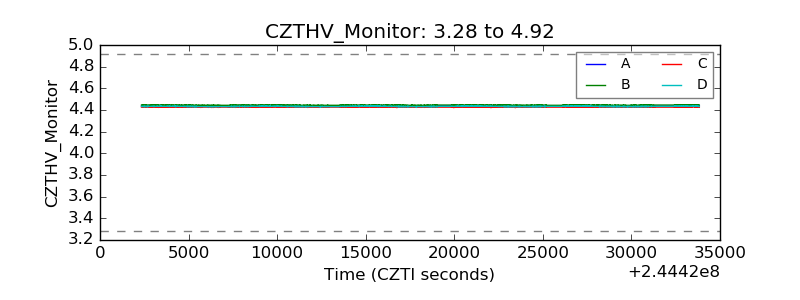 |
| D_VDD | 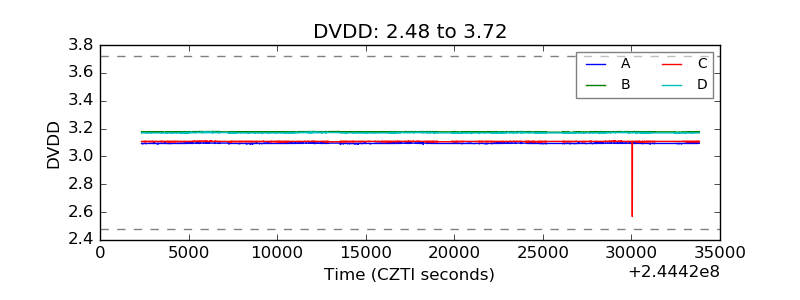 |
| Temperature 1 | 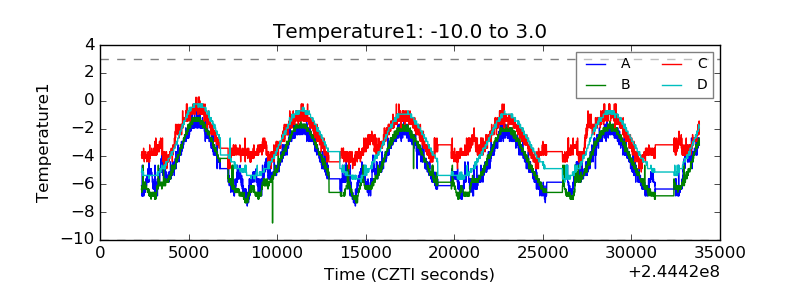 |
| Veto HV Monitor | 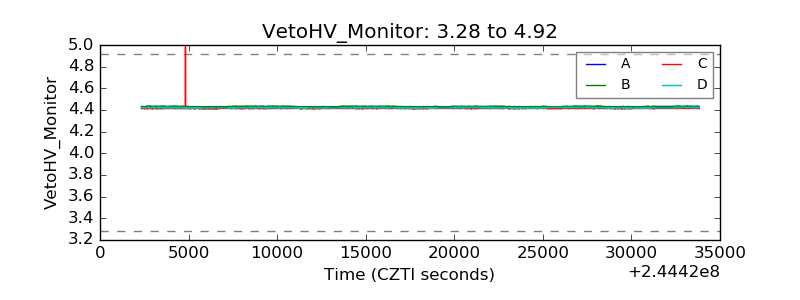 |
| Veto LLD | 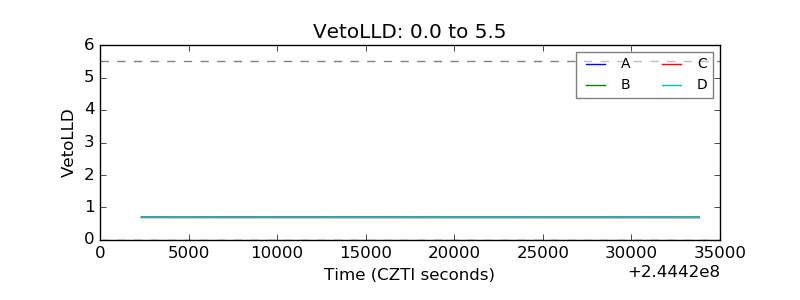 |
| Alpha Counter | 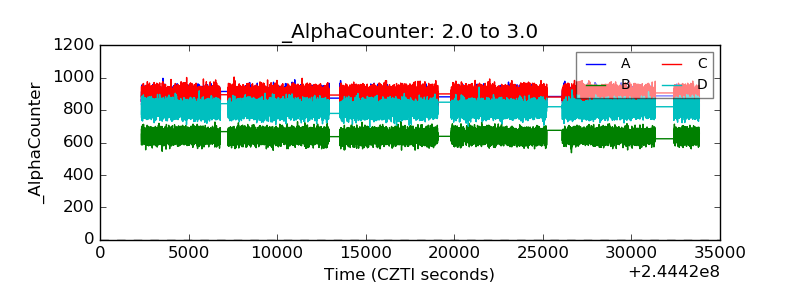 |
| _CPM_Rate | 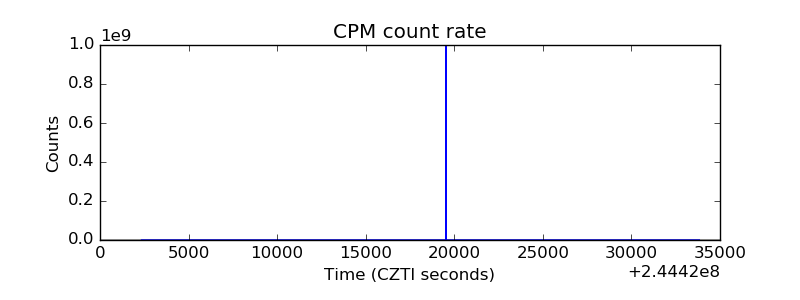 |
| CZT Counter | 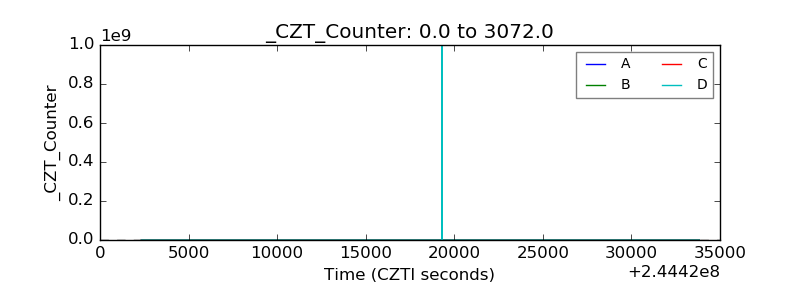 |
| +2.5 Volts monitor |  |
| +5 Volts monitor | 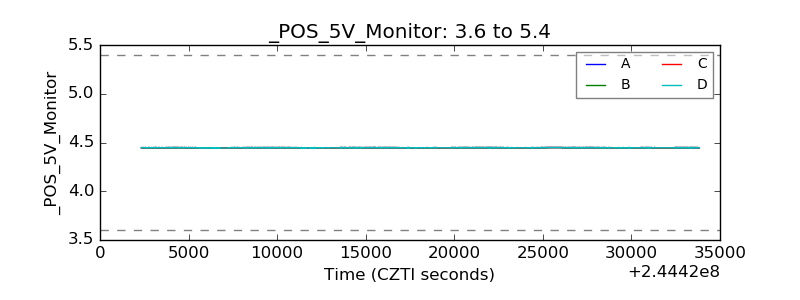 |
| _ROLL_ROT | 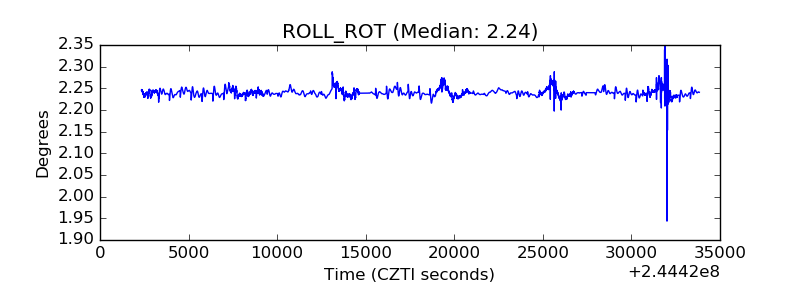 |
| _Roll_DEC | 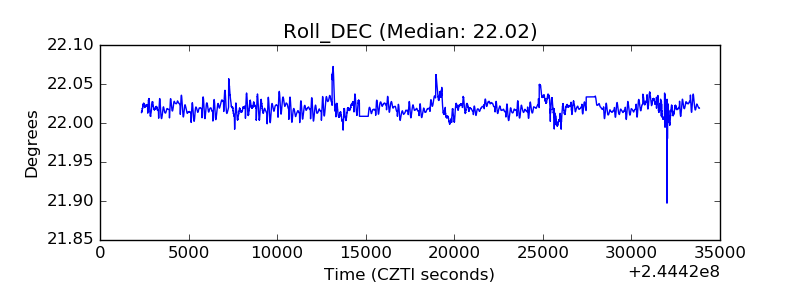 |
| _Roll_RA | 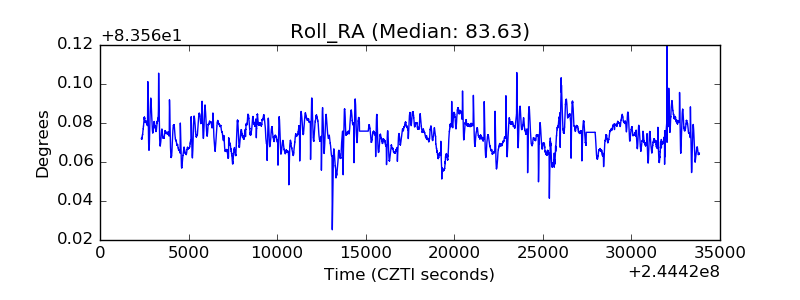 |
| Veto Counter | 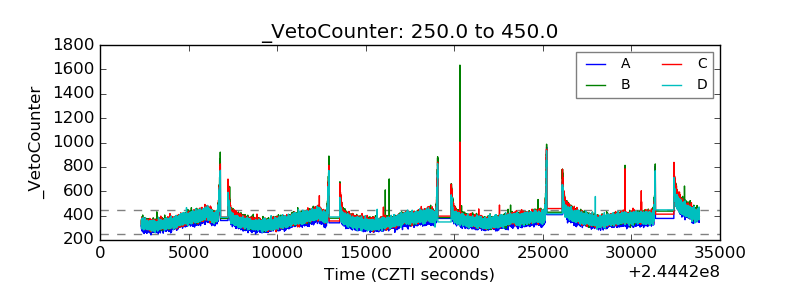 |