| Param | Original file | Final file |
|---|---|---|
| Filename | modeM0/AS1A03_086T01_9000001568_10853cztM0_level2.evt | modeM0/AS1A03_086T01_9000001568_10853cztM0_level2_quad_clean.evt |
| Size (bytes) | 536,019,840 | 73,074,240 |
| Size | 511.2 MB | 69.7 MB |
| Events in quadrant A | 5,231,175 | 449,139 |
| Events in quadrant B | 4,553,775 | 458,701 |
| Events in quadrant C | 2,667,617 | 474,364 |
| Events in quadrant D | 3,399,421 | 436,760 |
| Mode M9 | |||
|---|---|---|---|
| Quadrant | BADHDUFLAG | Total packets | Discarded packets |
| A | 0 | 11 | 0 |
| B | 0 | 11 | 0 |
| C | 0 | 11 | 0 |
| D | 0 | 11 | 0 |
| Mode SS | |||
|---|---|---|---|
| Quadrant | BADHDUFLAG | Total packets | Discarded packets |
| A | 0 | 116 | 0 |
| B | 0 | 116 | 0 |
| C | 0 | 116 | 0 |
| D | 0 | 116 | 0 |
| Mode M0 | |||
|---|---|---|---|
| Quadrant | BADHDUFLAG | Total packets | Discarded packets |
| A | 0 | 19524 | 118 |
| B | 0 | 17245 | 122 |
| C | 0 | 11545 | 53 |
| D | 0 | 13800 | 78 |
| Quadrant | Total seconds | Saturated seconds | Saturation percentage |
|---|---|---|---|
| A | 5618 | 821 | 14.613742% |
| B | 5614 | 637 | 11.346633% |
| C | 5623 | 29 | 0.515739% |
| D | 5620 | 225 | 4.003559% |
Noise dominated data is calculated using 1-second bins in cleaned event files. If a bin has >2000 counts, and if more than 50% of those come from <1% of pixels, then it is considered to be noise-dominated and hence unusable.
| Quadrant | # 1 sec bins | Bins with >0 counts | Bins with >2000 counts | High rate bins dominated by noise | Noise dominated (total time) | Noise dominated (detector-on time) | Marked lightcurve |
|---|---|---|---|---|---|---|---|
| A | 6789 | 5644 | 499 | 499 | 7.35% | 8.84% | 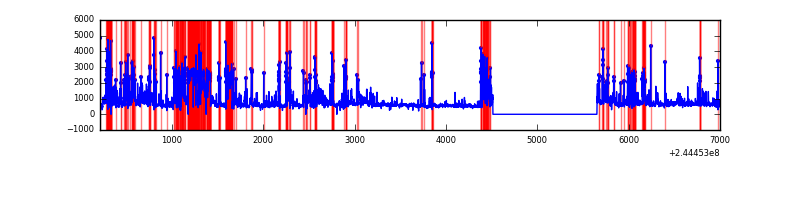 |
| B | 6789 | 5645 | 422 | 422 | 6.22% | 7.48% | 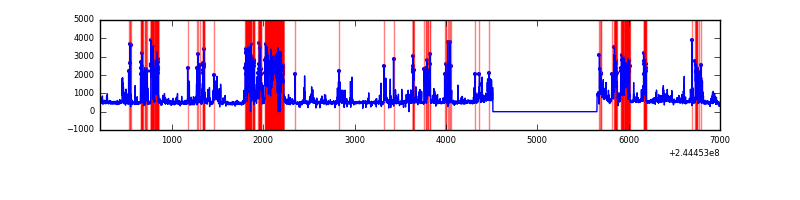 |
| C | 6789 | 5649 | 1 | 1 | 0.01% | 0.02% | 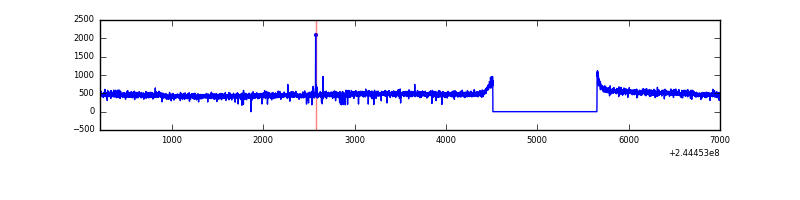 |
| D | 6789 | 5647 | 121 | 121 | 1.78% | 2.14% | 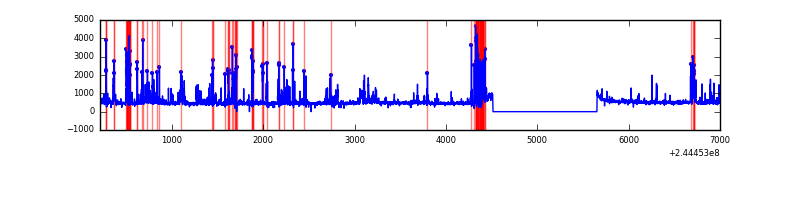 |
Top three noisy pixels from each quadrant. If the there are fewer than three noisy pixels in the level2.evt file, extra rows are filled as -1
| Pixel properties | Quadrant properties | ||||||
|---|---|---|---|---|---|---|---|
| Quadrant | DetID | PixID | Counts | Sigma | Mean | Median | Sigma |
| A | 8 | 5 | 2544428 | 19113.11 | 654 | 642 | 133.1 |
| A | 15 | 223 | 48293 | 358.03 | 654 | 642 | 133.1 |
| A | 13 | 251 | 35334 | 260.66 | 654 | 642 | 133.1 |
| B | 4 | 239 | 1739095 | 13445.19 | 673 | 658 | 129.3 |
| B | 15 | 185 | 60716 | 464.49 | 673 | 658 | 129.3 |
| B | 0 | 214 | 41135 | 313.05 | 673 | 658 | 129.3 |
| C | 14 | 234 | 5916 | 33.11 | 682 | 688 | 157.9 |
| C | 13 | 61 | 4845 | 26.33 | 682 | 688 | 157.9 |
| C | 14 | 67 | 2122 | 9.08 | 682 | 688 | 157.9 |
| D | 5 | 222 | 345298 | 2103.42 | 672 | 656 | 163.8 |
| D | 2 | 14 | 261489 | 1591.92 | 672 | 656 | 163.8 |
| D | 12 | 233 | 65421 | 395.27 | 672 | 656 | 163.8 |
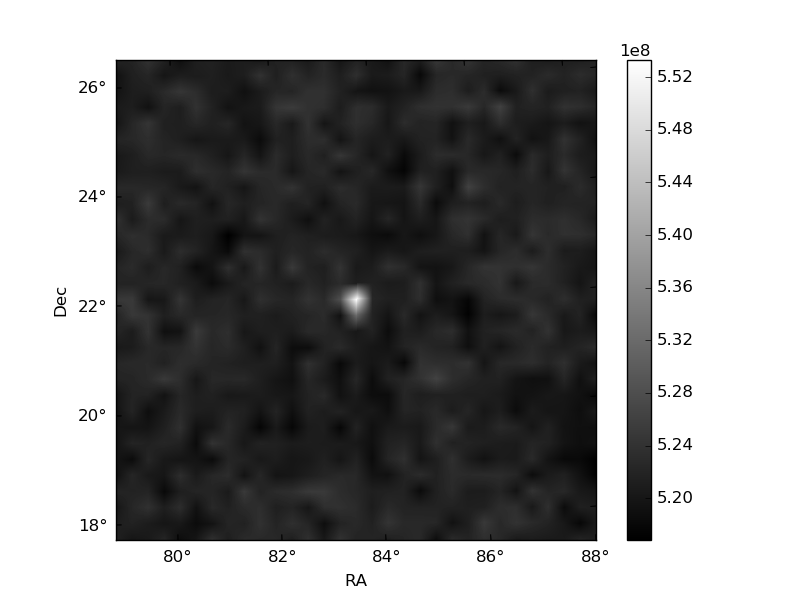
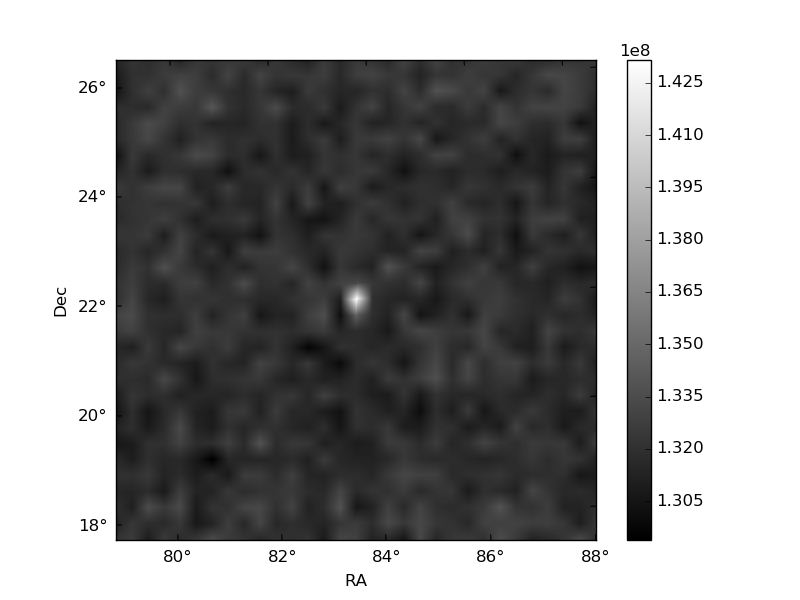
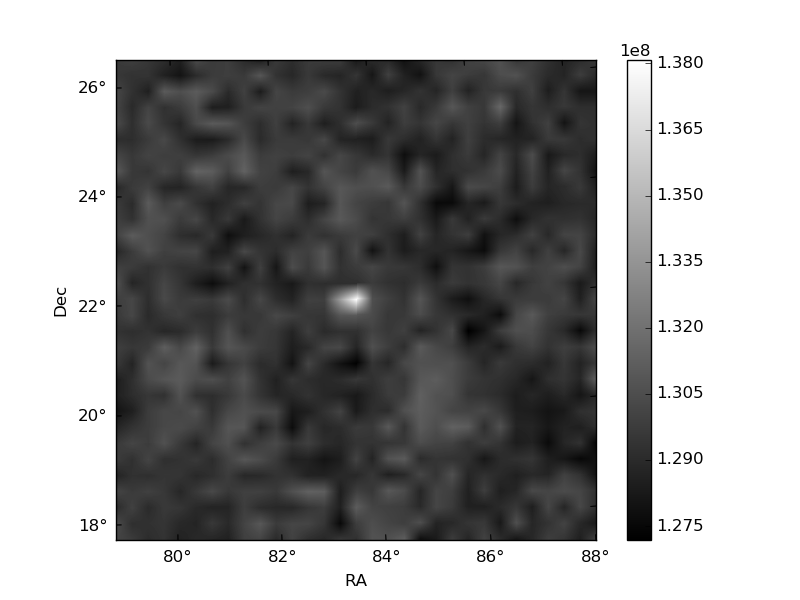
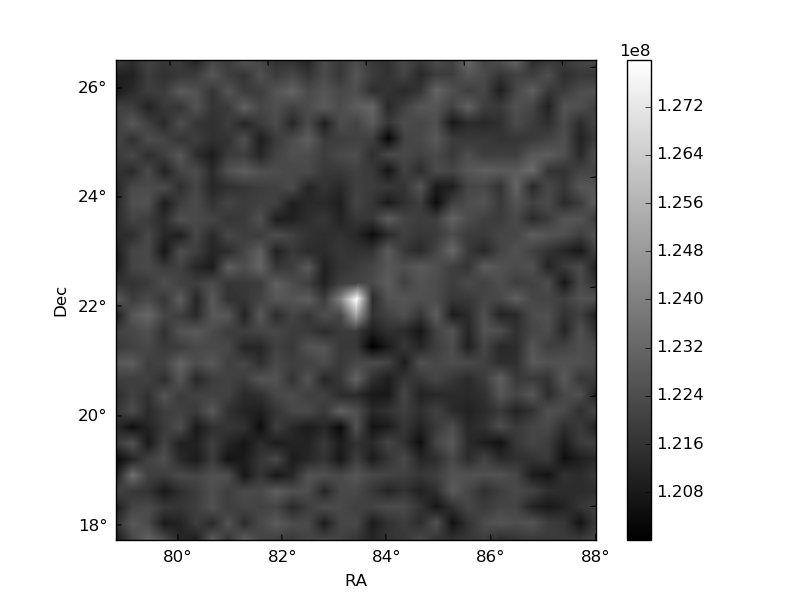
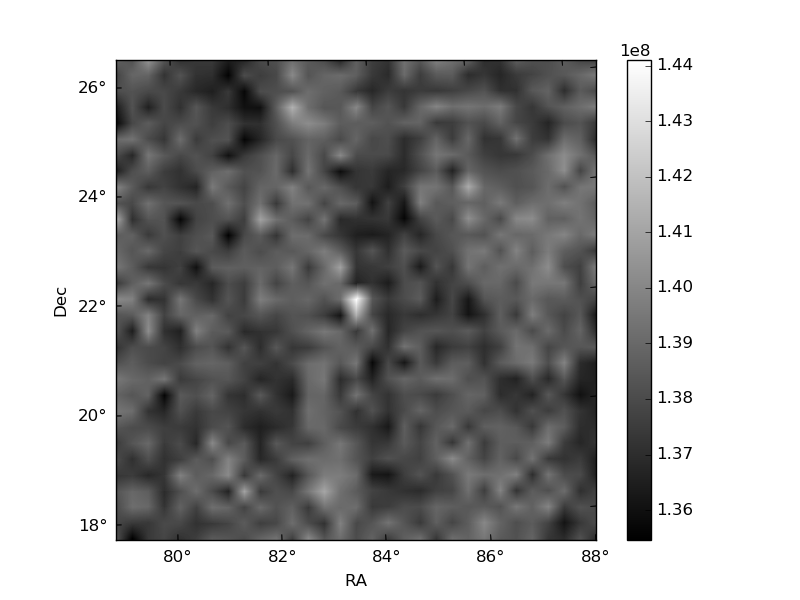
Histogram calculated using DETX and DETY for each event in the final _common_clean file
| Quadrant A | 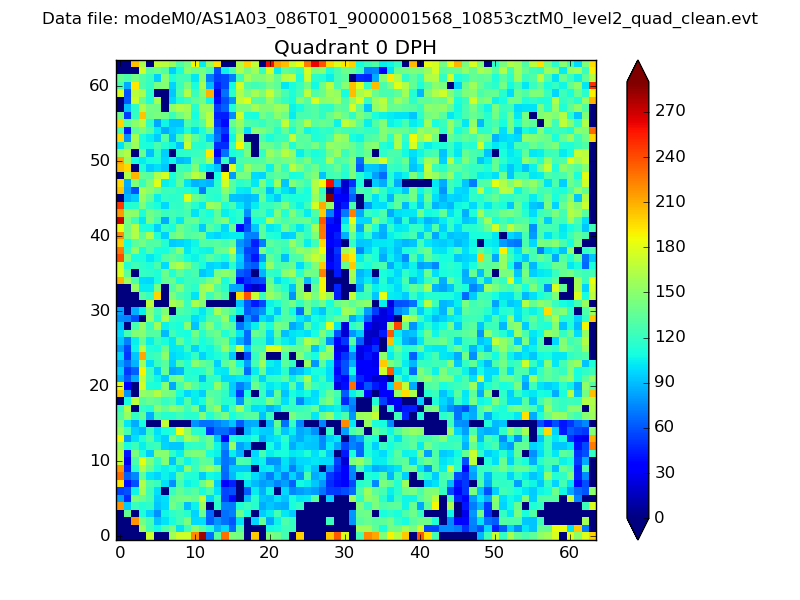 |
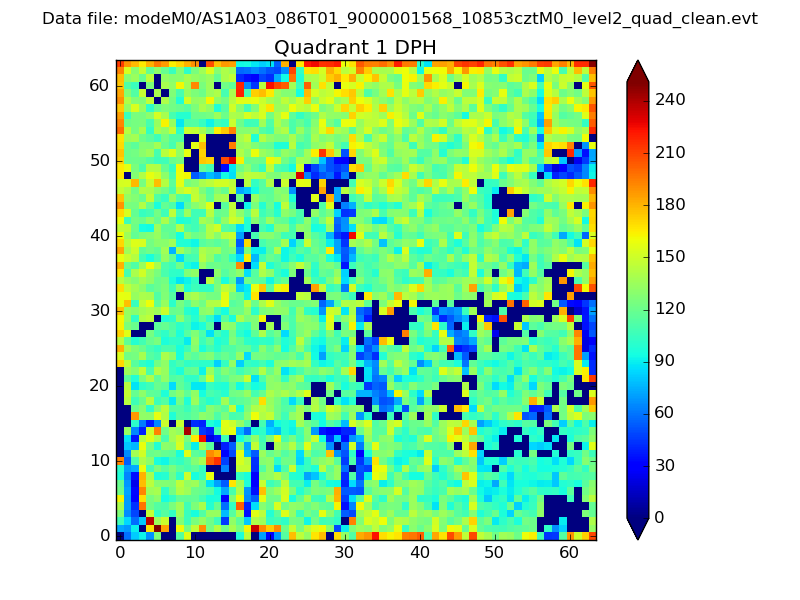 |
Quadrant B |
|---|---|---|---|
| Quadrant D |  |
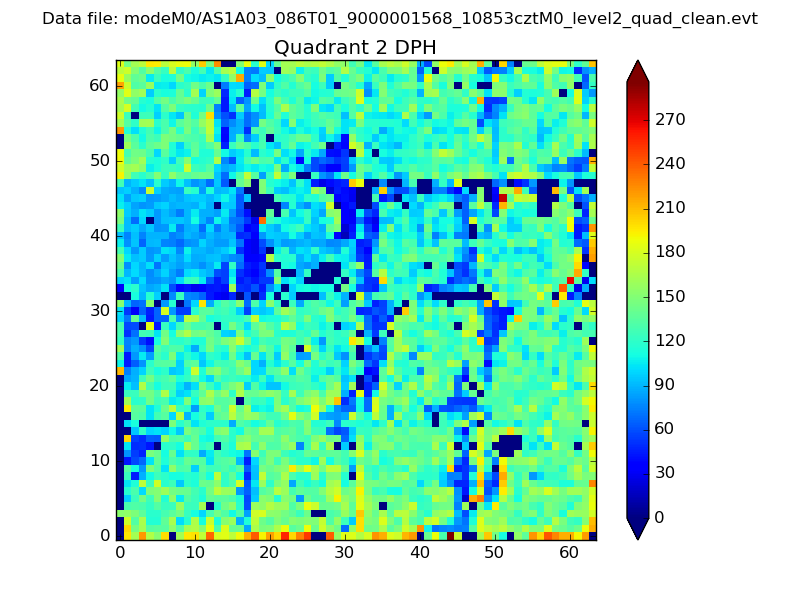 |
Quadrant C |
| Plot type | Count rate plots | Images |
|---|---|---|
| Comparison with Poisson distribution Blue bars denote a histogram of data divided into 1 sec bins. Red curve is a Poisson curve with rate = median count rate of data. |
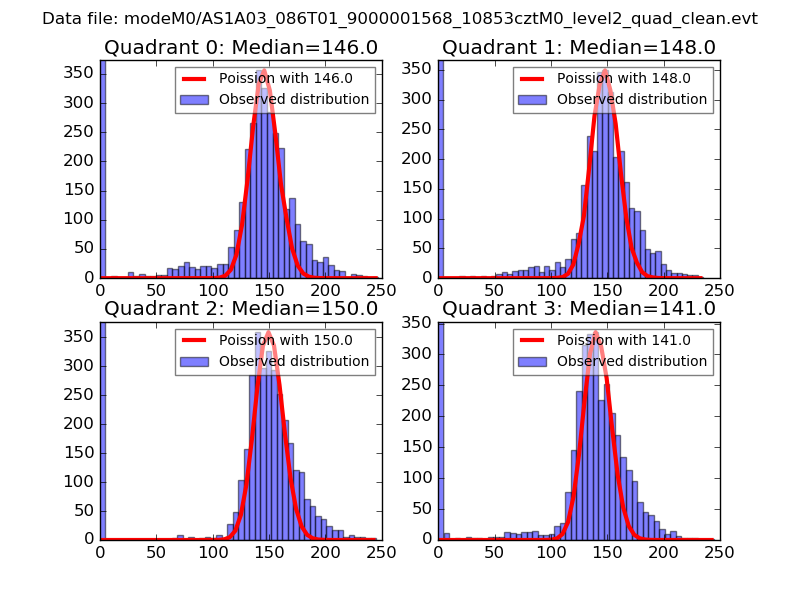 |
 |
| Quadrant-wise count rates Data is divided into 100 sec bins |
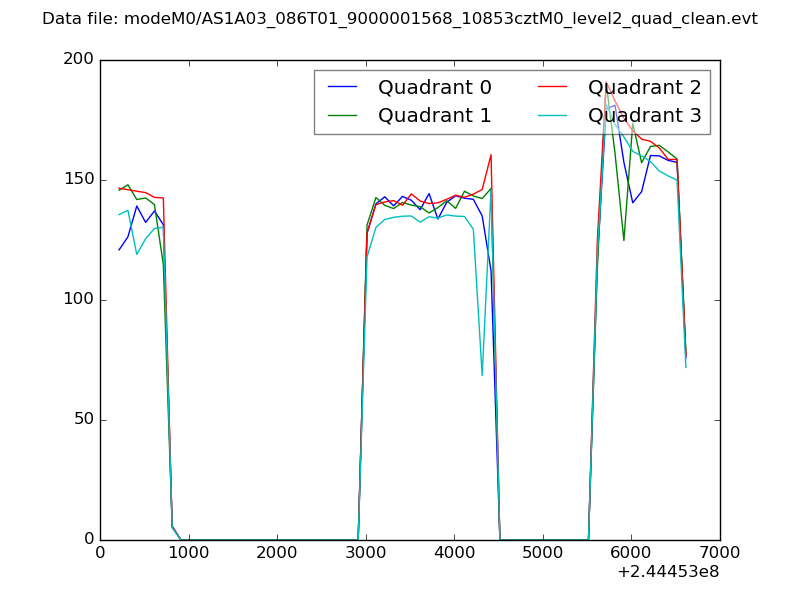 |
|
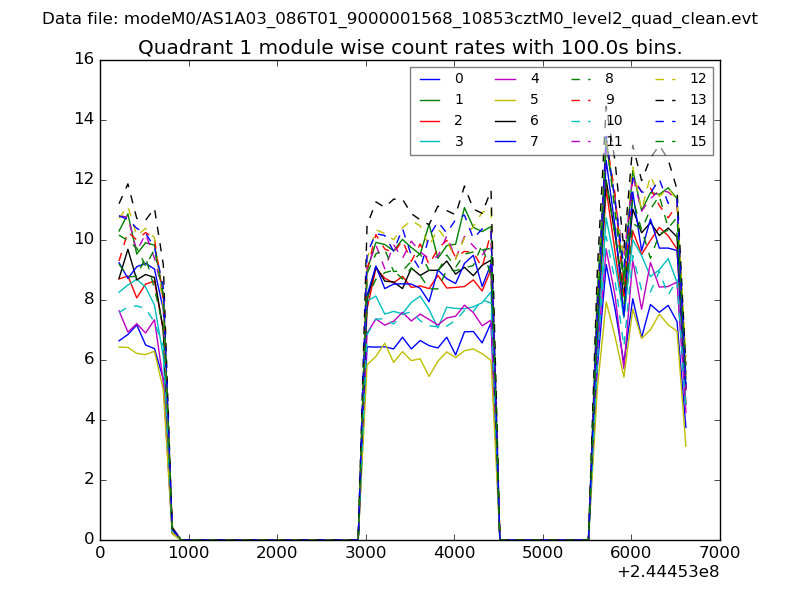
| Module-wise count rates for Quadrant A Data is divided into 100 sec bins |
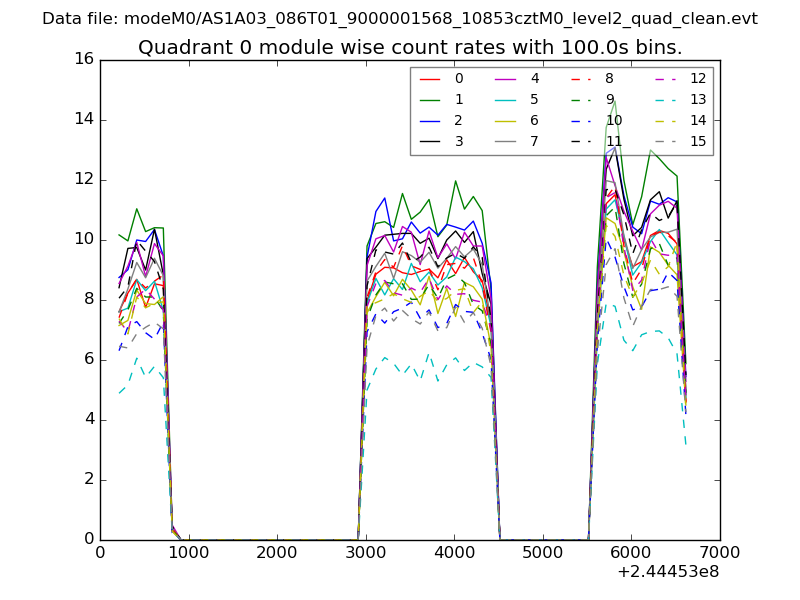 |
 |
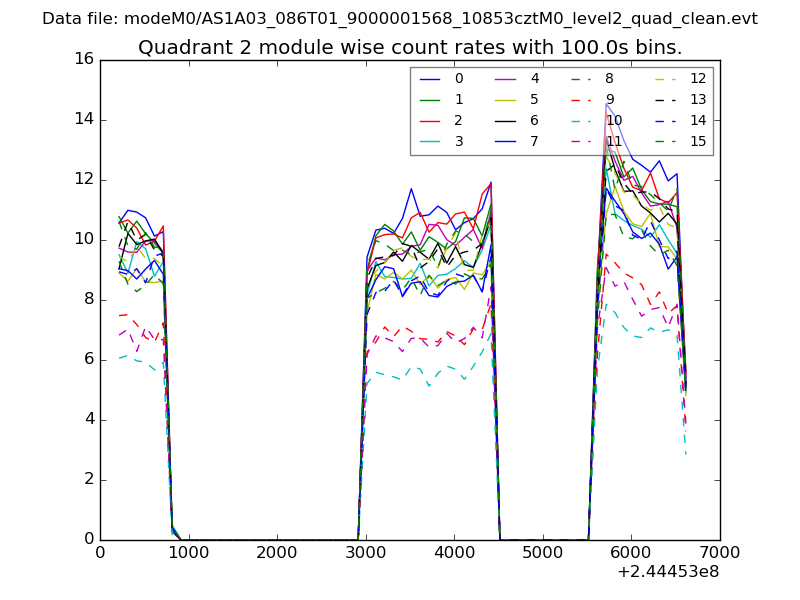
| Module-wise count rates for Quadrant B Data is divided into 100 sec bins |
 |
 |
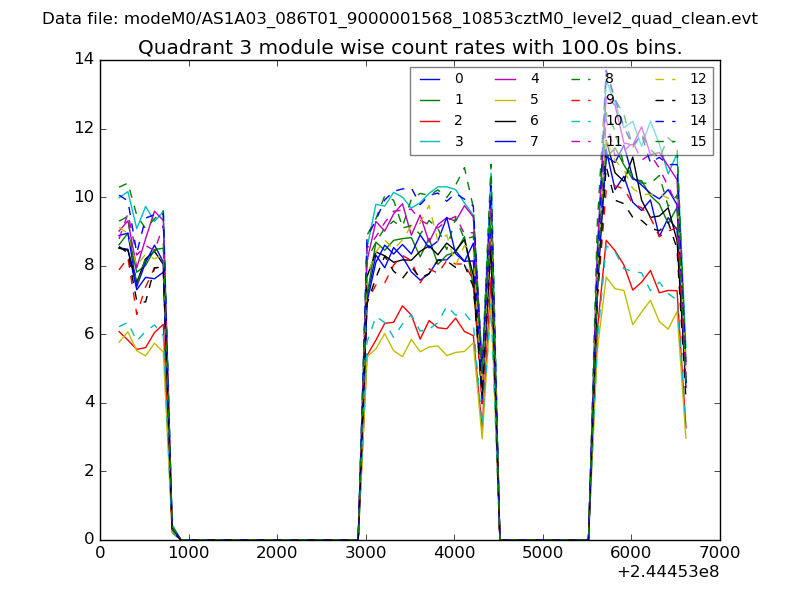
| Module-wise count rates for Quadrant C Data is divided into 100 sec bins |
 |
 |
| Module-wise count rates for Quadrant D Data is divided into 100 sec bins |
 |
 |
| Parameter | Plot |
|---|---|
| CZT HV Monitor | 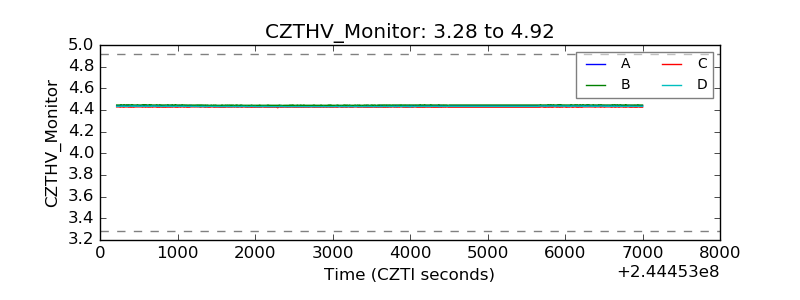 |
| D_VDD | 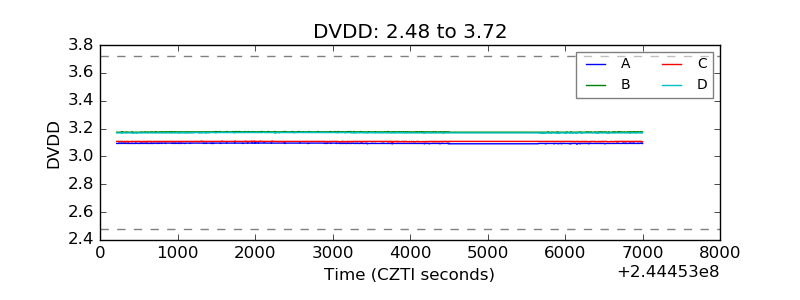 |
| Temperature 1 | 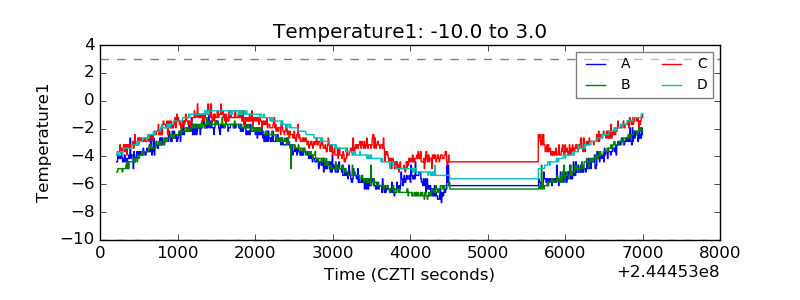 |
| Veto HV Monitor | 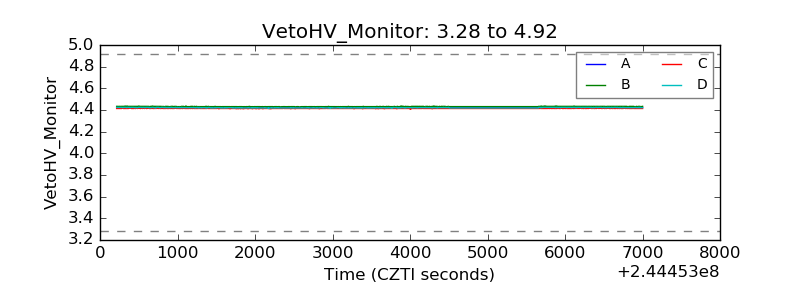 |
| Veto LLD | 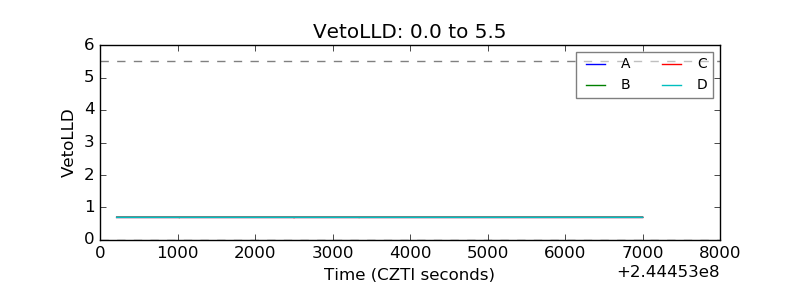 |
| Alpha Counter | 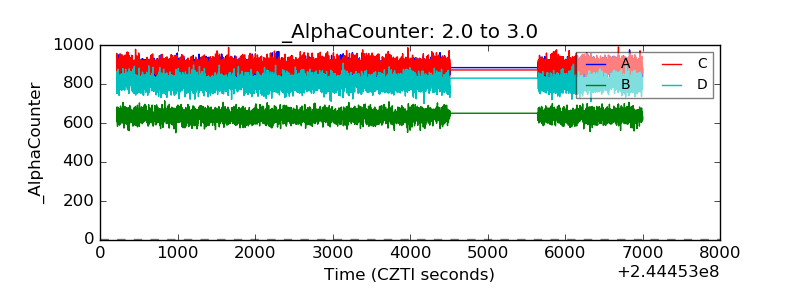 |
| _CPM_Rate | 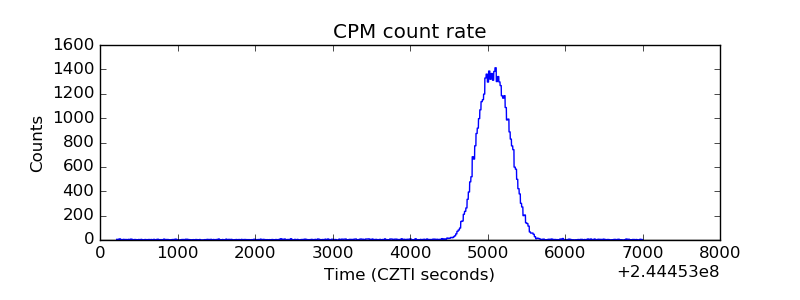 |
| CZT Counter |  |
| +2.5 Volts monitor | 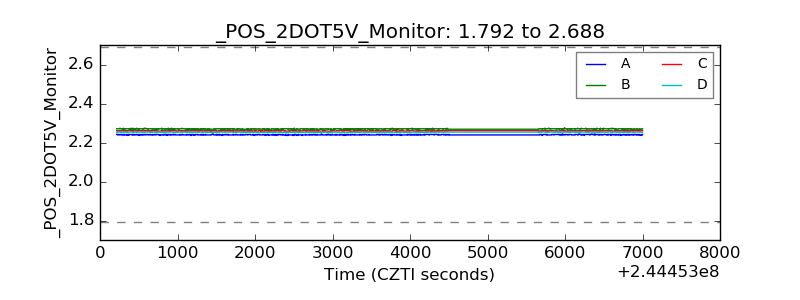 |
| +5 Volts monitor |  |
| _ROLL_ROT | 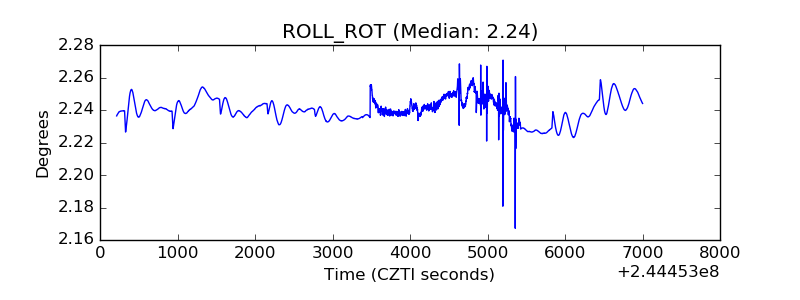 |
| _Roll_DEC | 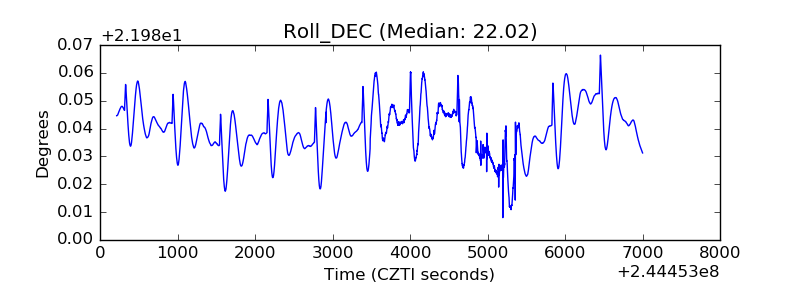 |
| _Roll_RA |  |
| Veto Counter | 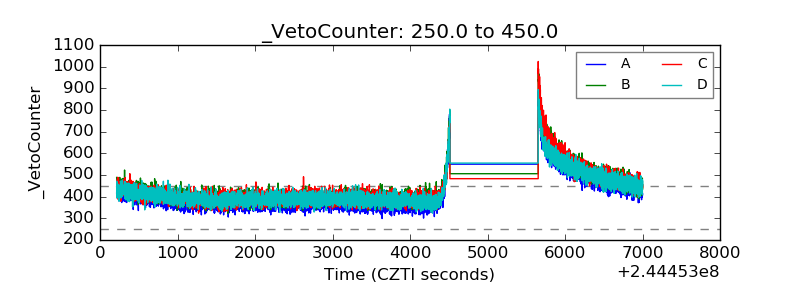 |