| Param | Original file | Final file |
|---|---|---|
| Filename | modeM0/AS1A03_086T01_9000001568_10855cztM0_level2.evt | modeM0/AS1A03_086T01_9000001568_10855cztM0_level2_quad_clean.evt |
| Size (bytes) | 623,082,240 | 71,516,160 |
| Size | 594.2 MB | 68.2 MB |
| Events in quadrant A | 5,970,722 | 426,412 |
| Events in quadrant B | 4,537,999 | 437,406 |
| Events in quadrant C | 3,227,172 | 442,512 |
| Events in quadrant D | 4,702,278 | 413,105 |
| Mode M9 | |||
|---|---|---|---|
| Quadrant | BADHDUFLAG | Total packets | Discarded packets |
| A | 0 | 12 | 0 |
| B | 0 | 12 | 0 |
| C | 0 | 12 | 0 |
| D | 0 | 12 | 0 |
| Mode SS | |||
|---|---|---|---|
| Quadrant | BADHDUFLAG | Total packets | Discarded packets |
| A | 0 | 132 | 0 |
| B | 0 | 132 | 0 |
| C | 0 | 132 | 0 |
| D | 0 | 132 | 0 |
| Mode M0 | |||
|---|---|---|---|
| Quadrant | BADHDUFLAG | Total packets | Discarded packets |
| A | 0 | 22508 | 2 |
| B | 0 | 17530 | 1 |
| C | 0 | 13323 | 1 |
| D | 0 | 18484 | 1 |
| Quadrant | Total seconds | Saturated seconds | Saturation percentage |
|---|---|---|---|
| A | 6382 | 501 | 7.850204% |
| B | 6382 | 374 | 5.860232% |
| C | 6382 | 73 | 1.143842% |
| D | 6382 | 223 | 3.494202% |
Noise dominated data is calculated using 1-second bins in cleaned event files. If a bin has >2000 counts, and if more than 50% of those come from <1% of pixels, then it is considered to be noise-dominated and hence unusable.
| Quadrant | # 1 sec bins | Bins with >0 counts | Bins with >2000 counts | High rate bins dominated by noise | Noise dominated (total time) | Noise dominated (detector-on time) | Marked lightcurve |
|---|---|---|---|---|---|---|---|
| A | 7627 | 6383 | 257 | 257 | 3.37% | 4.03% |  |
| B | 7627 | 6383 | 184 | 184 | 2.41% | 2.88% | 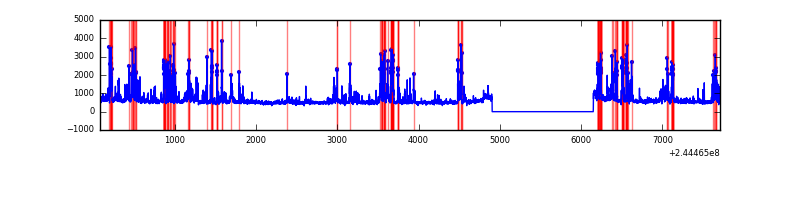 |
| C | 7627 | 6383 | 0 | 0 | 0.00% | 0.00% | 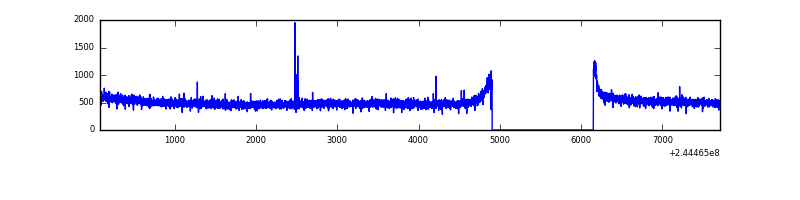 |
| D | 7627 | 6383 | 121 | 121 | 1.59% | 1.90% | 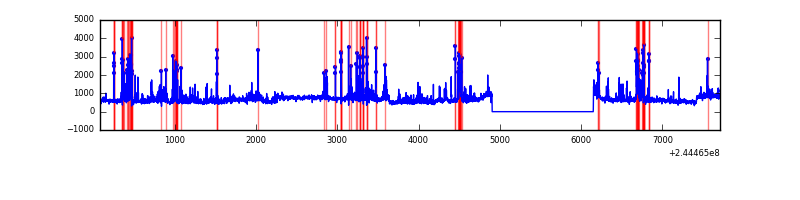 |
Top three noisy pixels from each quadrant. If the there are fewer than three noisy pixels in the level2.evt file, extra rows are filled as -1
| Pixel properties | Quadrant properties | ||||||
|---|---|---|---|---|---|---|---|
| Quadrant | DetID | PixID | Counts | Sigma | Mean | Median | Sigma |
| A | 8 | 5 | 2328878 | 14024.05 | 831 | 818 | 166.0 |
| A | 8 | 15 | 141512 | 847.53 | 831 | 818 | 166.0 |
| A | 15 | 223 | 90004 | 537.25 | 831 | 818 | 166.0 |
| B | 4 | 239 | 1129392 | 7301.78 | 831 | 815 | 154.6 |
| B | 0 | 214 | 40352 | 255.8 | 831 | 815 | 154.6 |
| B | 0 | 219 | 27197 | 170.69 | 831 | 815 | 154.6 |
| C | 14 | 234 | 8533 | 40.63 | 824 | 831 | 189.6 |
| C | 14 | 67 | 6984 | 32.46 | 824 | 831 | 189.6 |
| C | 13 | 61 | 6286 | 28.78 | 824 | 831 | 189.6 |
| D | 13 | 152 | 606152 | 3127.47 | 818 | 799 | 193.6 |
| D | 5 | 222 | 213166 | 1097.16 | 818 | 799 | 193.6 |
| D | 2 | 14 | 175137 | 900.69 | 818 | 799 | 193.6 |
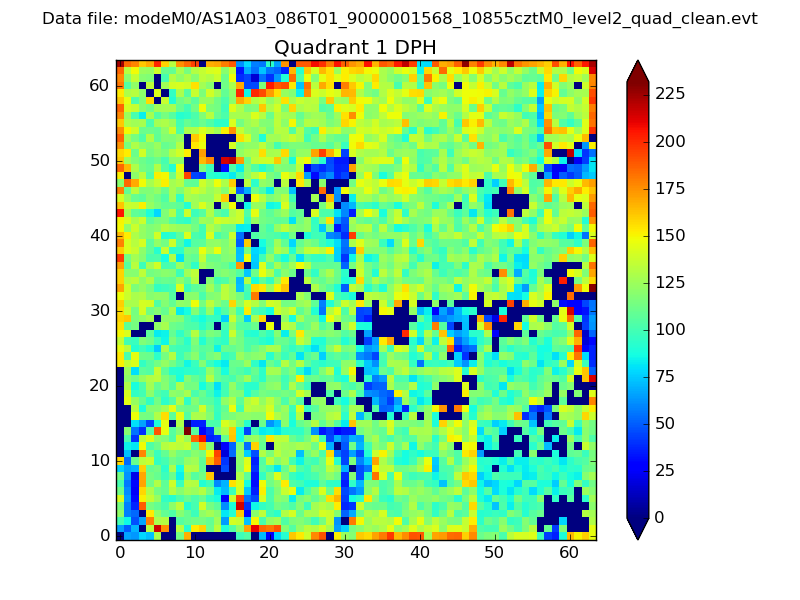
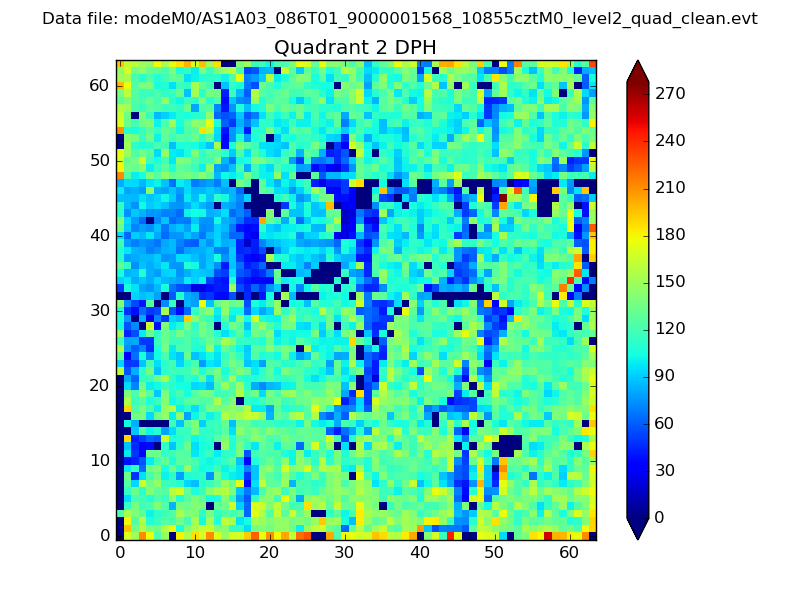
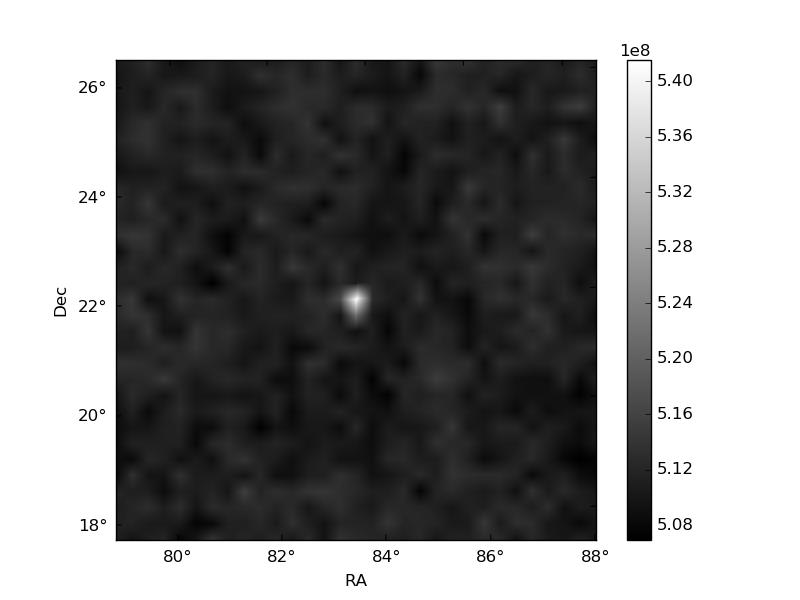
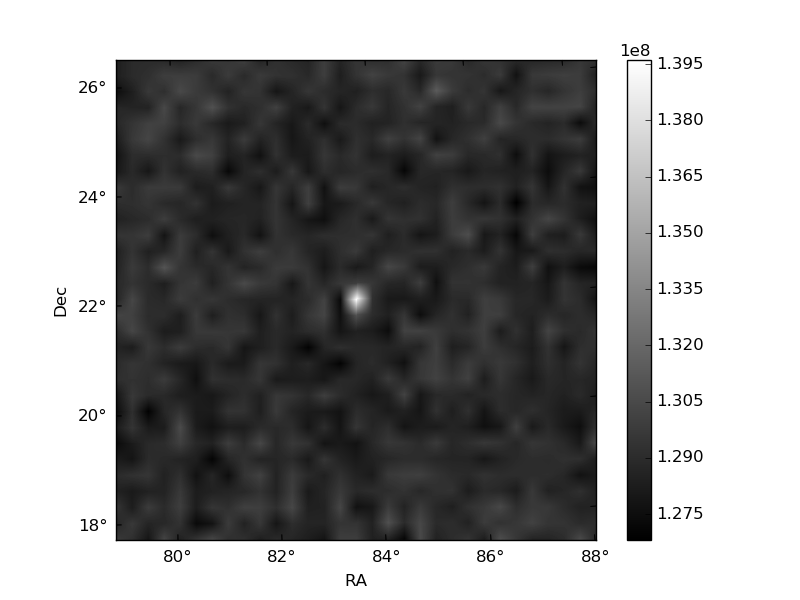
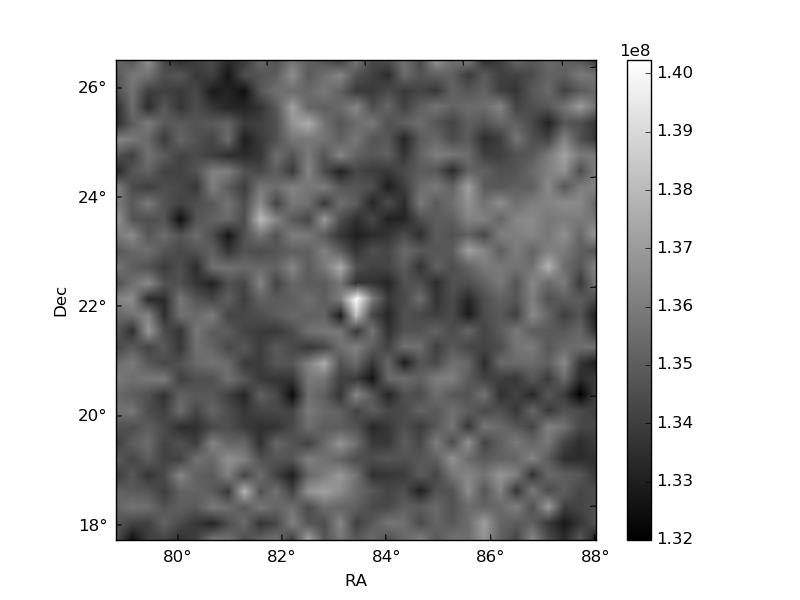
Histogram calculated using DETX and DETY for each event in the final _common_clean file
| Quadrant A | 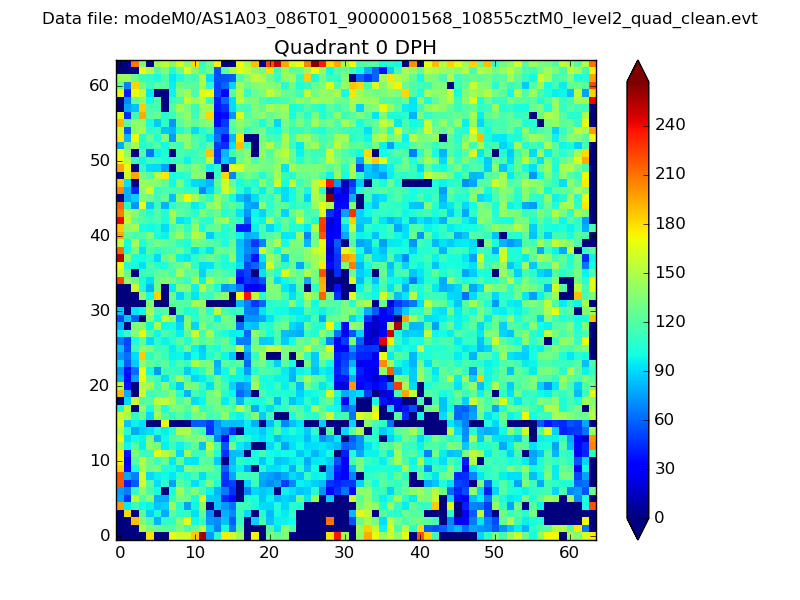 |
 |
Quadrant B |
|---|---|---|---|
| Quadrant D | 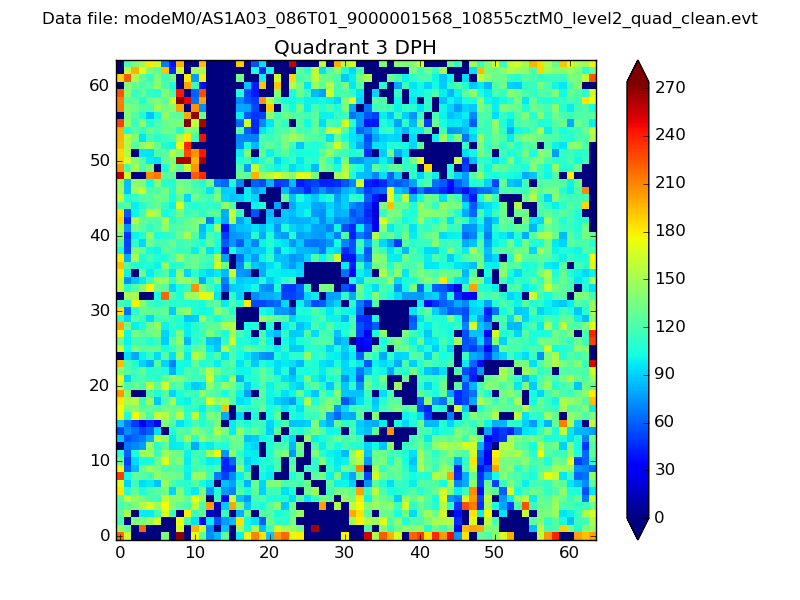 |
 |
Quadrant C |
| Plot type | Count rate plots | Images |
|---|---|---|
| Comparison with Poisson distribution Blue bars denote a histogram of data divided into 1 sec bins. Red curve is a Poisson curve with rate = median count rate of data. |
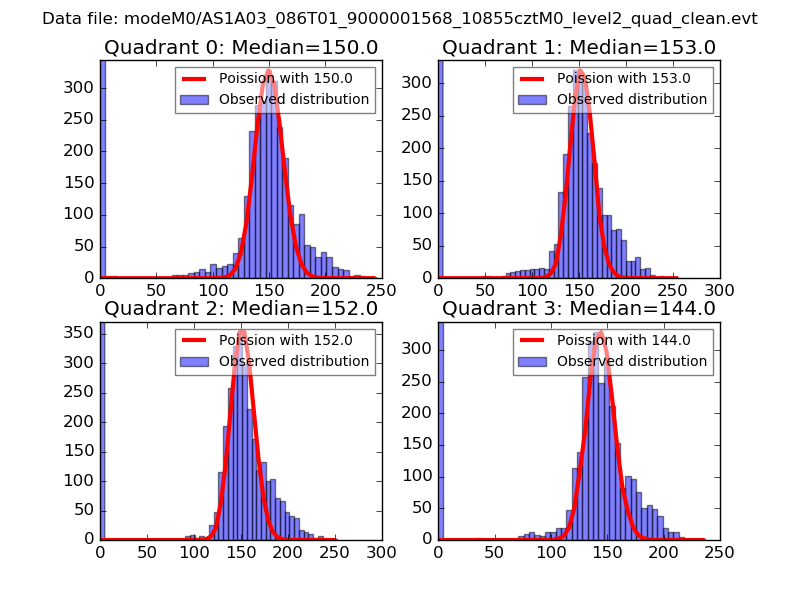 |
 |
| Quadrant-wise count rates Data is divided into 100 sec bins |
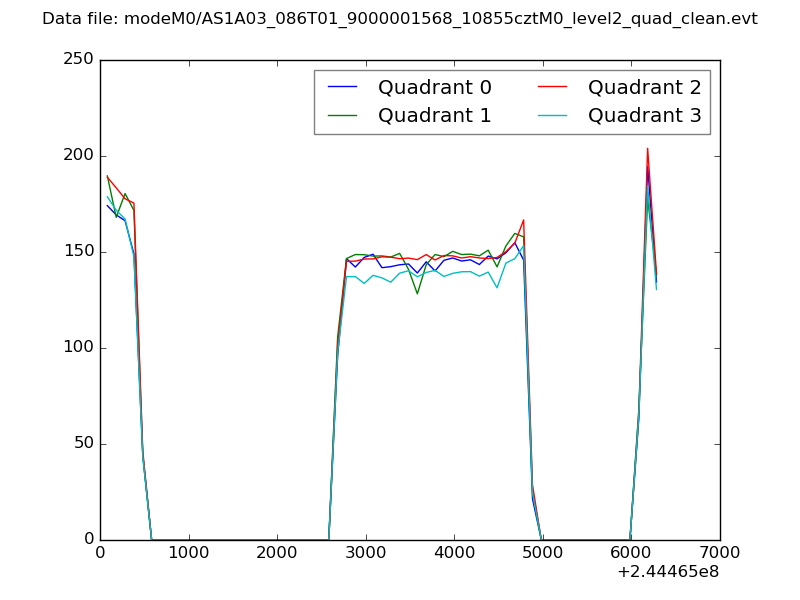 |
|
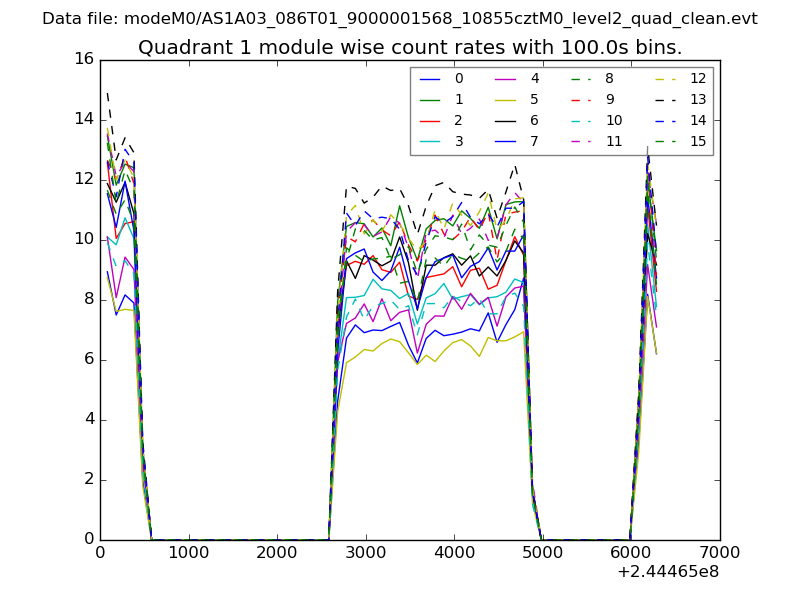
| Module-wise count rates for Quadrant A Data is divided into 100 sec bins |
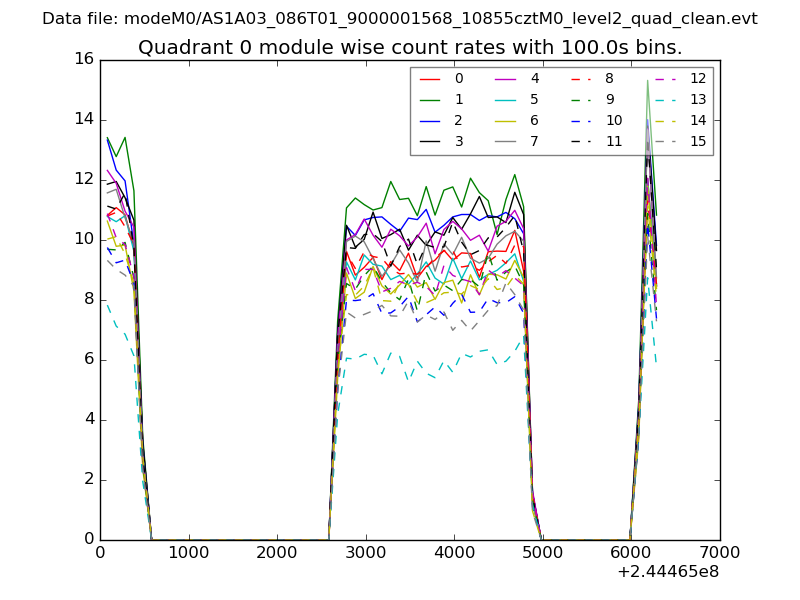 |
 |
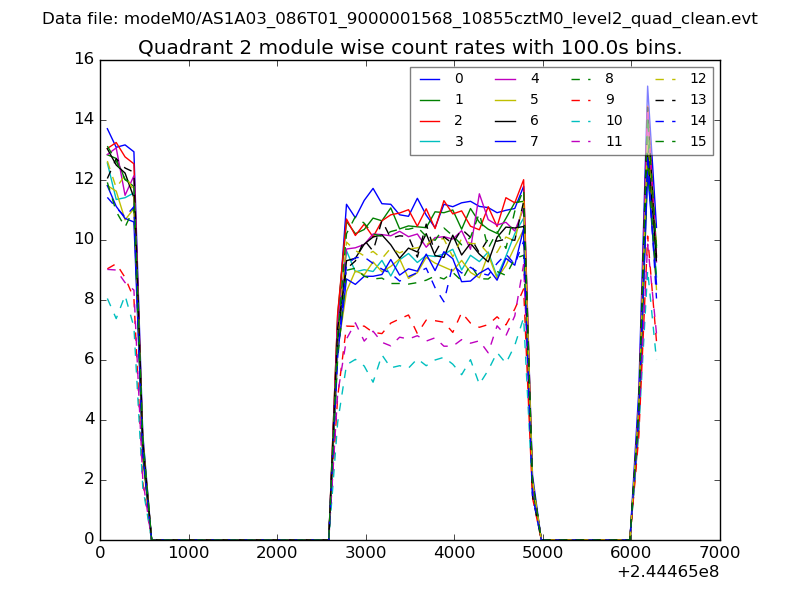
| Module-wise count rates for Quadrant B Data is divided into 100 sec bins |
 |
 |
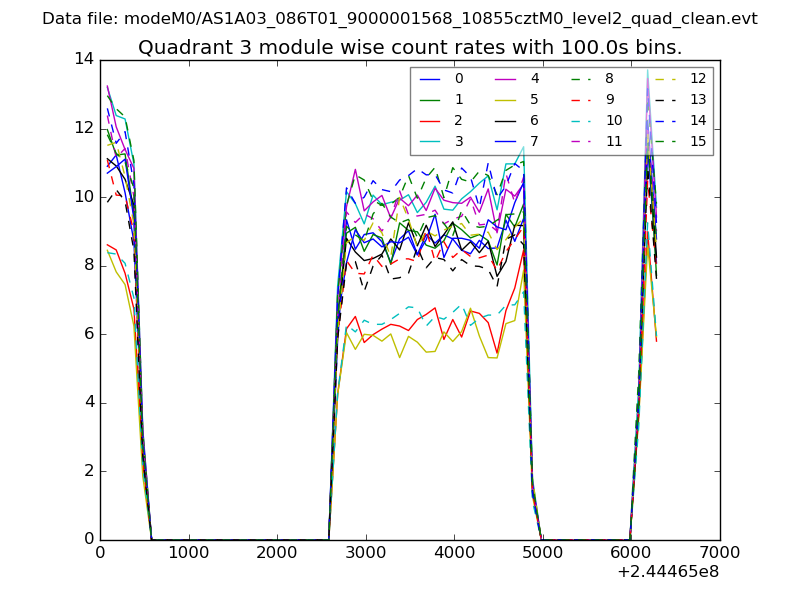
| Module-wise count rates for Quadrant C Data is divided into 100 sec bins |
 |
 |
| Module-wise count rates for Quadrant D Data is divided into 100 sec bins |
 |
 |
| Parameter | Plot |
|---|---|
| CZT HV Monitor | 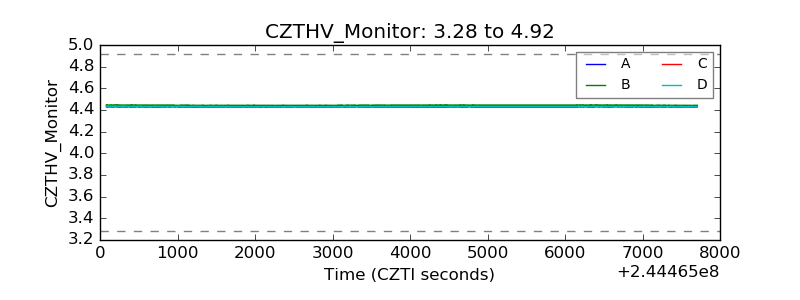 |
| D_VDD | 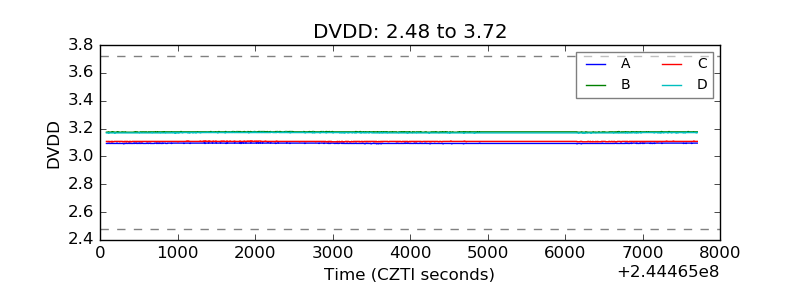 |
| Temperature 1 | 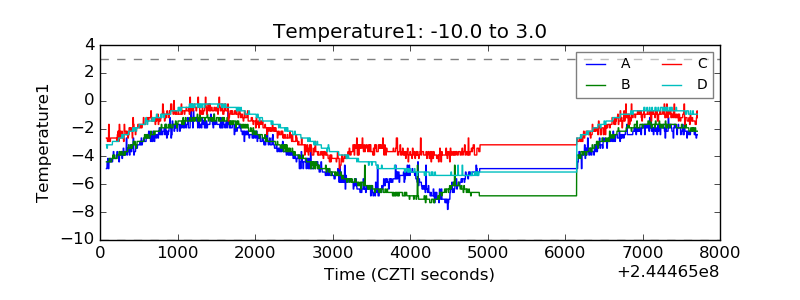 |
| Veto HV Monitor | 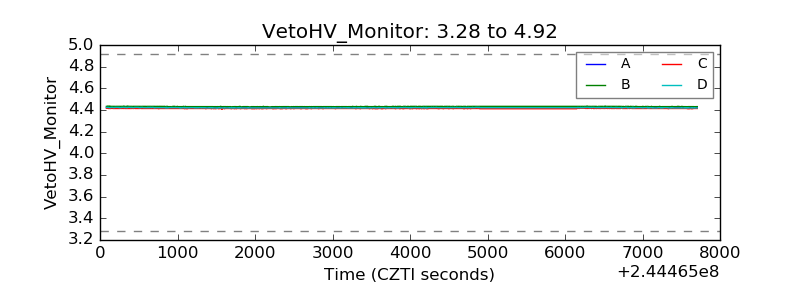 |
| Veto LLD | 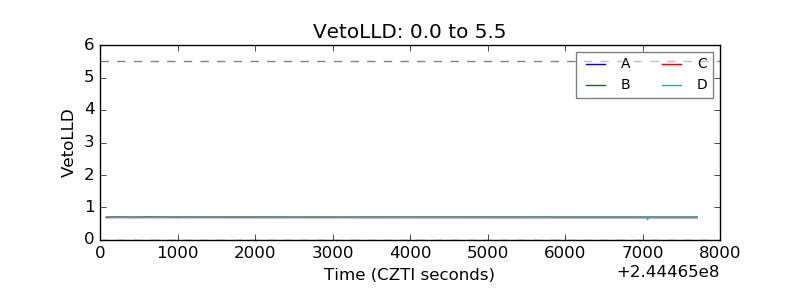 |
| Alpha Counter | 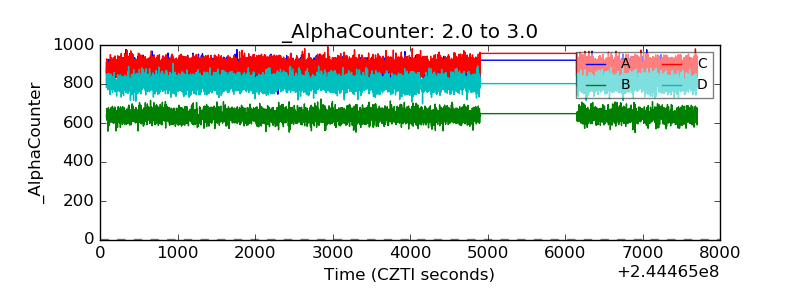 |
| _CPM_Rate | 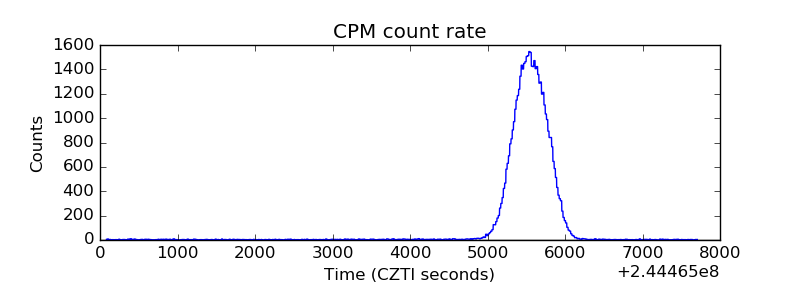 |
| CZT Counter | 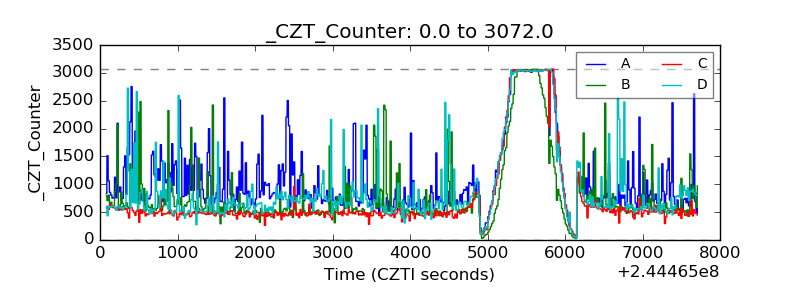 |
| +2.5 Volts monitor | 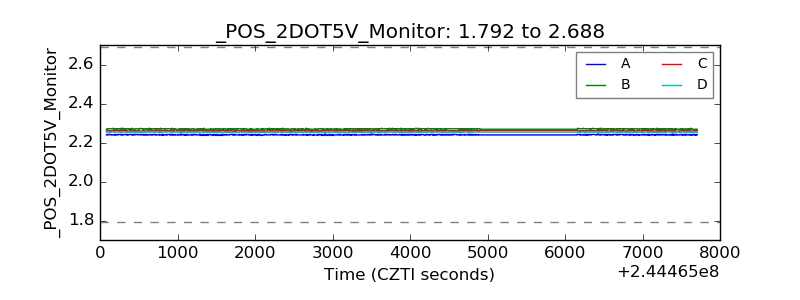 |
| +5 Volts monitor | 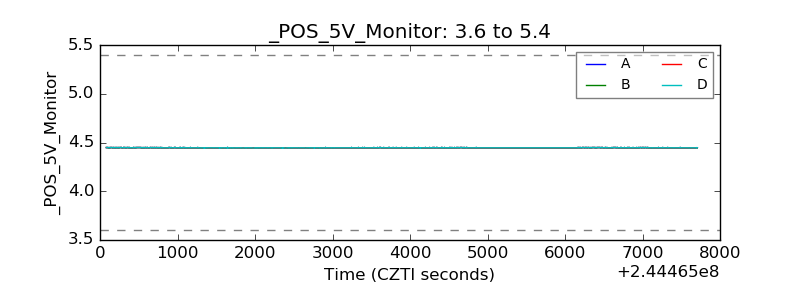 |
| _ROLL_ROT | 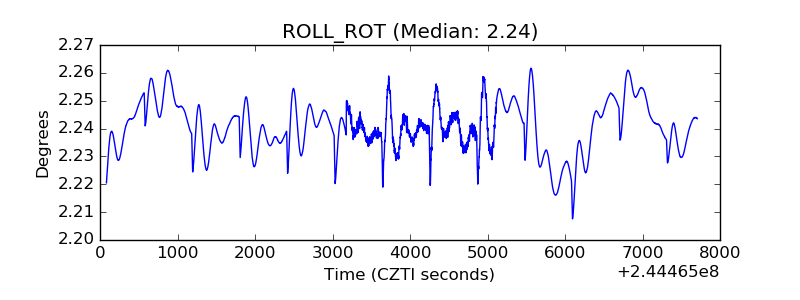 |
| _Roll_DEC | 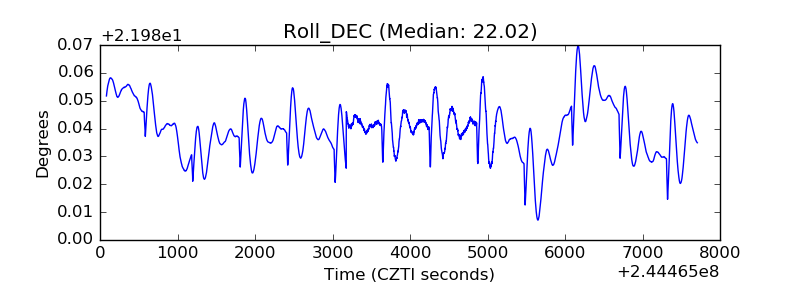 |
| _Roll_RA | 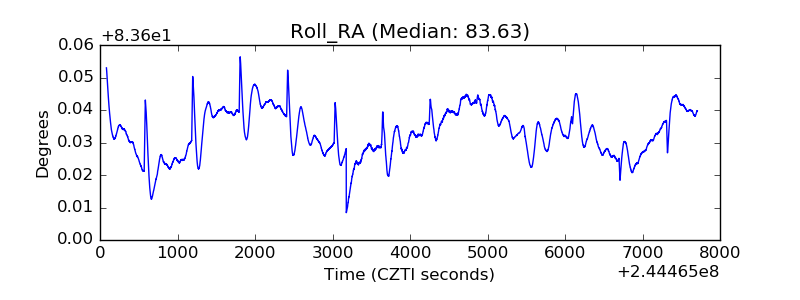 |
| Veto Counter | 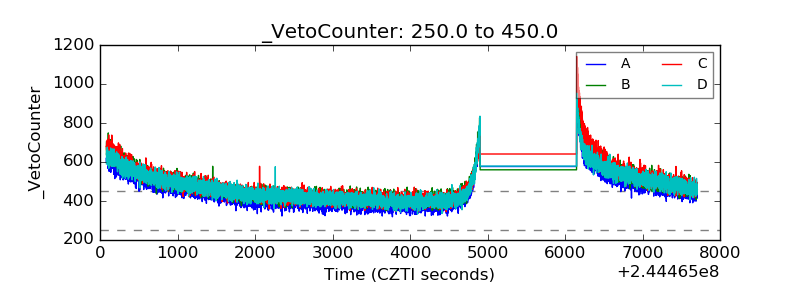 |