| Param | Original file | Final file |
|---|---|---|
| Filename | modeM0/AS1A03_086T01_9000001568_10856cztM0_level2.evt | modeM0/AS1A03_086T01_9000001568_10856cztM0_level2_quad_clean.evt |
| Size (bytes) | 609,747,840 | 70,266,240 |
| Size | 581.5 MB | 67.0 MB |
| Events in quadrant A | 5,256,387 | 419,359 |
| Events in quadrant B | 4,729,067 | 420,418 |
| Events in quadrant C | 3,306,814 | 431,034 |
| Events in quadrant D | 4,735,040 | 403,841 |
| Mode M9 | |||
|---|---|---|---|
| Quadrant | BADHDUFLAG | Total packets | Discarded packets |
| A | 0 | 18 | 0 |
| B | 0 | 18 | 0 |
| C | 0 | 18 | 0 |
| D | 0 | 19 | 0 |
| Mode SS | |||
|---|---|---|---|
| Quadrant | BADHDUFLAG | Total packets | Discarded packets |
| A | 0 | 130 | 0 |
| B | 0 | 130 | 0 |
| C | 0 | 130 | 0 |
| D | 0 | 130 | 0 |
| Mode M0 | |||
|---|---|---|---|
| Quadrant | BADHDUFLAG | Total packets | Discarded packets |
| A | 0 | 20592 | 3 |
| B | 0 | 18184 | 2 |
| C | 0 | 13668 | 2 |
| D | 0 | 18443 | 2 |
| Quadrant | Total seconds | Saturated seconds | Saturation percentage |
|---|---|---|---|
| A | 6495 | 449 | 6.913010% |
| B | 6495 | 445 | 6.851424% |
| C | 6495 | 87 | 1.339492% |
| D | 6495 | 197 | 3.033102% |
Noise dominated data is calculated using 1-second bins in cleaned event files. If a bin has >2000 counts, and if more than 50% of those come from <1% of pixels, then it is considered to be noise-dominated and hence unusable.
| Quadrant | # 1 sec bins | Bins with >0 counts | Bins with >2000 counts | High rate bins dominated by noise | Noise dominated (total time) | Noise dominated (detector-on time) | Marked lightcurve |
|---|---|---|---|---|---|---|---|
| A | 7740 | 6496 | 209 | 209 | 2.70% | 3.22% | 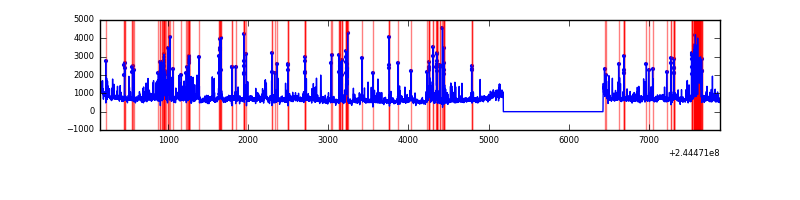 |
| B | 7740 | 6496 | 230 | 230 | 2.97% | 3.54% | 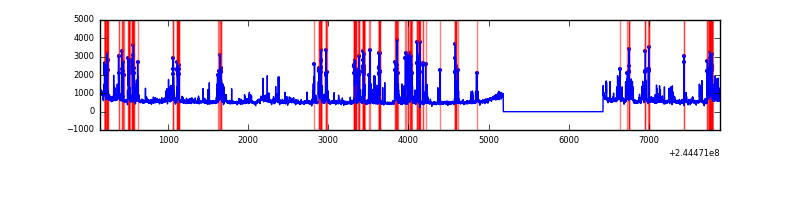 |
| C | 7740 | 6496 | 1 | 1 | 0.01% | 0.02% | 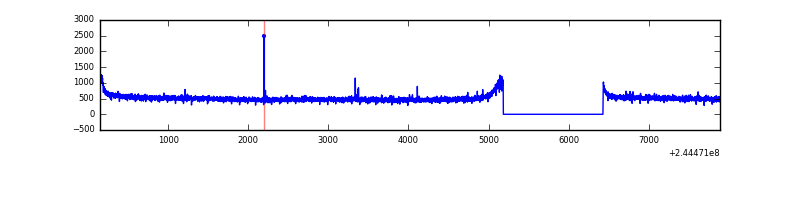 |
| D | 7740 | 6495 | 84 | 84 | 1.09% | 1.29% | 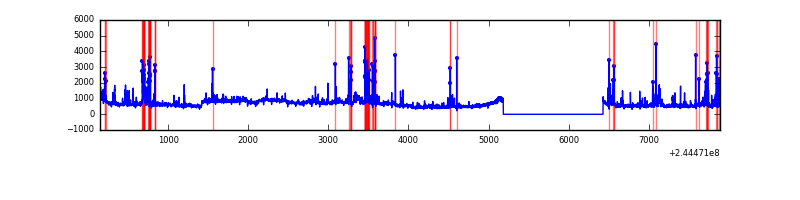 |
Top three noisy pixels from each quadrant. If the there are fewer than three noisy pixels in the level2.evt file, extra rows are filled as -1
| Pixel properties | Quadrant properties | ||||||
|---|---|---|---|---|---|---|---|
| Quadrant | DetID | PixID | Counts | Sigma | Mean | Median | Sigma |
| A | 8 | 5 | 1394976 | 8185.37 | 847 | 834 | 170.3 |
| A | 15 | 223 | 283155 | 1657.58 | 847 | 834 | 170.3 |
| A | 8 | 15 | 127915 | 746.13 | 847 | 834 | 170.3 |
| B | 4 | 239 | 1162840 | 7325.11 | 846 | 829 | 158.6 |
| B | 3 | 189 | 76865 | 479.32 | 846 | 829 | 158.6 |
| B | 0 | 219 | 62499 | 388.76 | 846 | 829 | 158.6 |
| C | 14 | 234 | 10137 | 47.67 | 844 | 852 | 194.8 |
| C | 14 | 67 | 7353 | 33.38 | 844 | 852 | 194.8 |
| C | 13 | 61 | 6484 | 28.92 | 844 | 852 | 194.8 |
| D | 13 | 152 | 783153 | 3854.44 | 838 | 814 | 203.0 |
| D | 1 | 52 | 252147 | 1238.27 | 838 | 814 | 203.0 |
| D | 13 | 104 | 141727 | 694.25 | 838 | 814 | 203.0 |
Histogram calculated using DETX and DETY for each event in the final _common_clean file
| Quadrant A | 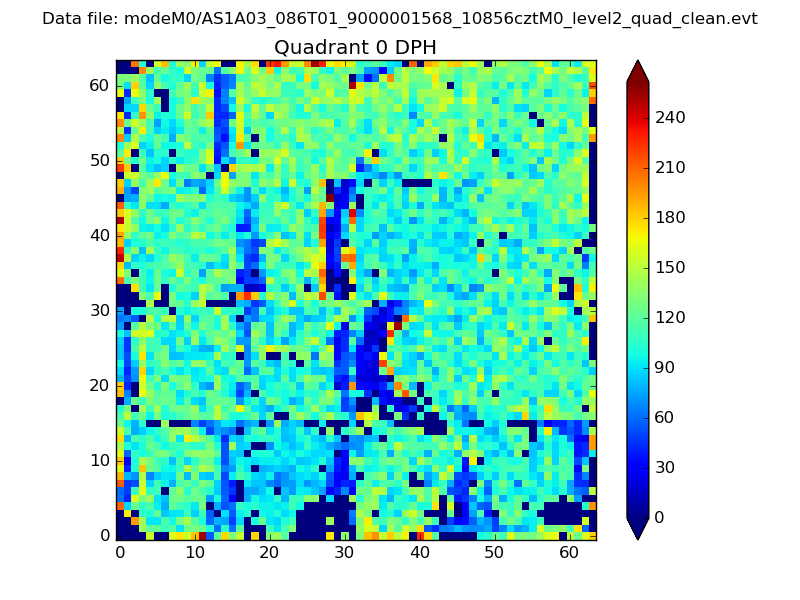 |
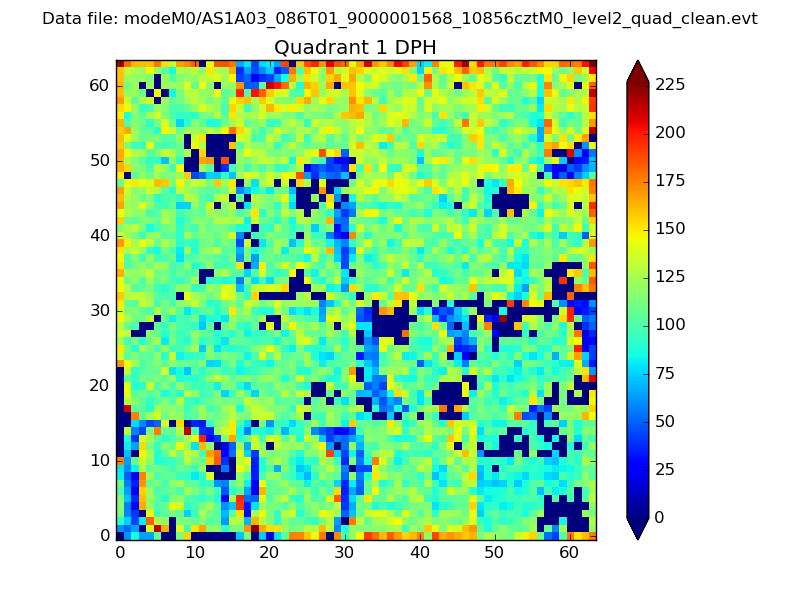 |
Quadrant B |
|---|---|---|---|
| Quadrant D | 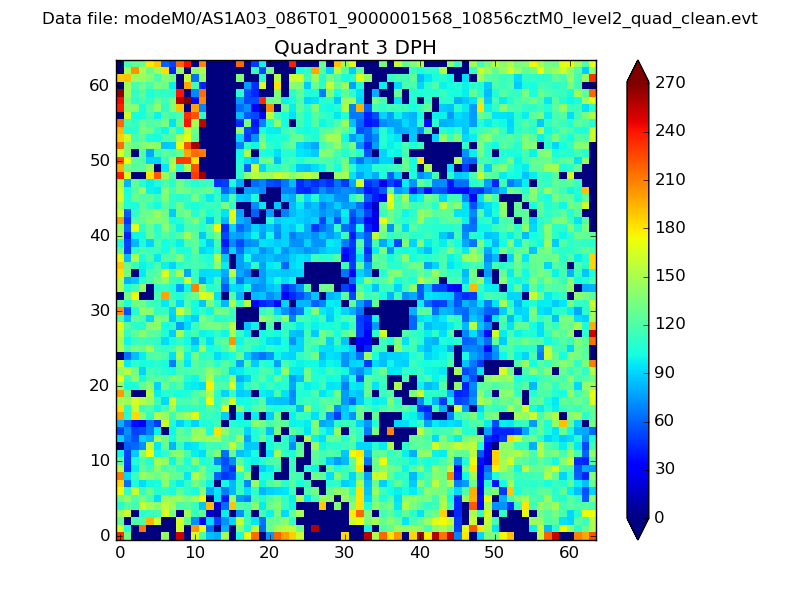 |
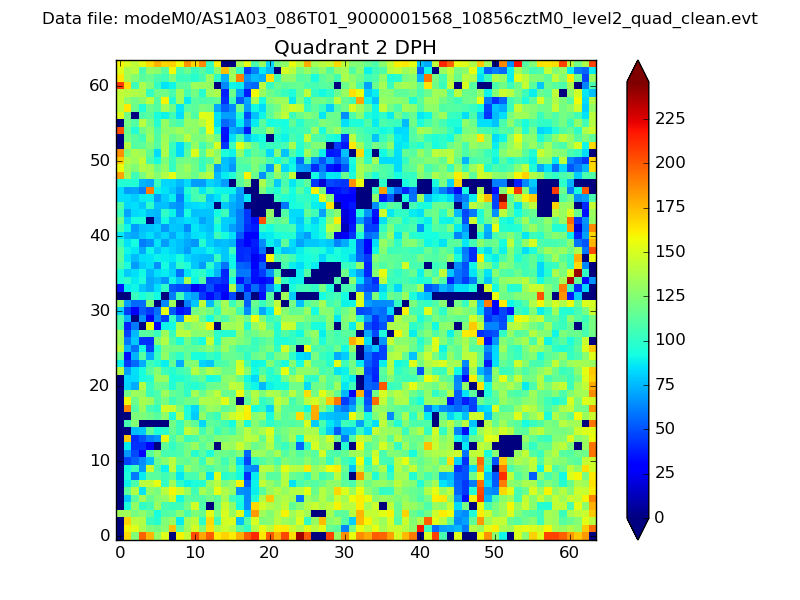 |
Quadrant C |
| Plot type | Count rate plots | Images |
|---|---|---|
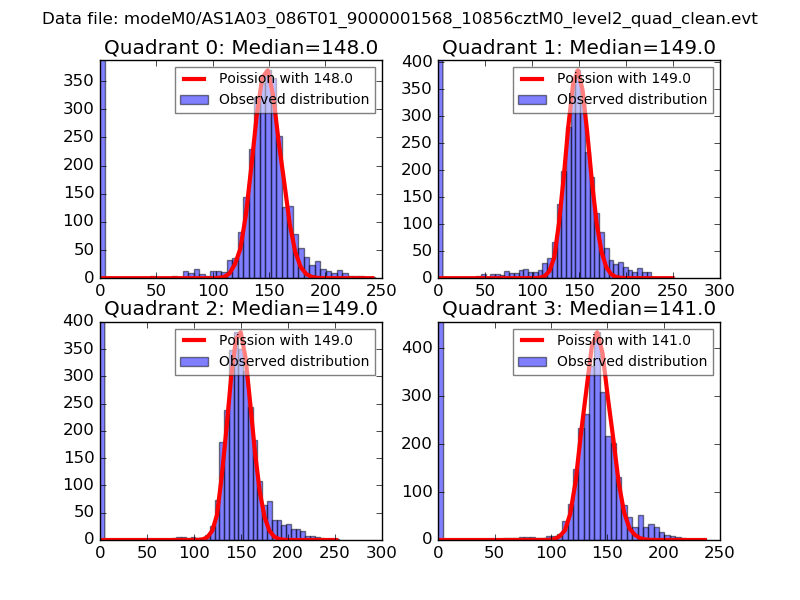
| Comparison with Poisson distribution Blue bars denote a histogram of data divided into 1 sec bins. Red curve is a Poisson curve with rate = median count rate of data. |
 |
 |
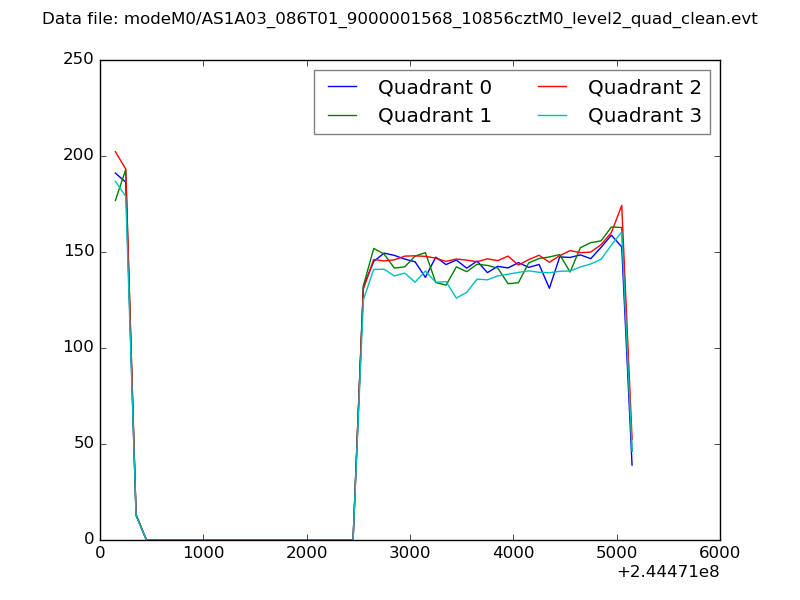
| Quadrant-wise count rates Data is divided into 100 sec bins |
 |
|
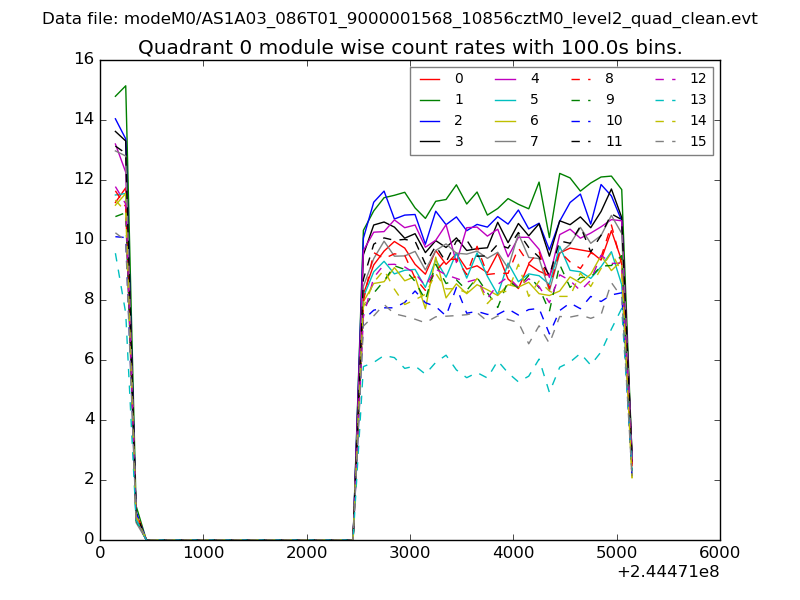
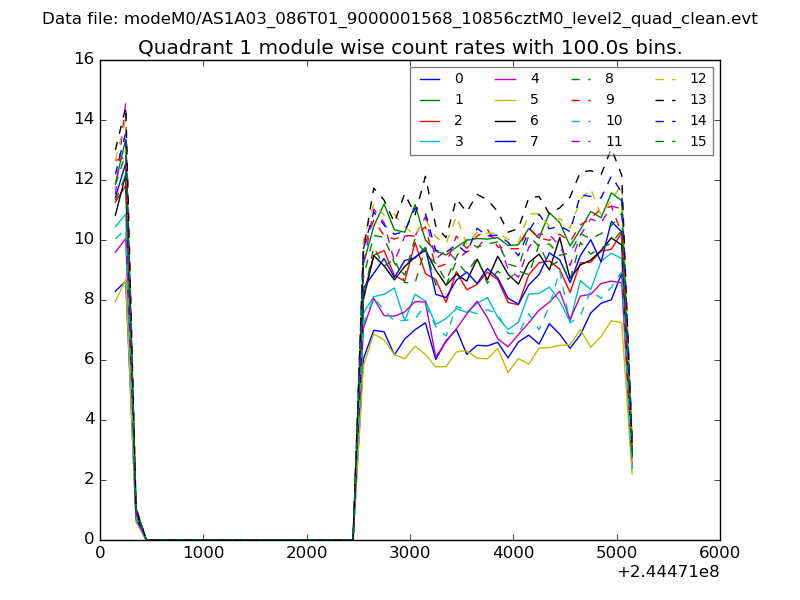
| Module-wise count rates for Quadrant A Data is divided into 100 sec bins |
 |
 |
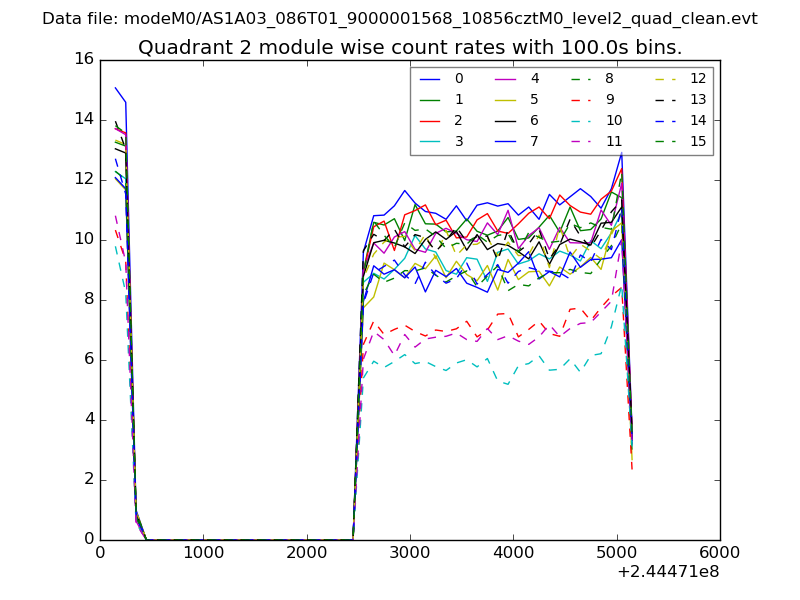
| Module-wise count rates for Quadrant B Data is divided into 100 sec bins |
 |
 |
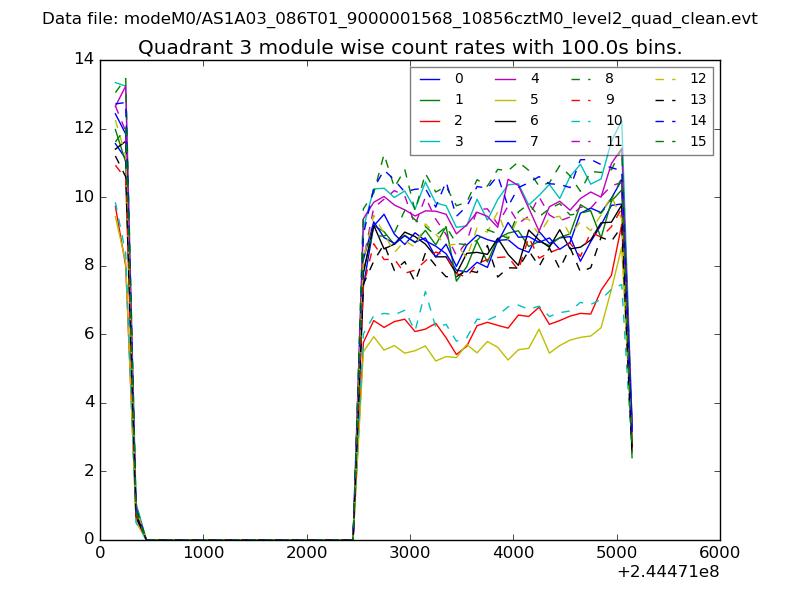
| Module-wise count rates for Quadrant C Data is divided into 100 sec bins |
 |
 |
| Module-wise count rates for Quadrant D Data is divided into 100 sec bins |
 |
 |
| Parameter | Plot |
|---|---|
| CZT HV Monitor | 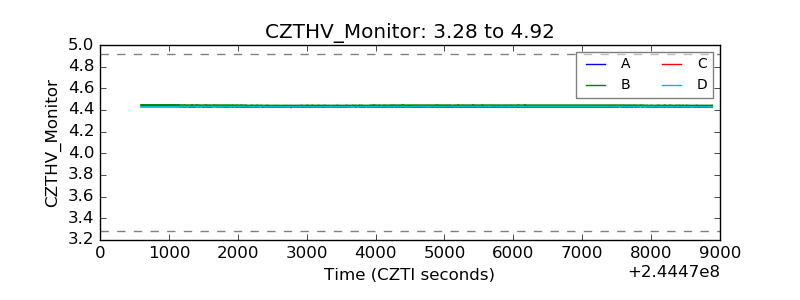 |
| D_VDD | 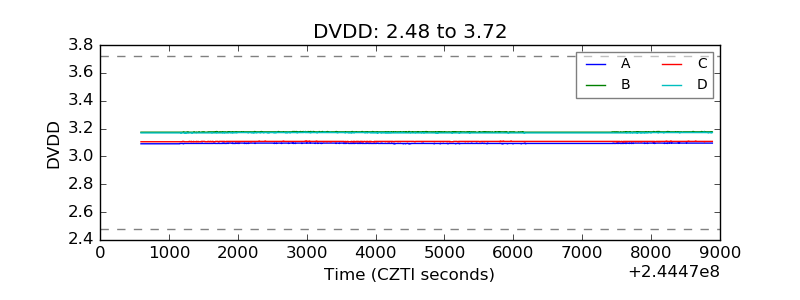 |
| Temperature 1 | 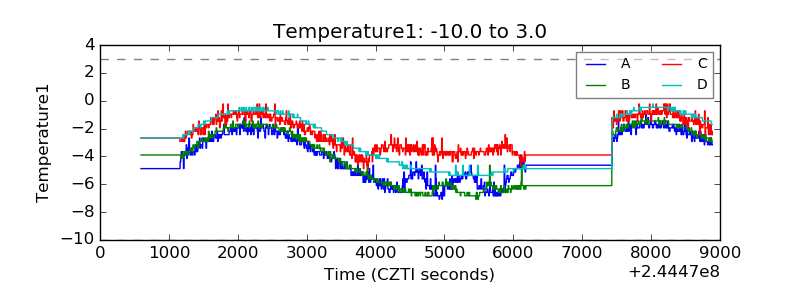 |
| Veto HV Monitor | 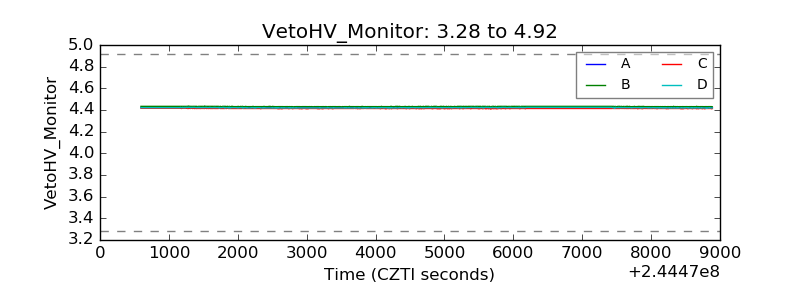 |
| Veto LLD | 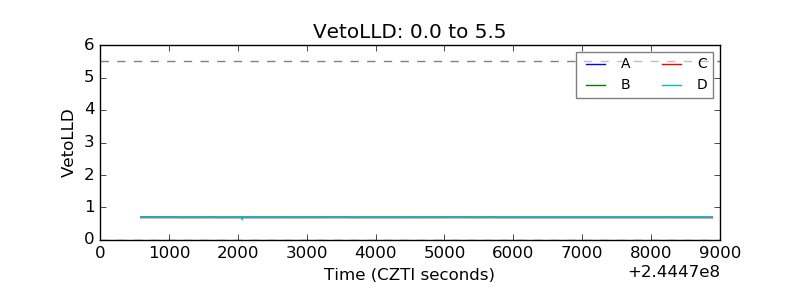 |
| Alpha Counter | 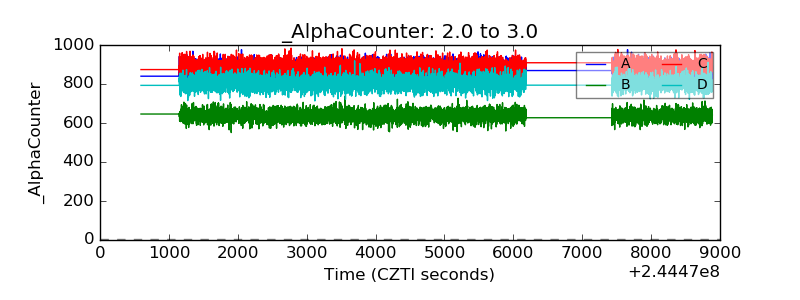 |
| _CPM_Rate | 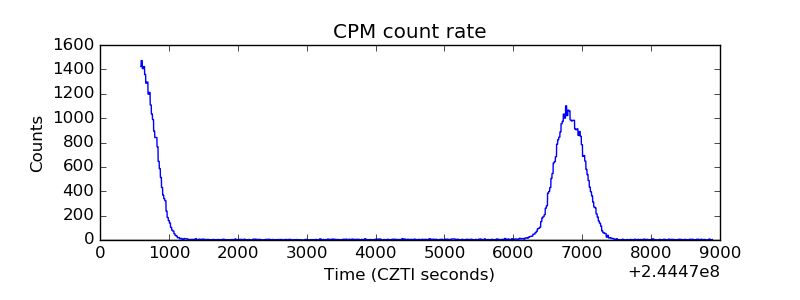 |
| CZT Counter |  |
| +2.5 Volts monitor |  |
| +5 Volts monitor |  |
| _ROLL_ROT | 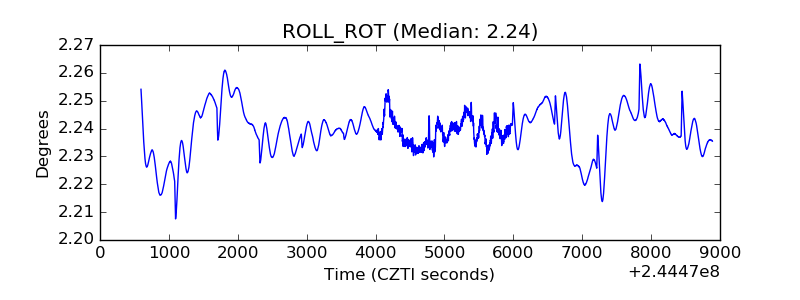 |
| _Roll_DEC | 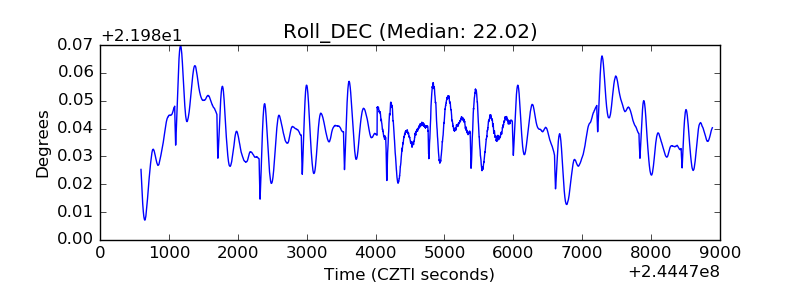 |
| _Roll_RA | 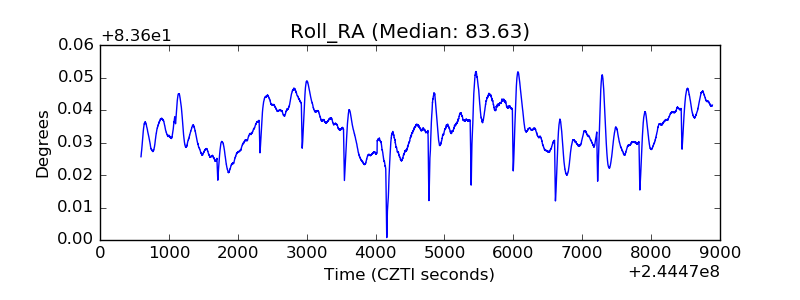 |
| Veto Counter | 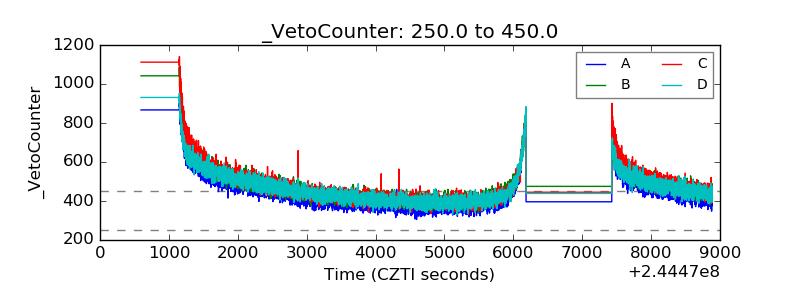 |