| Param | Original file | Final file |
|---|---|---|
| Filename | modeM0/AS1A03_086T01_9000001568_10858cztM0_level2.evt | modeM0/AS1A03_086T01_9000001568_10858cztM0_level2_quad_clean.evt |
| Size (bytes) | 255,744,000 | 29,116,800 |
| Size | 243.9 MB | 27.8 MB |
| Events in quadrant A | 2,657,997 | 164,562 |
| Events in quadrant B | 2,010,465 | 171,385 |
| Events in quadrant C | 1,351,299 | 174,826 |
| Events in quadrant D | 1,529,711 | 166,094 |
| Mode M9 | |||
|---|---|---|---|
| Quadrant | BADHDUFLAG | Total packets | Discarded packets |
| A | 0 | 5 | 0 |
| B | 0 | 5 | 0 |
| C | 0 | 5 | 0 |
| D | 0 | 6 | 0 |
| Mode SS | |||
|---|---|---|---|
| Quadrant | BADHDUFLAG | Total packets | Discarded packets |
| A | 0 | 58 | 0 |
| B | 0 | 58 | 0 |
| C | 0 | 58 | 0 |
| D | 0 | 58 | 0 |
| Mode M0 | |||
|---|---|---|---|
| Quadrant | BADHDUFLAG | Total packets | Discarded packets |
| A | 0 | 10051 | 1 |
| B | 0 | 7783 | 1 |
| C | 0 | 5829 | 1 |
| D | 0 | 6398 | 1 |
| Quadrant | Total seconds | Saturated seconds | Saturation percentage |
|---|---|---|---|
| A | 2856 | 327 | 11.449580% |
| B | 2856 | 165 | 5.777311% |
| C | 2856 | 7 | 0.245098% |
| D | 2856 | 30 | 1.050420% |
Noise dominated data is calculated using 1-second bins in cleaned event files. If a bin has >2000 counts, and if more than 50% of those come from <1% of pixels, then it is considered to be noise-dominated and hence unusable.
| Quadrant | # 1 sec bins | Bins with >0 counts | Bins with >2000 counts | High rate bins dominated by noise | Noise dominated (total time) | Noise dominated (detector-on time) | Marked lightcurve |
|---|---|---|---|---|---|---|---|
| A | 2856 | 2856 | 181 | 181 | 6.34% | 6.34% | 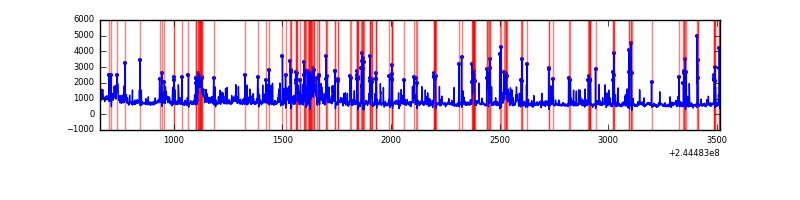 |
| B | 2856 | 2856 | 98 | 98 | 3.43% | 3.43% | 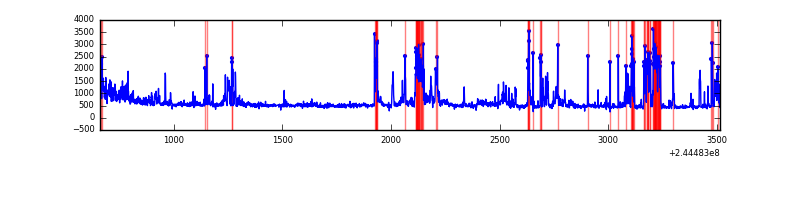 |
| C | 2856 | 2856 | 0 | 0 | 0.00% | 0.00% | 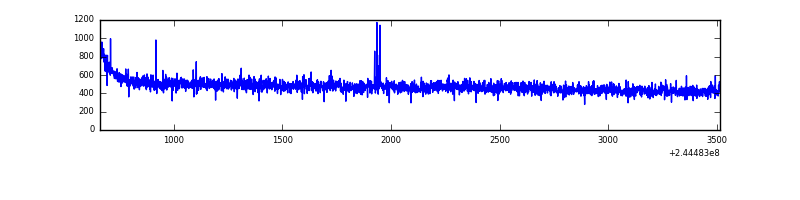 |
| D | 2856 | 2856 | 19 | 19 | 0.67% | 0.67% | 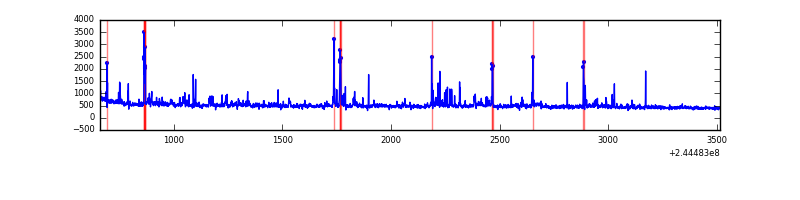 |
Top three noisy pixels from each quadrant. If the there are fewer than three noisy pixels in the level2.evt file, extra rows are filled as -1
| Pixel properties | Quadrant properties | ||||||
|---|---|---|---|---|---|---|---|
| Quadrant | DetID | PixID | Counts | Sigma | Mean | Median | Sigma |
| A | 8 | 5 | 1321250 | 18870.53 | 336 | 331 | 70.0 |
| A | 15 | 223 | 9962 | 137.59 | 336 | 331 | 70.0 |
| A | 11 | 29 | 6881 | 93.57 | 336 | 331 | 70.0 |
| B | 4 | 239 | 590899 | 8670.46 | 349 | 341 | 68.1 |
| B | 0 | 219 | 18577 | 267.74 | 349 | 341 | 68.1 |
| B | 0 | 231 | 11679 | 166.46 | 349 | 341 | 68.1 |
| C | 14 | 234 | 5484 | 63.63 | 345 | 348 | 80.7 |
| C | 13 | 61 | 2533 | 27.07 | 345 | 348 | 80.7 |
| C | 7 | 159 | 901 | 6.85 | 345 | 348 | 80.7 |
| D | 1 | 52 | 80090 | 934.79 | 343 | 333 | 85.3 |
| D | 7 | 71 | 53345 | 621.32 | 343 | 333 | 85.3 |
| D | 13 | 104 | 46008 | 535.33 | 343 | 333 | 85.3 |
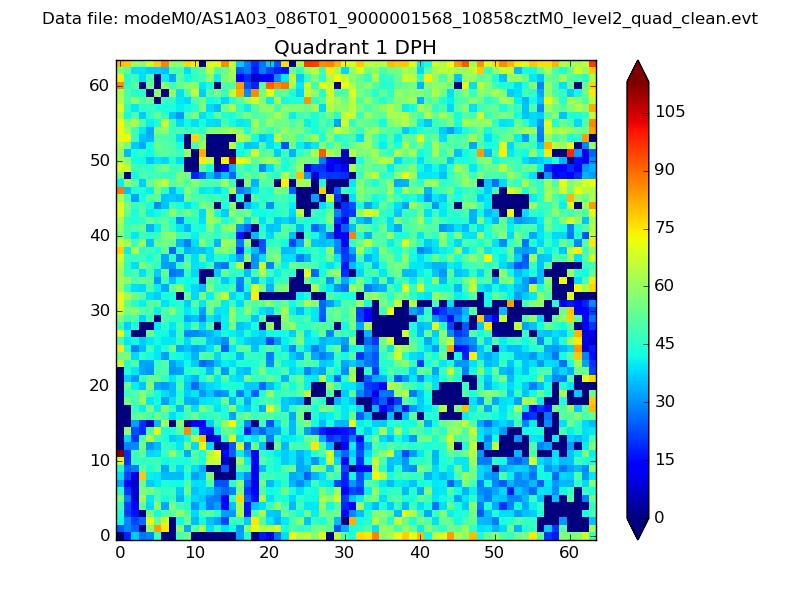
Histogram calculated using DETX and DETY for each event in the final _common_clean file
| Quadrant A |  |
 |
Quadrant B |
|---|---|---|---|
| Quadrant D | 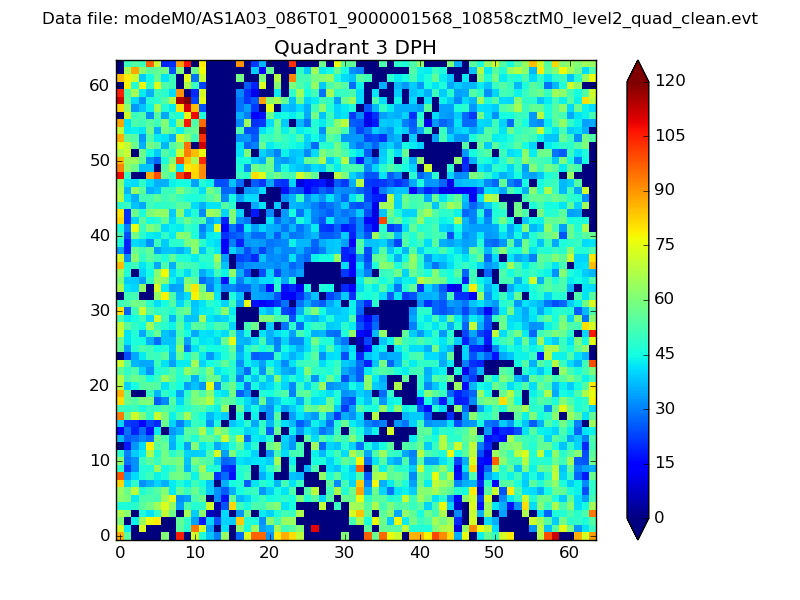 |
 |
Quadrant C |
| Plot type | Count rate plots | Images |
|---|---|---|
| Comparison with Poisson distribution Blue bars denote a histogram of data divided into 1 sec bins. Red curve is a Poisson curve with rate = median count rate of data. |
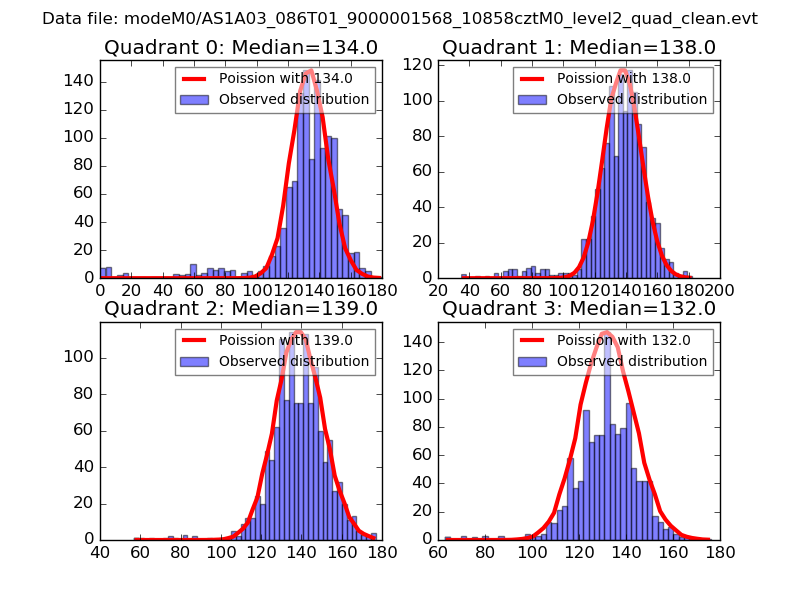 |
 |
| Quadrant-wise count rates Data is divided into 100 sec bins |
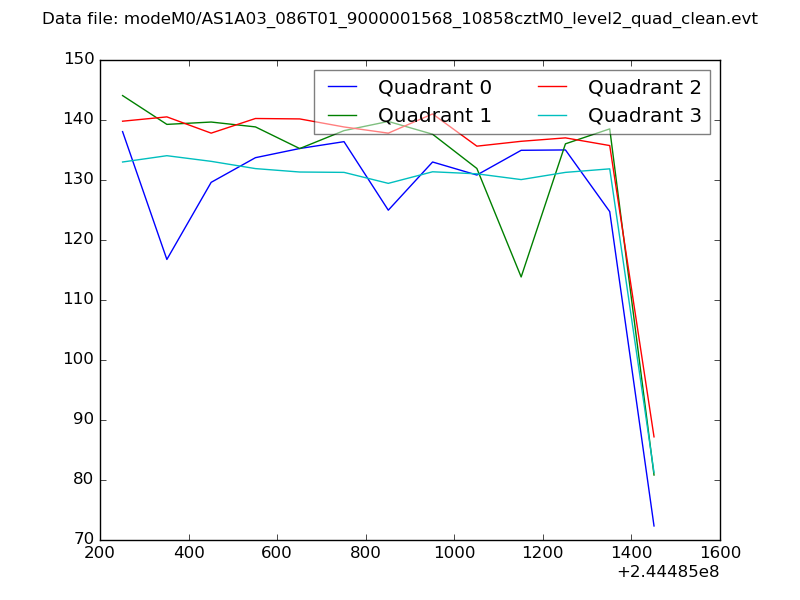 |
|
| Module-wise count rates for Quadrant A Data is divided into 100 sec bins |
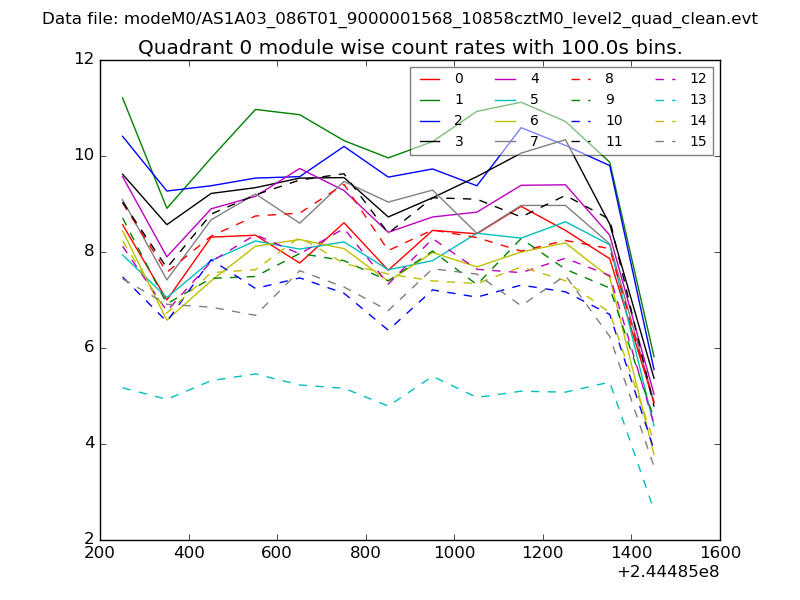 |
 |
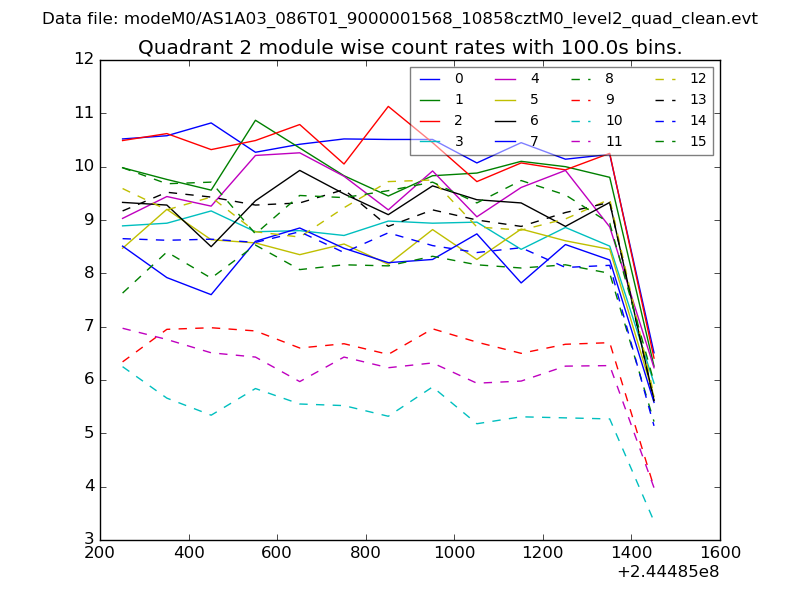
| Module-wise count rates for Quadrant B Data is divided into 100 sec bins |
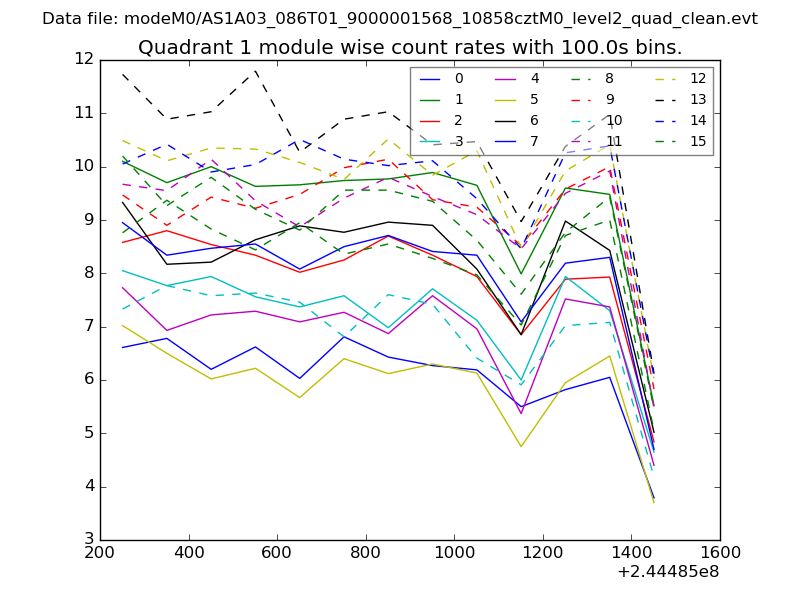 |
 |
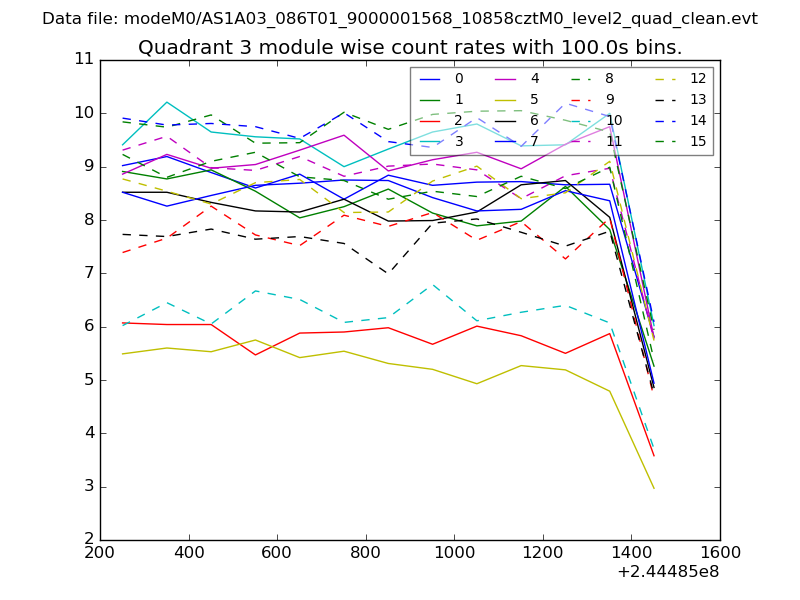
| Module-wise count rates for Quadrant C Data is divided into 100 sec bins |
 |
 |
| Module-wise count rates for Quadrant D Data is divided into 100 sec bins |
 |
 |
| Parameter | Plot |
|---|---|
| CZT HV Monitor | 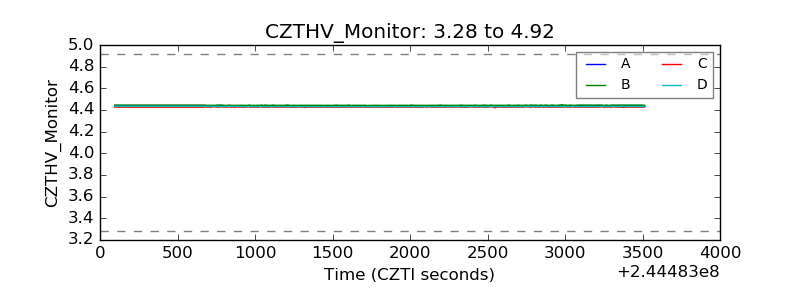 |
| D_VDD | 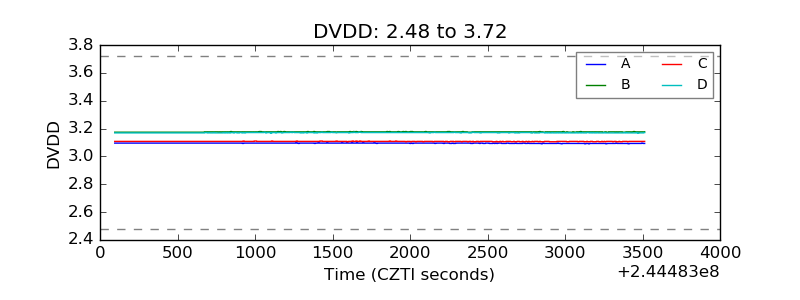 |
| Temperature 1 | 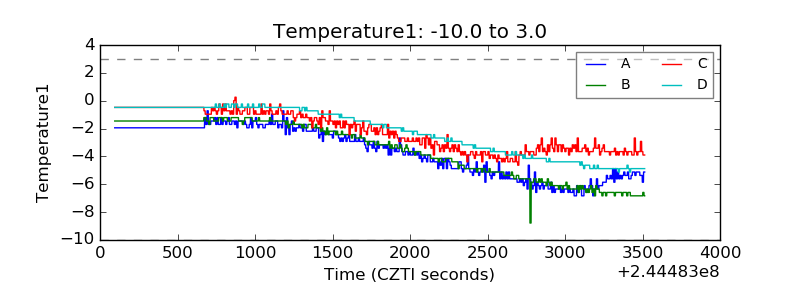 |
| Veto HV Monitor | 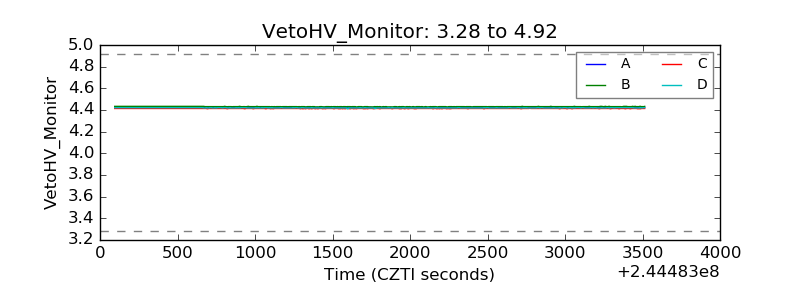 |
| Veto LLD | 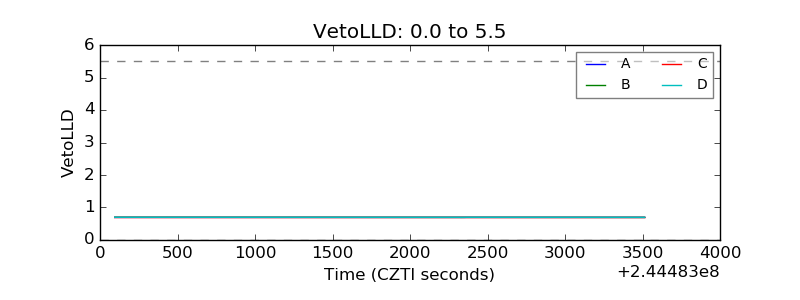 |
| Alpha Counter | 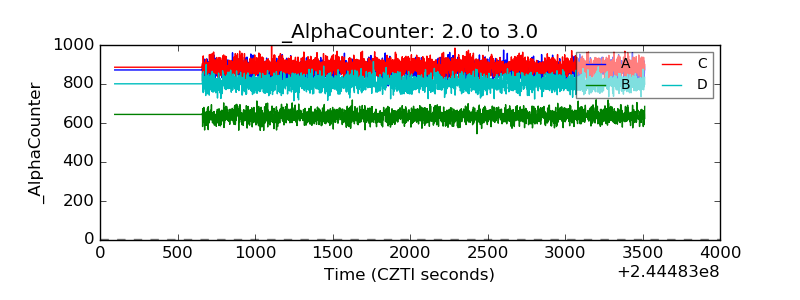 |
| _CPM_Rate | 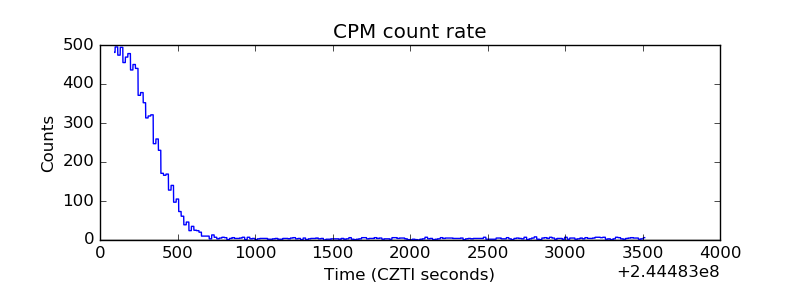 |
| CZT Counter | 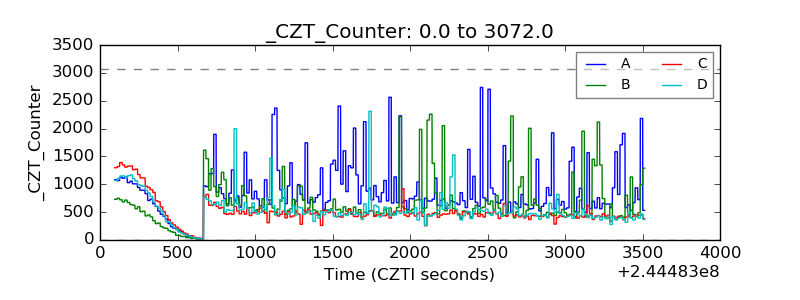 |
| +2.5 Volts monitor |  |
| +5 Volts monitor |  |
| _ROLL_ROT | 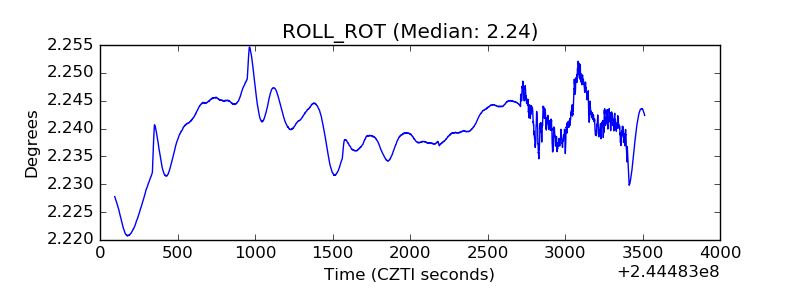 |
| _Roll_DEC | 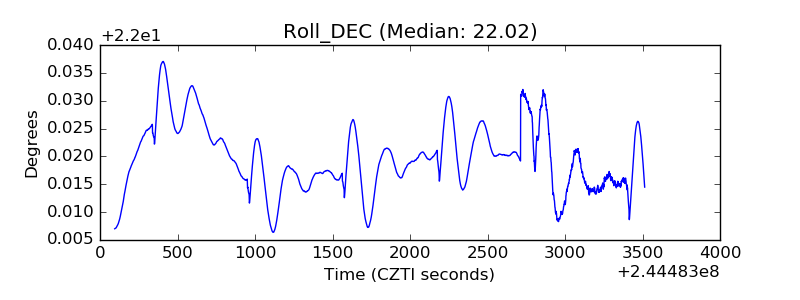 |
| _Roll_RA | 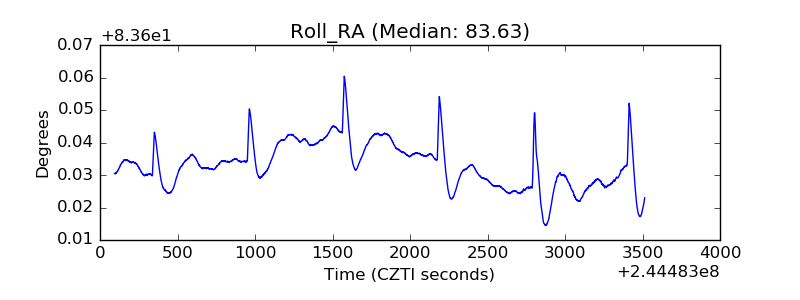 |
| Veto Counter | 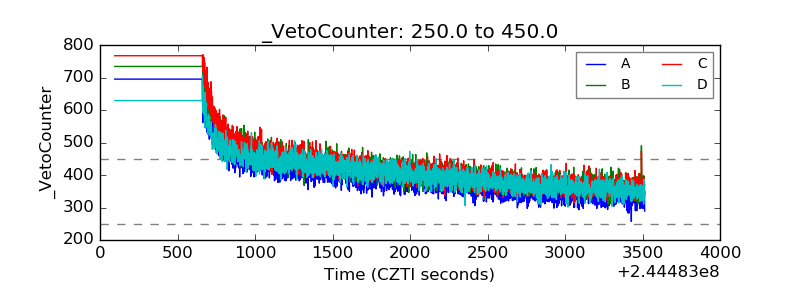 |