| Param | Original file | Final file |
|---|---|---|
| Filename | modeM0/AS1G07_003T02_9000001564cztM0_level2.fits | modeM0/AS1G07_003T02_9000001564cztM0_level2_quad_clean.evt |
| Size (bytes) | 274,596,480 | 272,476,800 |
| Size | 261.9 MB | 259.9 MB |
| Events in quadrant A | 1,573,700 | 1,514,688 |
| Events in quadrant B | 1,583,978 | 1,602,693 |
| Events in quadrant C | 1,669,520 | 1,632,910 |
| Events in quadrant D | 1,430,350 | 1,444,760 |
| Mode SS | |||
|---|---|---|---|
| Quadrant | BADHDUFLAG | Total packets | Discarded packets |
| A | 0 | 606 | 0 |
| B | 0 | 606 | 0 |
| C | 0 | 606 | 0 |
| D | 0 | 606 | 0 |
| Mode M9 | |||
|---|---|---|---|
| Quadrant | BADHDUFLAG | Total packets | Discarded packets |
| A | 0 | 49 | 0 |
| B | 0 | 49 | 0 |
| C | 0 | 49 | 0 |
| D | 0 | 49 | 0 |
| Mode M0 | |||
|---|---|---|---|
| Quadrant | BADHDUFLAG | Total packets | Discarded packets |
| A | 0 | 97659 | 0 |
| B | 0 | 84748 | 0 |
| C | 0 | 61629 | 0 |
| D | 0 | 76688 | 0 |
| Quadrant | Total seconds | Saturated seconds | Saturation percentage |
|---|---|---|---|
| A | 29918 | 3659 | 12.230096% |
| B | 29920 | 2342 | 7.827540% |
| C | 29920 | 238 | 0.795455% |
| D | 29920 | 1132 | 3.783422% |
Noise dominated data is calculated using 1-second bins in cleaned event files. If a bin has >2000 counts, and if more than 50% of those come from <1% of pixels, then it is considered to be noise-dominated and hence unusable.
| Quadrant | # 1 sec bins | Bins with >0 counts | Bins with >2000 counts | High rate bins dominated by noise | Noise dominated (total time) | Noise dominated (detector-on time) | Marked lightcurve |
|---|---|---|---|---|---|---|---|
| A | 34676 | 29843 | 0 | 0 | 0.00% | 0.00% |  |
| B | 34676 | 29916 | 0 | 0 | 0.00% | 0.00% |  |
| C | 34676 | 29919 | 0 | 0 | 0.00% | 0.00% |  |
| D | 34676 | 29897 | 0 | 0 | 0.00% | 0.00% |  |
Top three noisy pixels from each quadrant. If the there are fewer than three noisy pixels in the level2.evt file, extra rows are filled as -1
| Pixel properties | Quadrant properties | ||||||
|---|---|---|---|---|---|---|---|
| Quadrant | DetID | PixID | Counts | Sigma | Mean | Median | Sigma |
| A | 0 | 29 | 1484 | 10.66 | 408 | 382 | 103.4 |
| A | 7 | 110 | 1251 | 8.4 | 408 | 382 | 103.4 |
| A | 9 | 19 | 1157 | 7.49 | 408 | 382 | 103.4 |
| B | 2 | 9 | 1434 | 12.32 | 417 | 398 | 84.1 |
| B | 12 | 226 | 1088 | 8.2 | 417 | 398 | 84.1 |
| B | 14 | 254 | 1065 | 7.93 | 417 | 398 | 84.1 |
| C | 1 | 81 | 1267 | 7.37 | 440 | 409 | 116.3 |
| C | 1 | 80 | 1243 | 7.17 | 440 | 409 | 116.3 |
| C | 12 | 241 | 1193 | 6.74 | 440 | 409 | 116.3 |
| D | 3 | 14 | 1063 | 6.27 | 407 | 371 | 110.4 |
| D | 6 | 231 | 1031 | 5.98 | 407 | 371 | 110.4 |
| D | 7 | 3 | 1027 | 5.94 | 407 | 371 | 110.4 |
Histogram calculated using DETX and DETY for each event in the final _common_clean file
| Quadrant A | 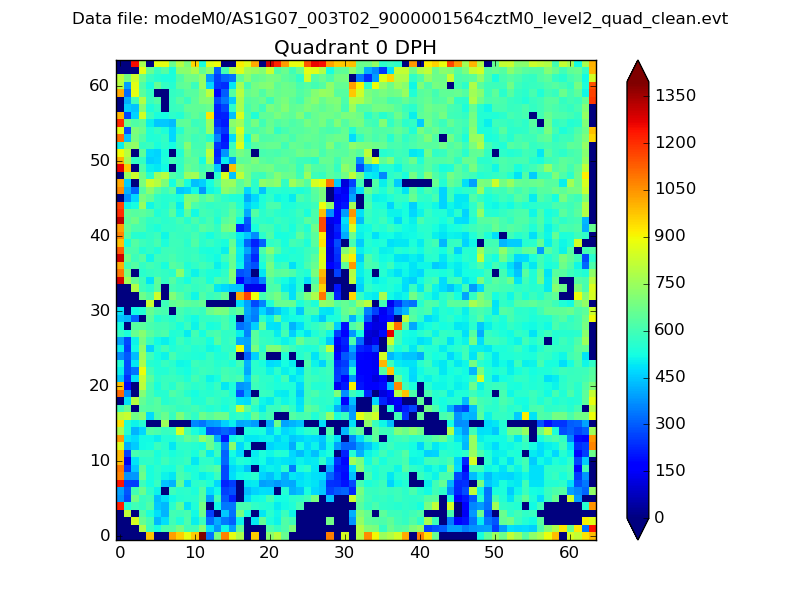 |
 |
Quadrant B |
|---|---|---|---|
| Quadrant D |  |
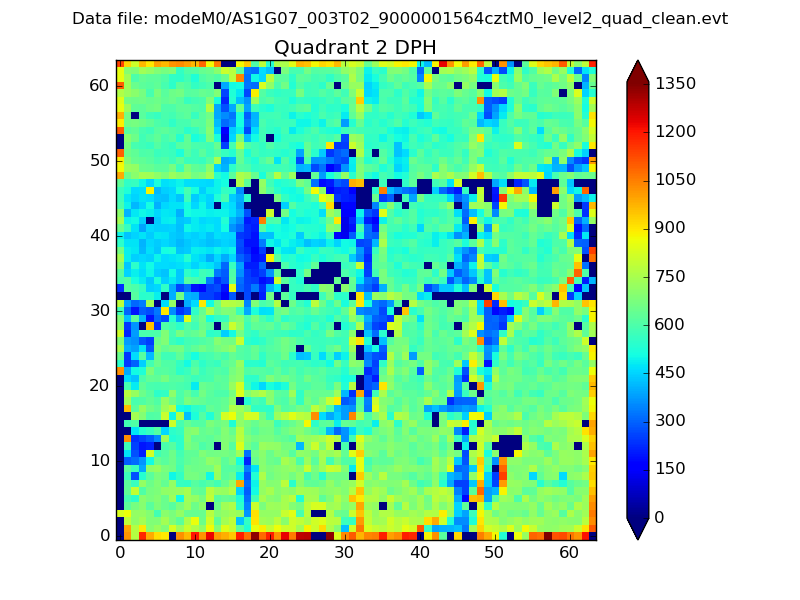 |
Quadrant C |
| Plot type | Count rate plots | Images |
|---|---|---|
| Comparison with Poisson distribution Blue bars denote a histogram of data divided into 1 sec bins. Red curve is a Poisson curve with rate = median count rate of data. |
 |
 |
| Quadrant-wise count rates Data is divided into 100 sec bins |
 |
|
| Module-wise count rates for Quadrant A Data is divided into 100 sec bins |
 |
 |
| Module-wise count rates for Quadrant B Data is divided into 100 sec bins |
 |
 |
| Module-wise count rates for Quadrant C Data is divided into 100 sec bins |
 |
 |
| Module-wise count rates for Quadrant D Data is divided into 100 sec bins |
 |
 |
| Parameter | Plot |
|---|---|
| CZT HV Monitor |  |
| D_VDD |  |
| Temperature 1 |  |
| Veto HV Monitor |  |
| Veto LLD |  |
| Alpha Counter |  |
| _CPM_Rate |  |
| CZT Counter |  |
| +2.5 Volts monitor |  |
| +5 Volts monitor |  |
| _ROLL_ROT |  |
| _Roll_DEC |  |
| _Roll_RA |  |
| Veto Counter |  |