| Param | Original file | Final file |
|---|---|---|
| Filename | modeM0/AS1G07_003T02_9000001564_10806cztM0_level2.evt | modeM0/AS1G07_003T02_9000001564_10806cztM0_level2_quad_clean.evt |
| Size (bytes) | 1,016,971,200 | 124,136,640 |
| Size | 969.9 MB | 118.4 MB |
| Events in quadrant A | 9,733,330 | 711,679 |
| Events in quadrant B | 8,852,823 | 730,518 |
| Events in quadrant C | 5,328,214 | 753,539 |
| Events in quadrant D | 6,067,099 | 726,277 |
| Mode SS | |||
|---|---|---|---|
| Quadrant | BADHDUFLAG | Total packets | Discarded packets |
| A | 0 | 244 | 0 |
| B | 0 | 244 | 0 |
| C | 0 | 244 | 0 |
| D | 0 | 244 | 0 |
| Mode M9 | |||
|---|---|---|---|
| Quadrant | BADHDUFLAG | Total packets | Discarded packets |
| A | 0 | 16 | 0 |
| B | 0 | 16 | 0 |
| C | 0 | 16 | 0 |
| D | 0 | 16 | 0 |
| Mode M0 | |||
|---|---|---|---|
| Quadrant | BADHDUFLAG | Total packets | Discarded packets |
| A | 0 | 37046 | 5 |
| B | 0 | 34324 | 2 |
| C | 0 | 24526 | 4 |
| D | 0 | 26466 | 4 |
| Quadrant | Total seconds | Saturated seconds | Saturation percentage |
|---|---|---|---|
| A | 12107 | 1047 | 8.647890% |
| B | 12108 | 941 | 7.771721% |
| C | 12107 | 66 | 0.545139% |
| D | 12107 | 99 | 0.817709% |
Noise dominated data is calculated using 1-second bins in cleaned event files. If a bin has >2000 counts, and if more than 50% of those come from <1% of pixels, then it is considered to be noise-dominated and hence unusable.
| Quadrant | # 1 sec bins | Bins with >0 counts | Bins with >2000 counts | High rate bins dominated by noise | Noise dominated (total time) | Noise dominated (detector-on time) | Marked lightcurve |
|---|---|---|---|---|---|---|---|
| A | 13633 | 12110 | 760 | 760 | 5.57% | 6.28% | 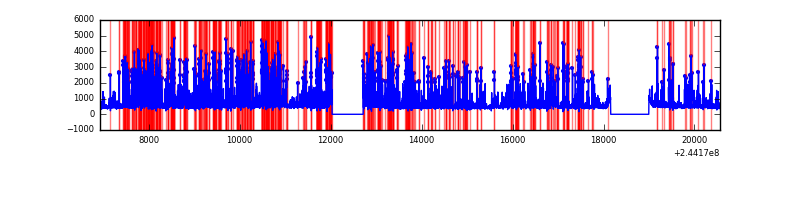 |
| B | 13633 | 12109 | 542 | 542 | 3.98% | 4.48% | 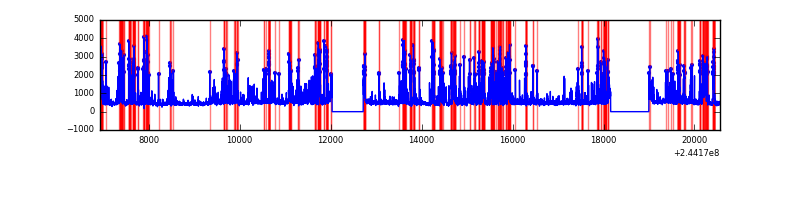 |
| C | 13633 | 12110 | 0 | 0 | 0.00% | 0.00% | 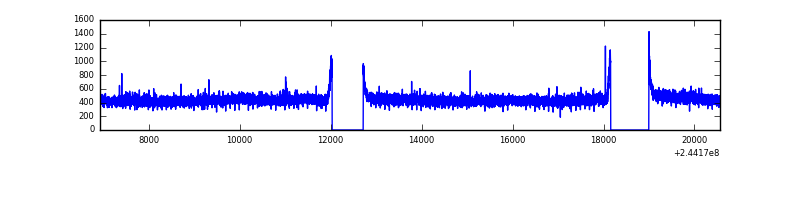 |
| D | 13633 | 12110 | 34 | 34 | 0.25% | 0.28% | 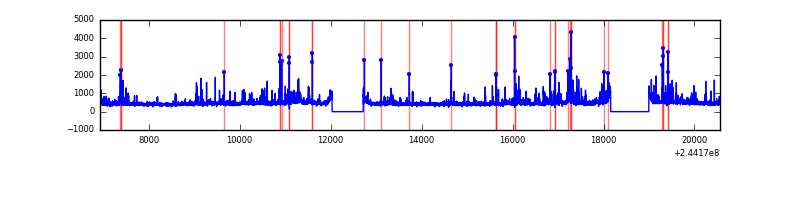 |
Top three noisy pixels from each quadrant. If the there are fewer than three noisy pixels in the level2.evt file, extra rows are filled as -1
| Pixel properties | Quadrant properties | ||||||
|---|---|---|---|---|---|---|---|
| Quadrant | DetID | PixID | Counts | Sigma | Mean | Median | Sigma |
| A | 8 | 5 | 4270776 | 15709.73 | 1338 | 1306 | 271.8 |
| A | 4 | 2 | 283303 | 1037.62 | 1338 | 1306 | 271.8 |
| A | 8 | 15 | 12815 | 42.35 | 1338 | 1306 | 271.8 |
| B | 4 | 239 | 3177876 | 12319.47 | 1357 | 1323 | 257.8 |
| B | 15 | 204 | 254129 | 980.44 | 1357 | 1323 | 257.8 |
| B | 0 | 214 | 66473 | 252.67 | 1357 | 1323 | 257.8 |
| C | 8 | 128 | 13203 | 37.73 | 1357 | 1365 | 313.8 |
| C | 13 | 61 | 10032 | 27.62 | 1357 | 1365 | 313.8 |
| C | 8 | 222 | 8689 | 23.34 | 1357 | 1365 | 313.8 |
| D | 13 | 138 | 325373 | 1002.29 | 1345 | 1306 | 323.3 |
| D | 8 | 195 | 200383 | 615.71 | 1345 | 1306 | 323.3 |
| D | 1 | 52 | 102253 | 312.21 | 1345 | 1306 | 323.3 |
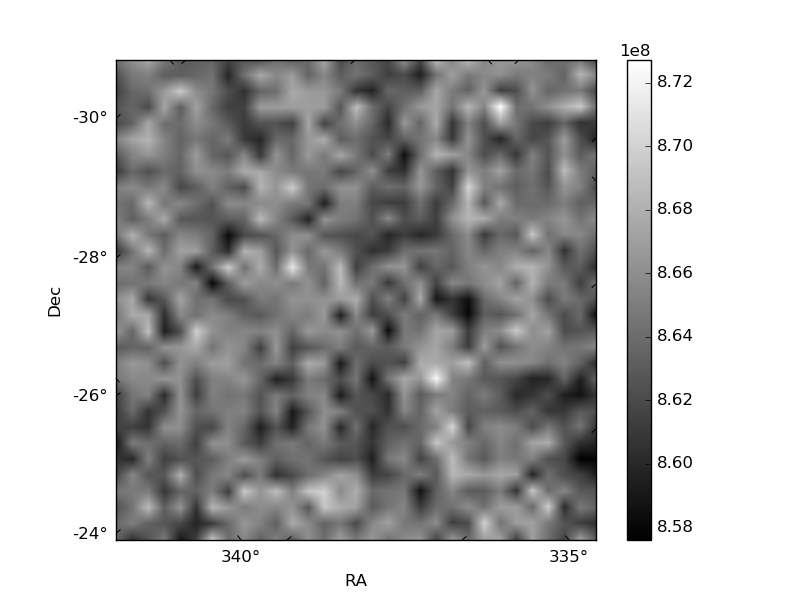
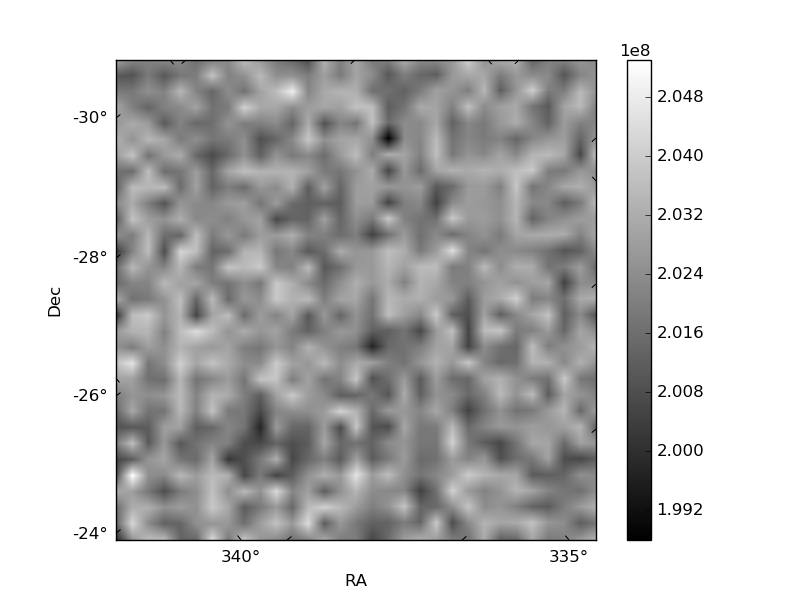
Histogram calculated using DETX and DETY for each event in the final _common_clean file
| Quadrant A | 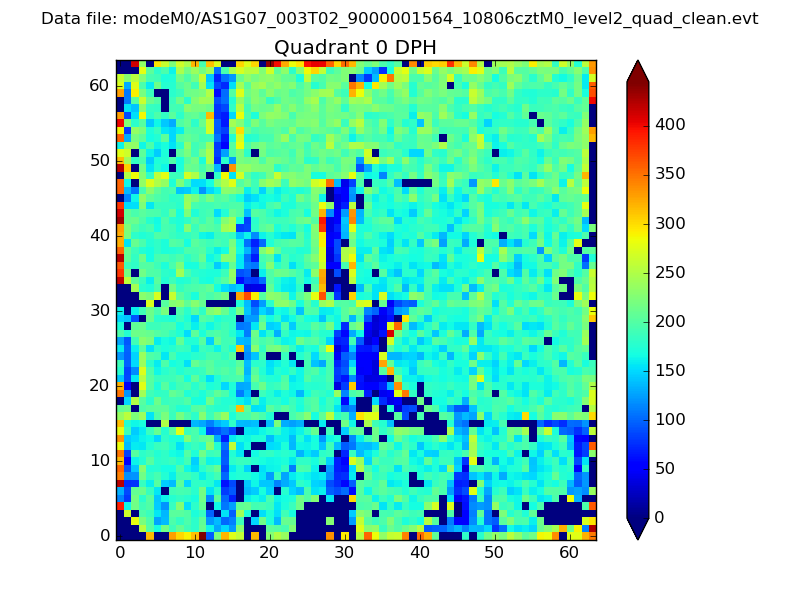 |
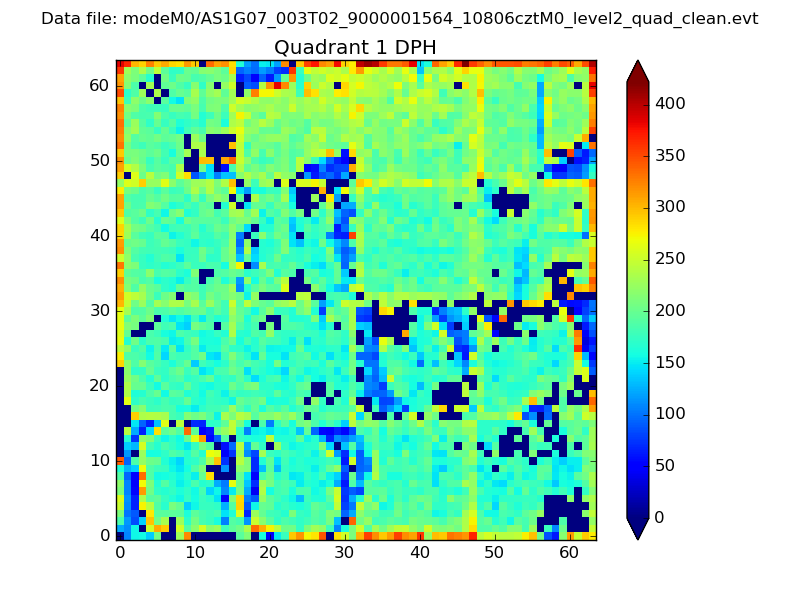 |
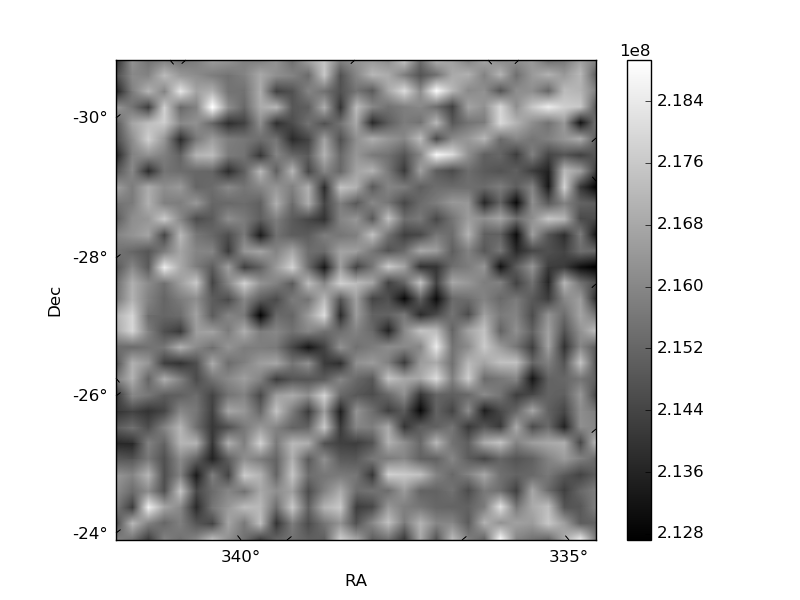
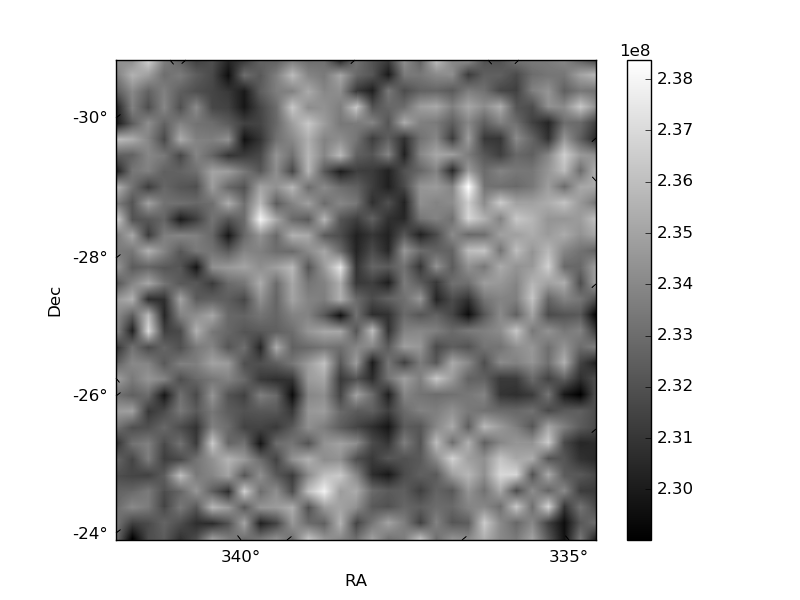
Quadrant B |
|---|---|---|---|
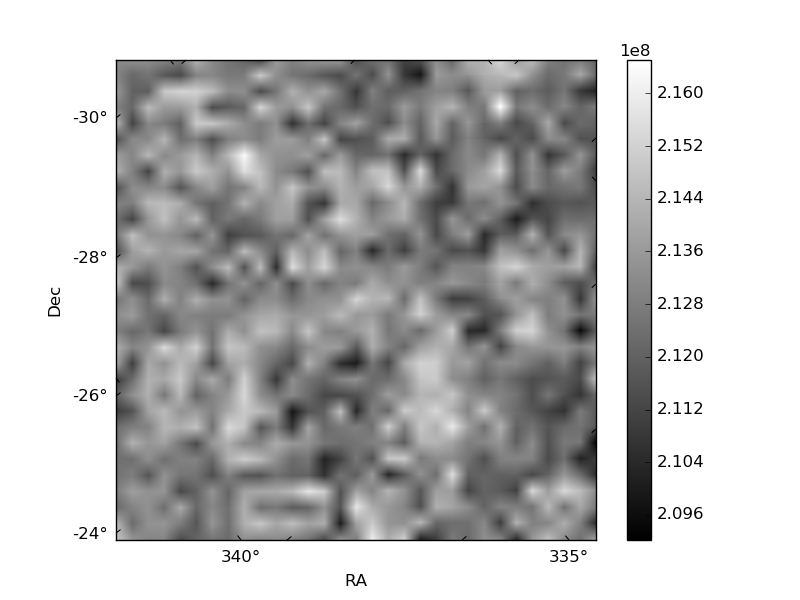
| Quadrant D | 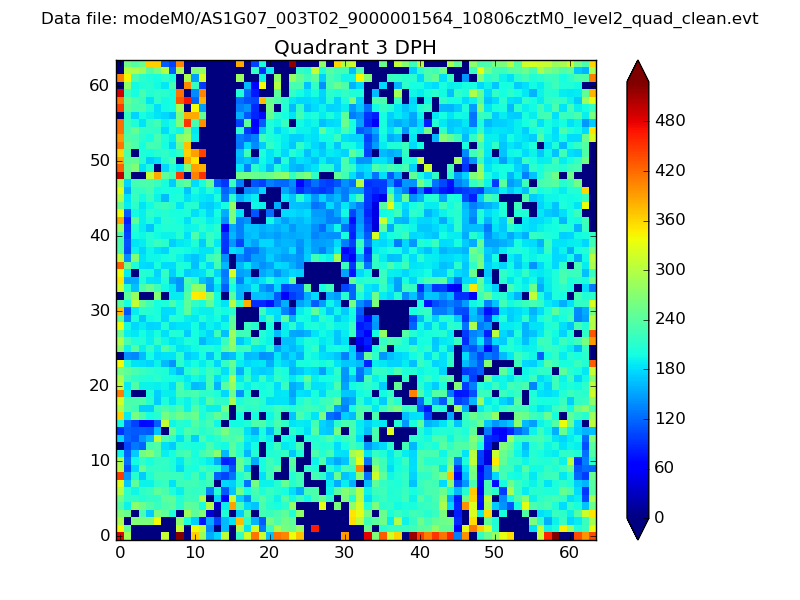 |
 |
Quadrant C |
| Plot type | Count rate plots | Images |
|---|---|---|
| Comparison with Poisson distribution Blue bars denote a histogram of data divided into 1 sec bins. Red curve is a Poisson curve with rate = median count rate of data. |
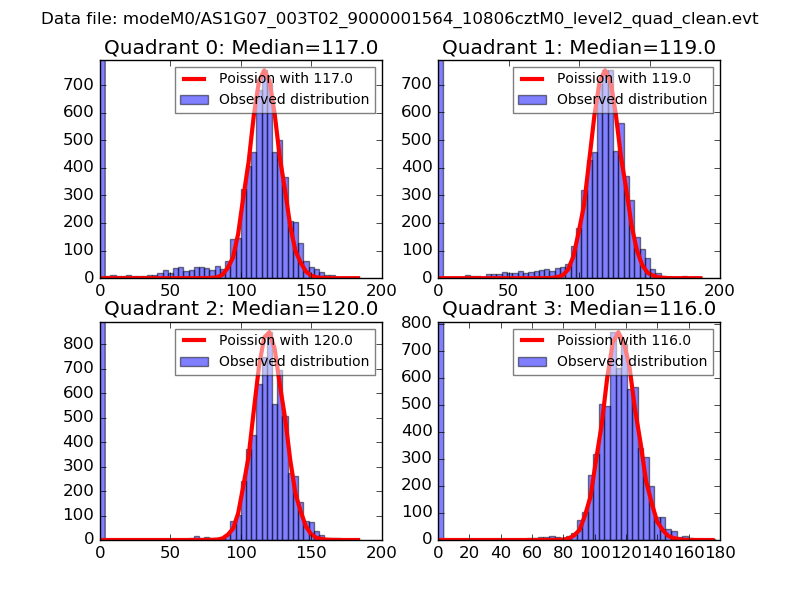 |
 |
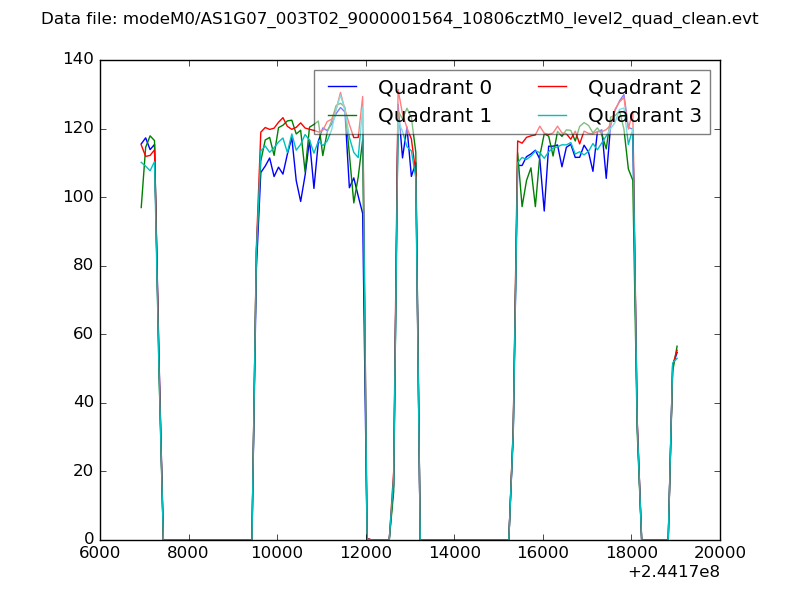
| Quadrant-wise count rates Data is divided into 100 sec bins |
 |
|
| Module-wise count rates for Quadrant A Data is divided into 100 sec bins |
 |
 |
| Module-wise count rates for Quadrant B Data is divided into 100 sec bins |
 |
 |
| Module-wise count rates for Quadrant C Data is divided into 100 sec bins |
 |
 |
| Module-wise count rates for Quadrant D Data is divided into 100 sec bins |
 |
 |
| Parameter | Plot |
|---|---|
| CZT HV Monitor |  |
| D_VDD | 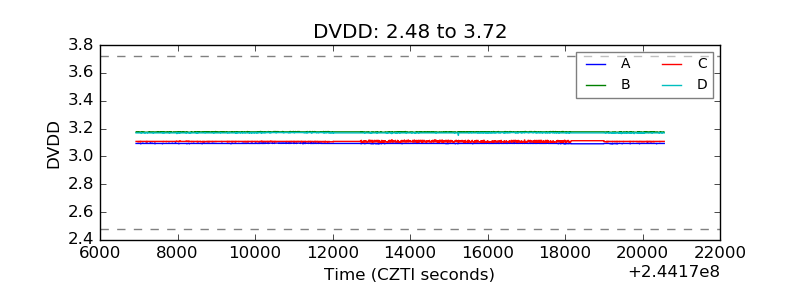 |
| Temperature 1 | 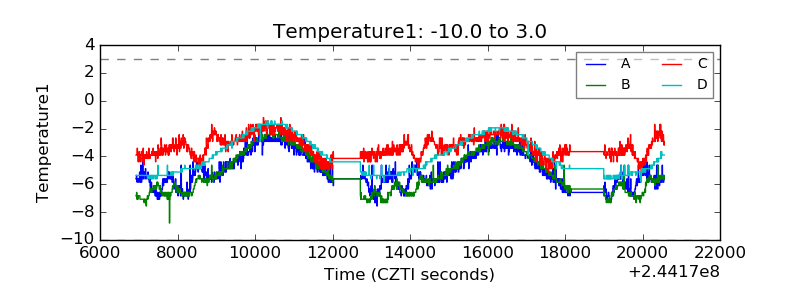 |
| Veto HV Monitor | 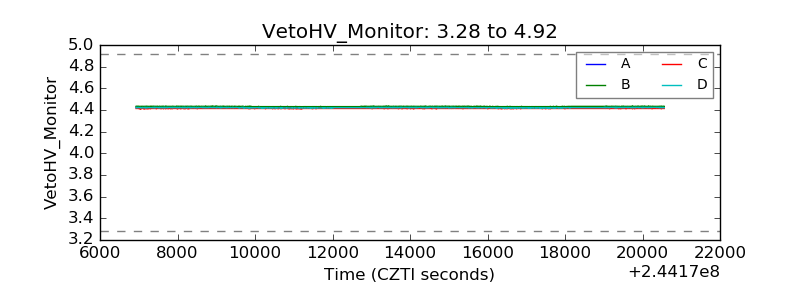 |
| Veto LLD | 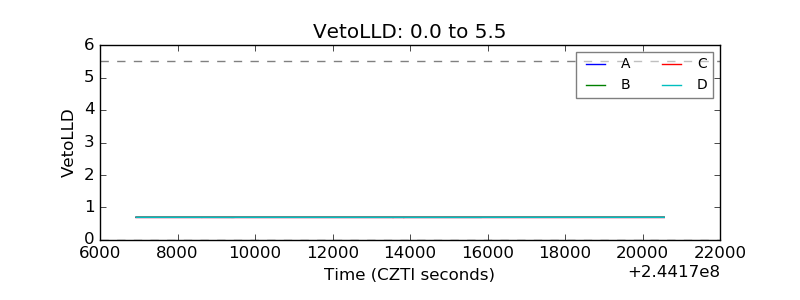 |
| Alpha Counter | 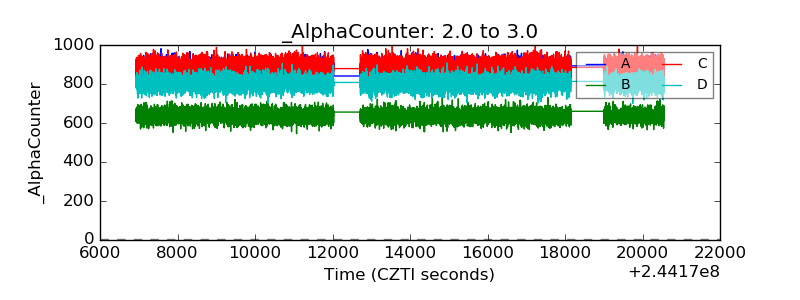 |
| _CPM_Rate | 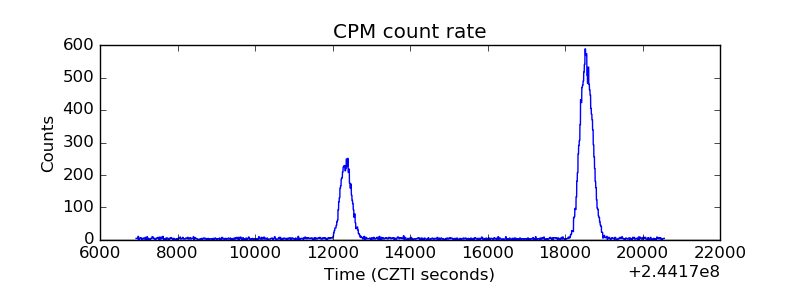 |
| CZT Counter | 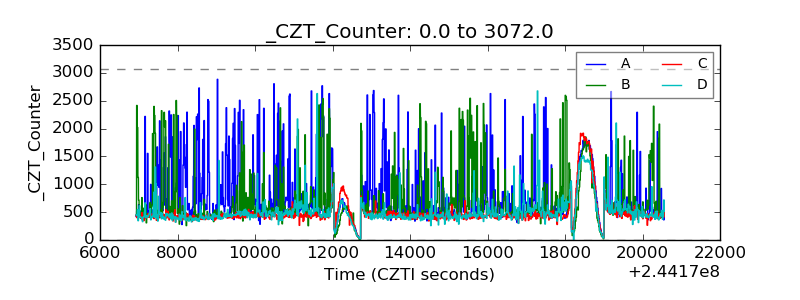 |
| +2.5 Volts monitor |  |
| +5 Volts monitor |  |
| _ROLL_ROT |  |
| _Roll_DEC | 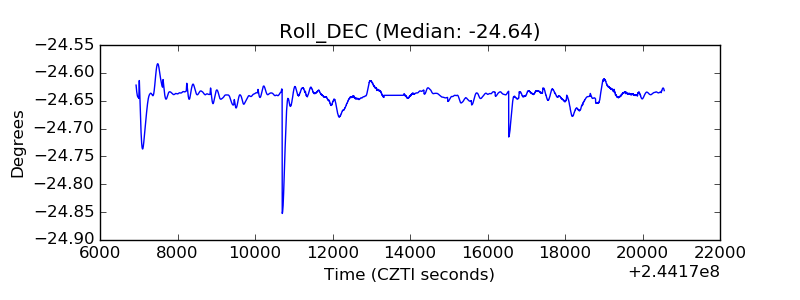 |
| _Roll_RA | 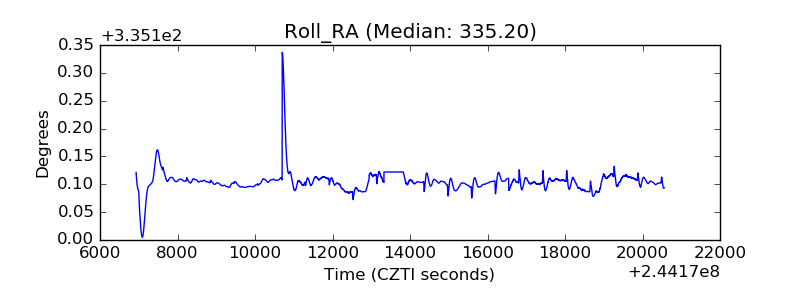 |
| Veto Counter |  |