| Param | Original file | Final file |
|---|---|---|
| Filename | modeM0/AS1G07_003T02_9000001564_10807cztM0_level2.evt | modeM0/AS1G07_003T02_9000001564_10807cztM0_level2_quad_clean.evt |
| Size (bytes) | 568,195,200 | 62,827,200 |
| Size | 541.9 MB | 59.9 MB |
| Events in quadrant A | 5,013,352 | 360,769 |
| Events in quadrant B | 4,790,953 | 357,406 |
| Events in quadrant C | 2,973,055 | 371,201 |
| Events in quadrant D | 3,984,918 | 354,309 |
| Mode SS | |||
|---|---|---|---|
| Quadrant | BADHDUFLAG | Total packets | Discarded packets |
| A | 0 | 132 | 0 |
| B | 0 | 132 | 0 |
| C | 0 | 132 | 0 |
| D | 0 | 132 | 0 |
| Mode M9 | |||
|---|---|---|---|
| Quadrant | BADHDUFLAG | Total packets | Discarded packets |
| A | 0 | 10 | 0 |
| B | 0 | 10 | 0 |
| C | 0 | 10 | 0 |
| D | 0 | 10 | 0 |
| Mode M0 | |||
|---|---|---|---|
| Quadrant | BADHDUFLAG | Total packets | Discarded packets |
| A | 0 | 19217 | 4 |
| B | 0 | 18520 | 1 |
| C | 0 | 13404 | 1 |
| D | 0 | 16156 | 1 |
| Quadrant | Total seconds | Saturated seconds | Saturation percentage |
|---|---|---|---|
| A | 6577 | 591 | 8.985860% |
| B | 6578 | 461 | 7.008209% |
| C | 6578 | 31 | 0.471268% |
| D | 6578 | 176 | 2.675585% |
Noise dominated data is calculated using 1-second bins in cleaned event files. If a bin has >2000 counts, and if more than 50% of those come from <1% of pixels, then it is considered to be noise-dominated and hence unusable.
| Quadrant | # 1 sec bins | Bins with >0 counts | Bins with >2000 counts | High rate bins dominated by noise | Noise dominated (total time) | Noise dominated (detector-on time) | Marked lightcurve |
|---|---|---|---|---|---|---|---|
| A | 7558 | 6578 | 429 | 429 | 5.68% | 6.52% | 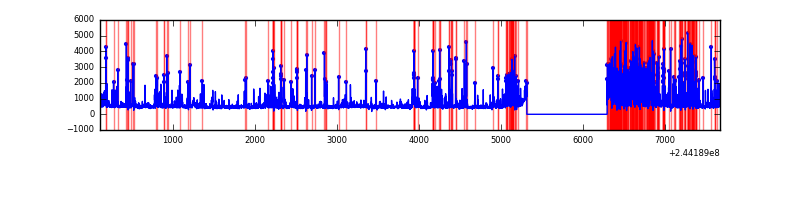 |
| B | 7558 | 6579 | 260 | 260 | 3.44% | 3.95% | 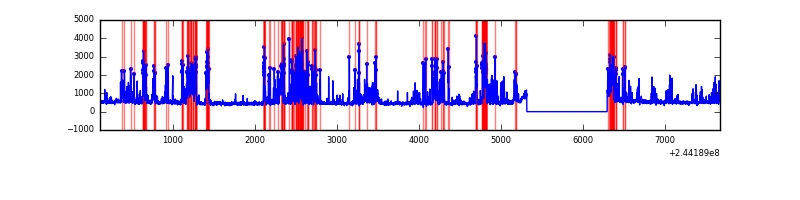 |
| C | 7558 | 6579 | 0 | 0 | 0.00% | 0.00% | 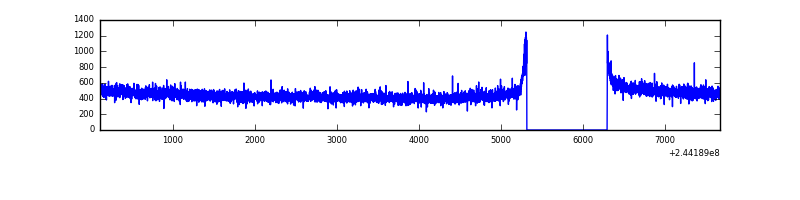 |
| D | 7558 | 6579 | 127 | 127 | 1.68% | 1.93% | 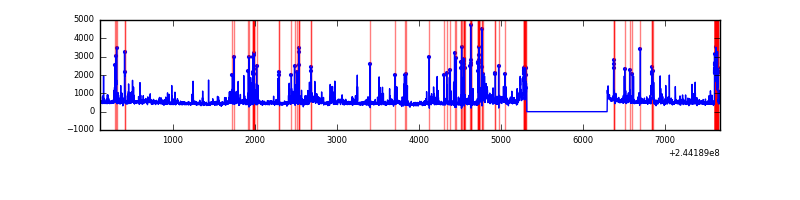 |
Top three noisy pixels from each quadrant. If the there are fewer than three noisy pixels in the level2.evt file, extra rows are filled as -1
| Pixel properties | Quadrant properties | ||||||
|---|---|---|---|---|---|---|---|
| Quadrant | DetID | PixID | Counts | Sigma | Mean | Median | Sigma |
| A | 8 | 5 | 2119095 | 14040.53 | 741 | 724 | 150.9 |
| A | 4 | 2 | 24588 | 158.17 | 741 | 724 | 150.9 |
| A | 8 | 15 | 9219 | 56.3 | 741 | 724 | 150.9 |
| B | 4 | 239 | 1651209 | 11224.66 | 766 | 747 | 147.0 |
| B | 15 | 204 | 109684 | 740.87 | 766 | 747 | 147.0 |
| B | 0 | 85 | 30825 | 204.56 | 766 | 747 | 147.0 |
| C | 13 | 61 | 5605 | 27.36 | 761 | 765 | 176.9 |
| C | 8 | 222 | 4099 | 18.85 | 761 | 765 | 176.9 |
| C | 14 | 234 | 1830 | 6.02 | 761 | 765 | 176.9 |
| D | 1 | 52 | 307399 | 1721.73 | 747 | 728 | 178.1 |
| D | 13 | 138 | 223964 | 1253.31 | 747 | 728 | 178.1 |
| D | 8 | 195 | 133501 | 745.42 | 747 | 728 | 178.1 |
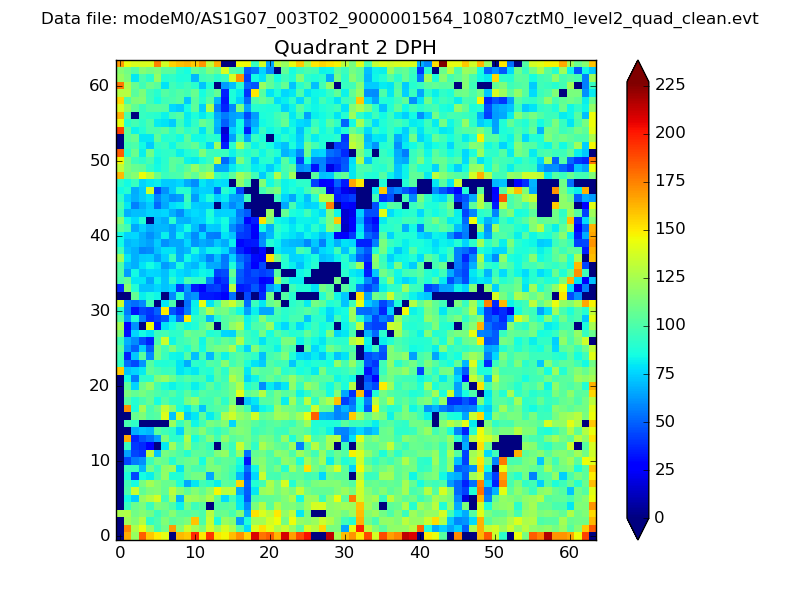
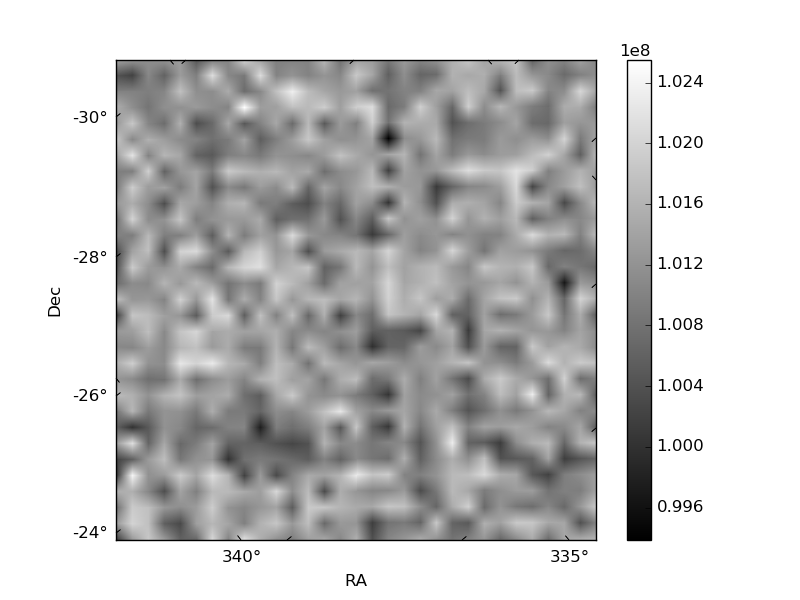
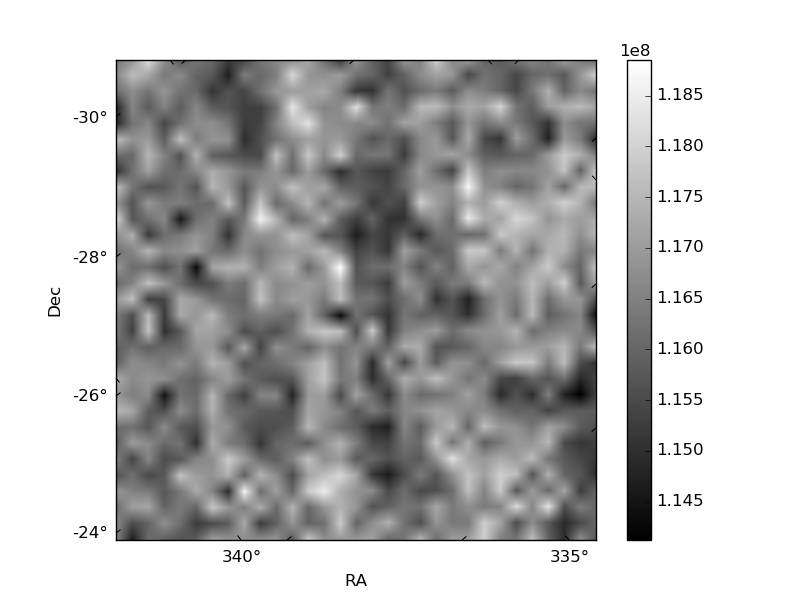
Histogram calculated using DETX and DETY for each event in the final _common_clean file
| Quadrant A | 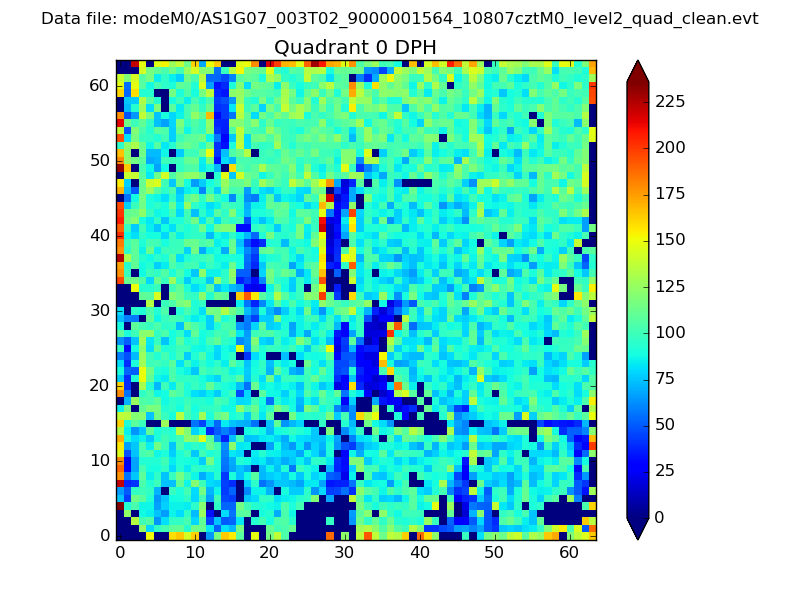 |
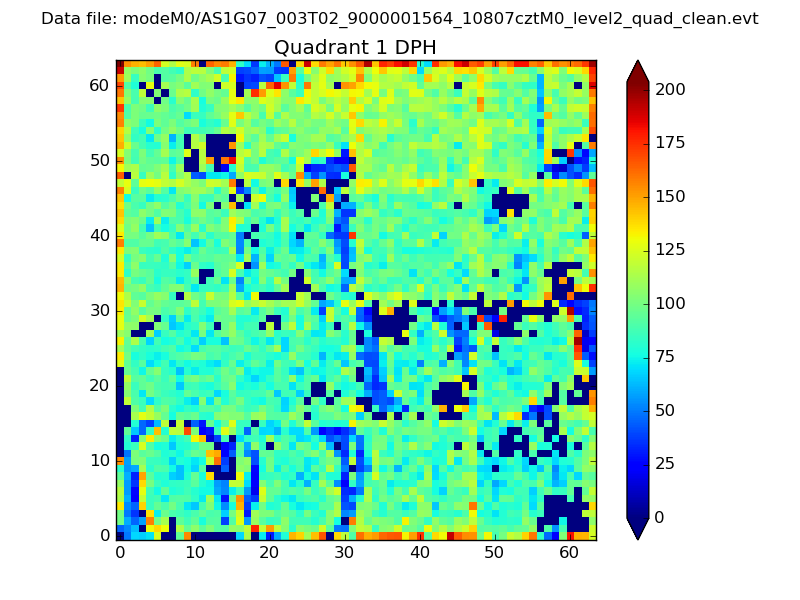 |
Quadrant B |
|---|---|---|---|
| Quadrant D | 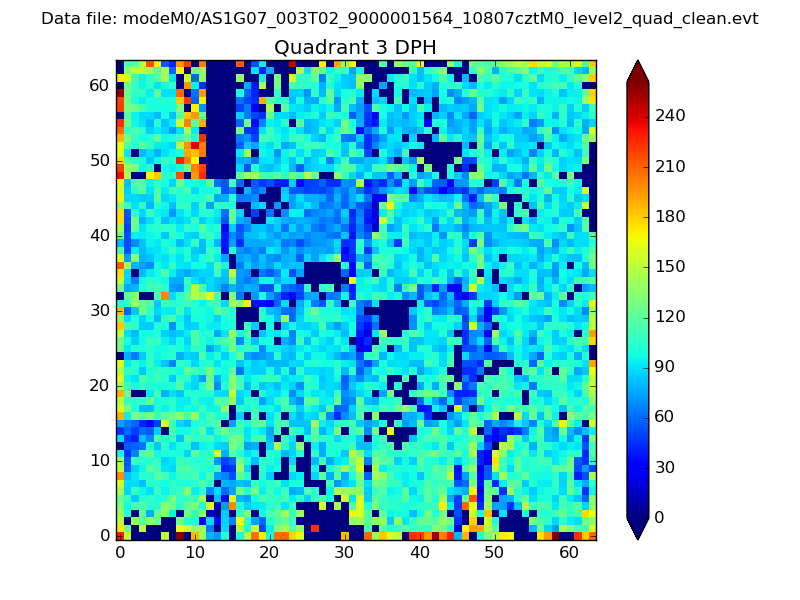 |
 |
Quadrant C |
| Plot type | Count rate plots | Images |
|---|---|---|
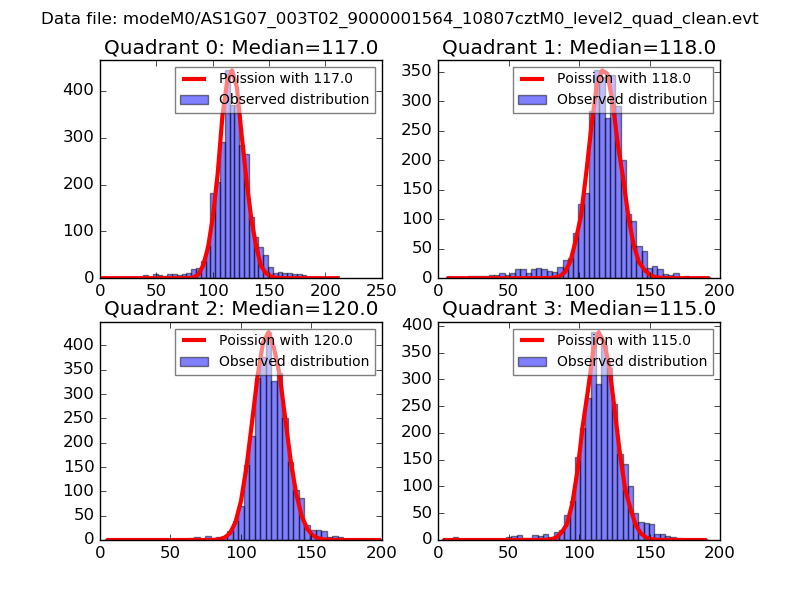
| Comparison with Poisson distribution Blue bars denote a histogram of data divided into 1 sec bins. Red curve is a Poisson curve with rate = median count rate of data. |
 |
 |
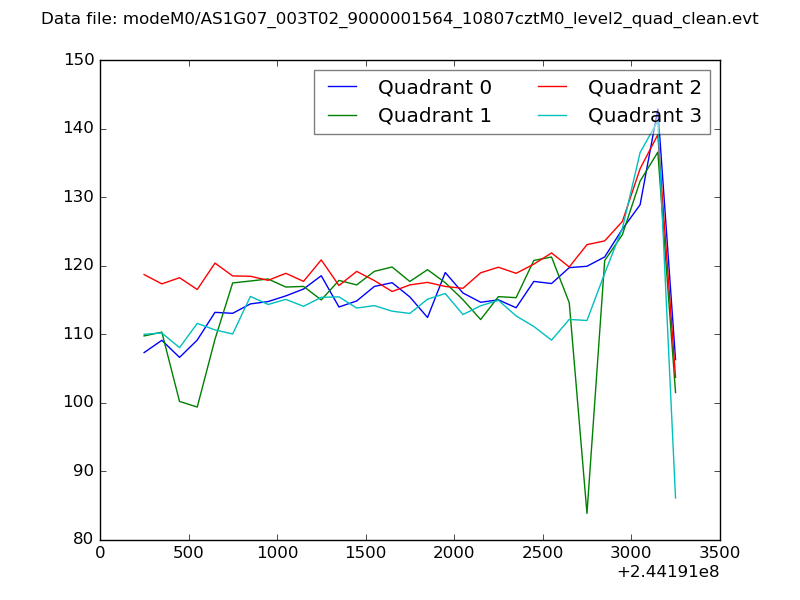
| Quadrant-wise count rates Data is divided into 100 sec bins |
 |
|
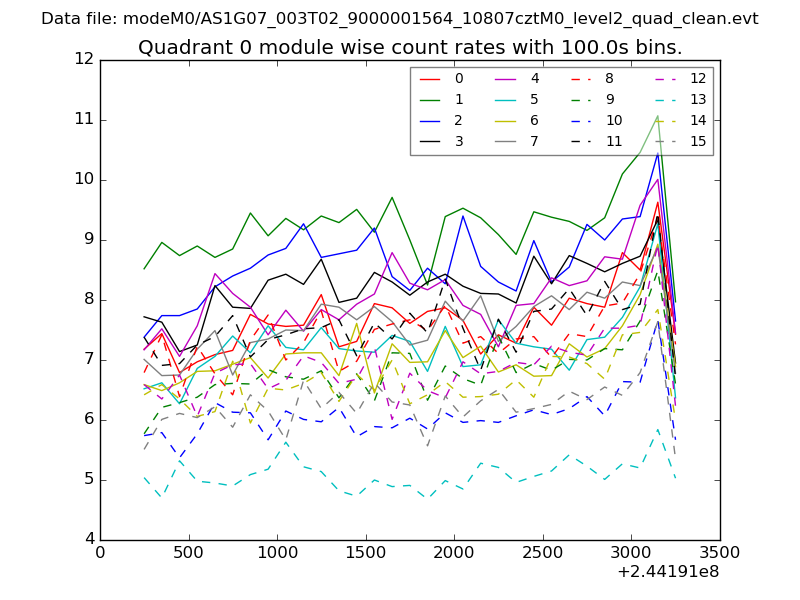
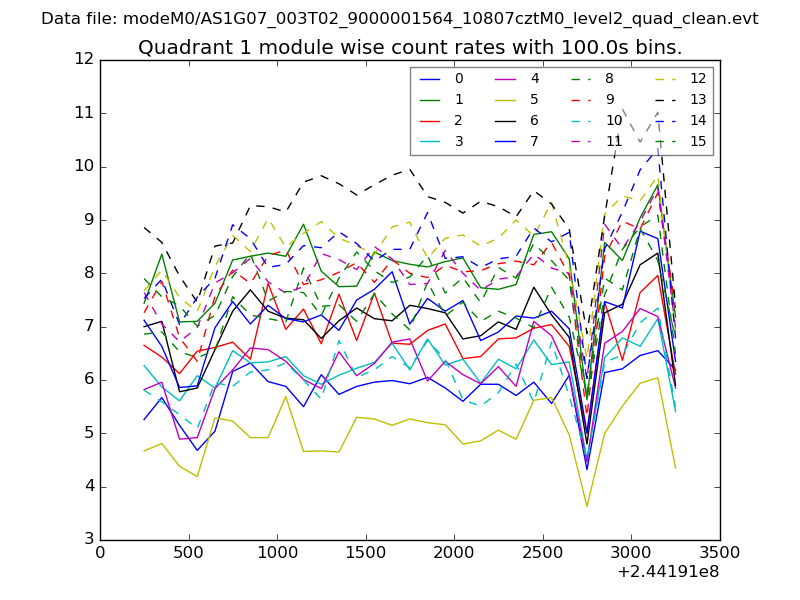
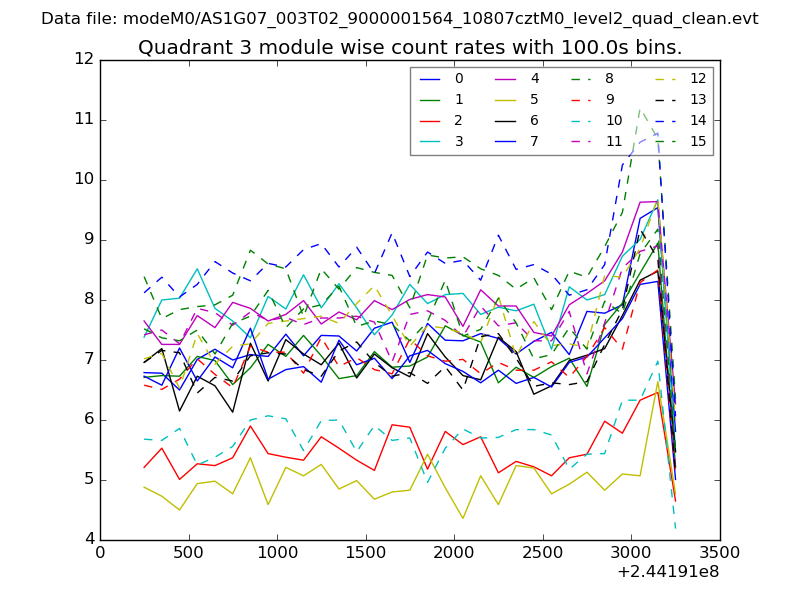
| Module-wise count rates for Quadrant A Data is divided into 100 sec bins |
 |
 |
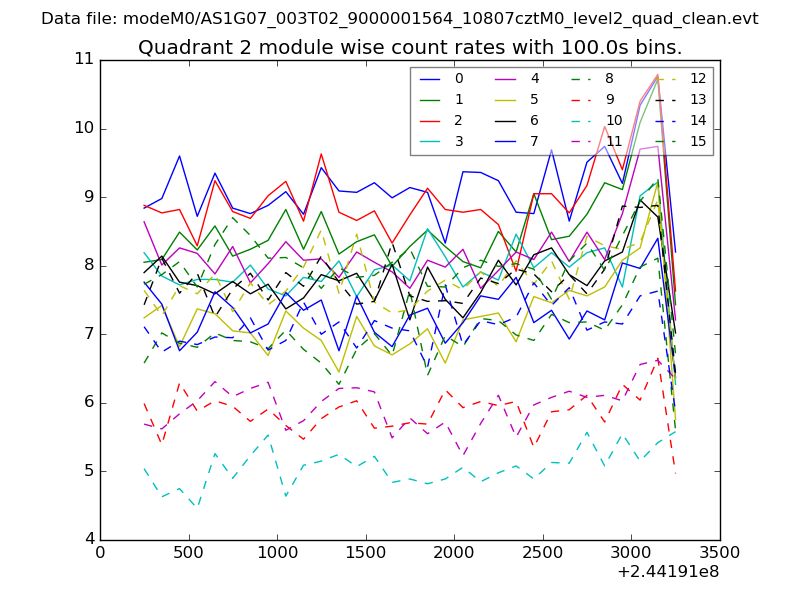
| Module-wise count rates for Quadrant B Data is divided into 100 sec bins |
 |
 |
| Module-wise count rates for Quadrant C Data is divided into 100 sec bins |
 |
 |
| Module-wise count rates for Quadrant D Data is divided into 100 sec bins |
 |
 |
| Parameter | Plot |
|---|---|
| CZT HV Monitor | 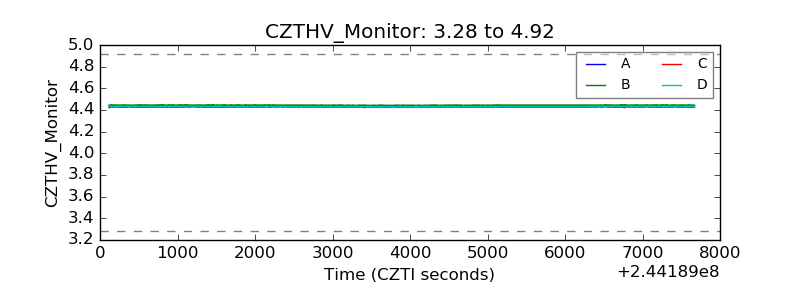 |
| D_VDD | 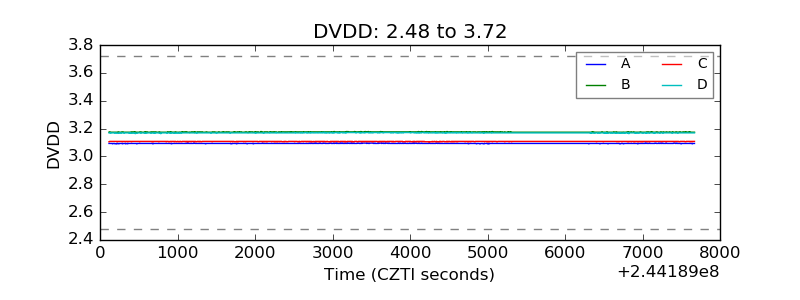 |
| Temperature 1 | 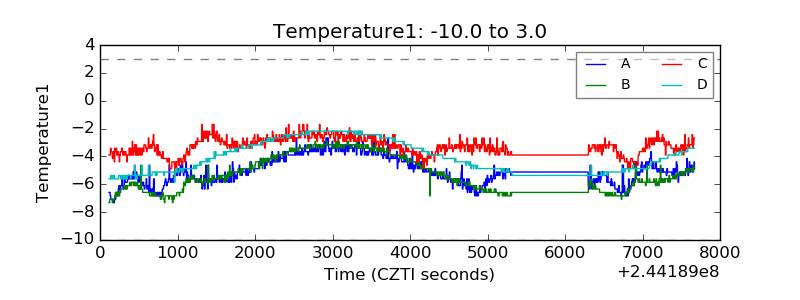 |
| Veto HV Monitor | 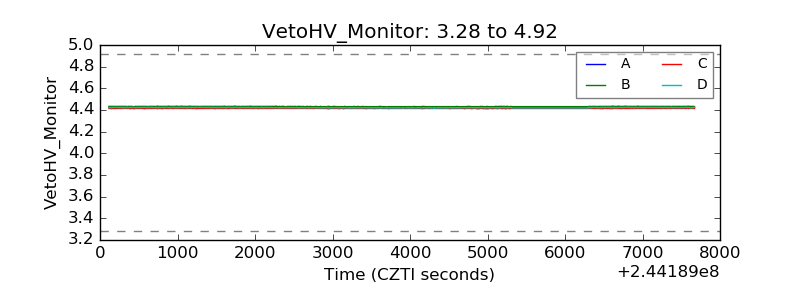 |
| Veto LLD | 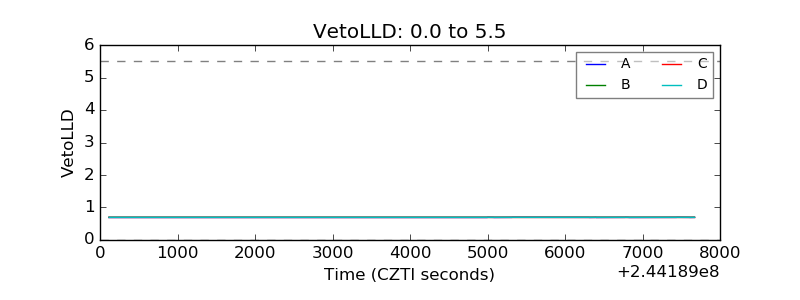 |
| Alpha Counter | 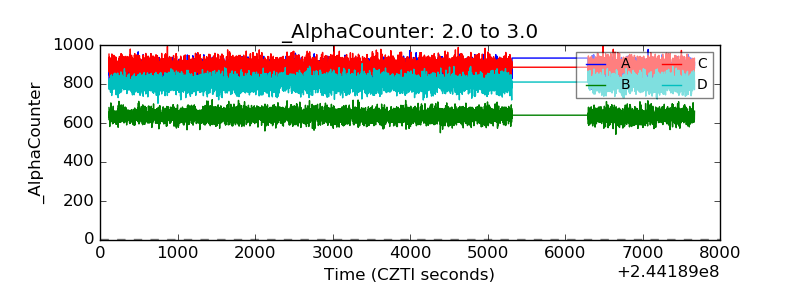 |
| _CPM_Rate | 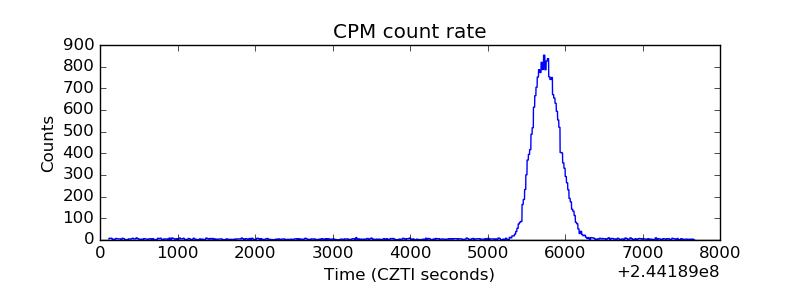 |
| CZT Counter | 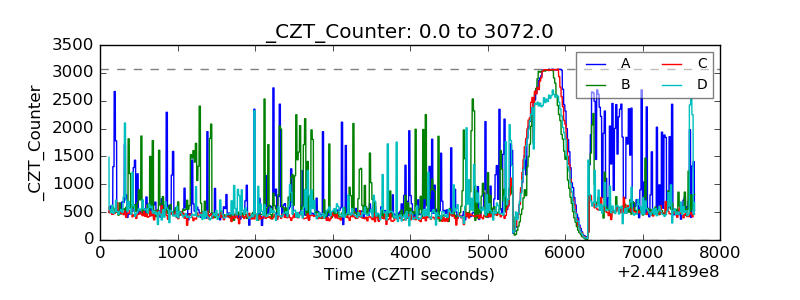 |
| +2.5 Volts monitor |  |
| +5 Volts monitor |  |
| _ROLL_ROT | 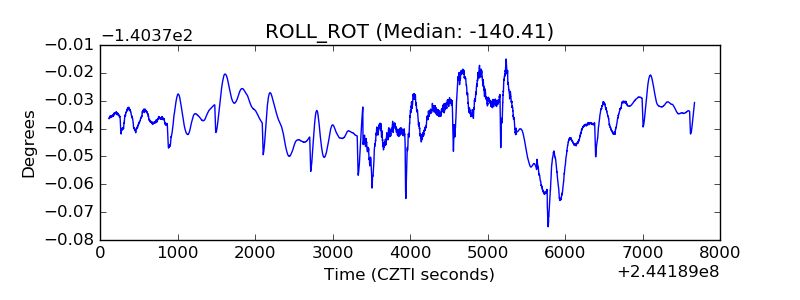 |
| _Roll_DEC | 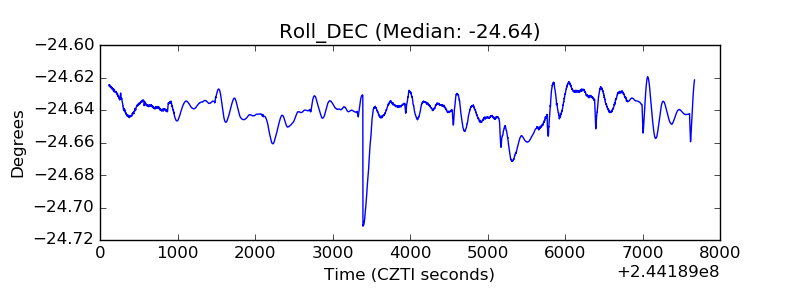 |
| _Roll_RA | 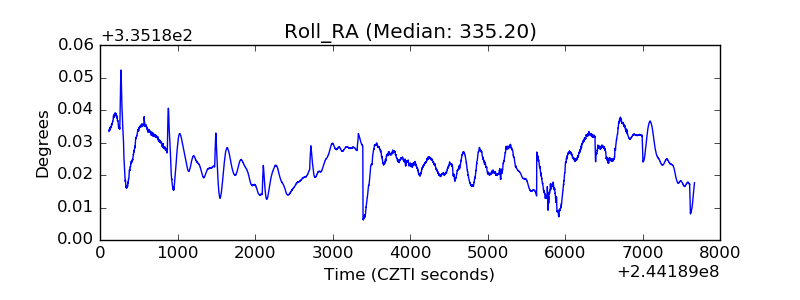 |
| Veto Counter | 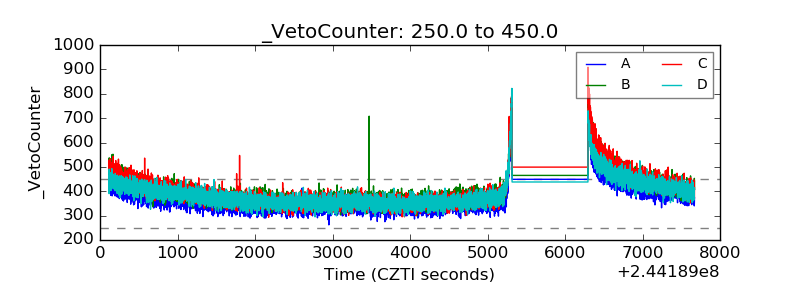 |