| Param | Original file | Final file |
|---|---|---|
| Filename | modeM0/AS1G07_003T02_9000001564_10809cztM0_level2.evt | modeM0/AS1G07_003T02_9000001564_10809cztM0_level2_quad_clean.evt |
| Size (bytes) | 624,055,680 | 66,764,160 |
| Size | 595.1 MB | 63.7 MB |
| Events in quadrant A | 6,075,226 | 381,069 |
| Events in quadrant B | 4,667,584 | 397,561 |
| Events in quadrant C | 3,205,065 | 412,667 |
| Events in quadrant D | 4,507,310 | 371,945 |
| Mode SS | |||
|---|---|---|---|
| Quadrant | BADHDUFLAG | Total packets | Discarded packets |
| A | 0 | 132 | 0 |
| B | 0 | 132 | 0 |
| C | 0 | 132 | 0 |
| D | 0 | 132 | 0 |
| Mode M9 | |||
|---|---|---|---|
| Quadrant | BADHDUFLAG | Total packets | Discarded packets |
| A | 0 | 18 | 0 |
| B | 0 | 18 | 0 |
| C | 0 | 18 | 0 |
| D | 0 | 19 | 0 |
| Mode M0 | |||
|---|---|---|---|
| Quadrant | BADHDUFLAG | Total packets | Discarded packets |
| A | 0 | 22386 | 30 |
| B | 0 | 18096 | 11 |
| C | 0 | 13996 | 13 |
| D | 0 | 17725 | 13 |
| Quadrant | Total seconds | Saturated seconds | Saturation percentage |
|---|---|---|---|
| A | 6567 | 978 | 14.892645% |
| B | 6569 | 457 | 6.956919% |
| C | 6568 | 63 | 0.959196% |
| D | 6567 | 448 | 6.821989% |
Noise dominated data is calculated using 1-second bins in cleaned event files. If a bin has >2000 counts, and if more than 50% of those come from <1% of pixels, then it is considered to be noise-dominated and hence unusable.
| Quadrant | # 1 sec bins | Bins with >0 counts | Bins with >2000 counts | High rate bins dominated by noise | Noise dominated (total time) | Noise dominated (detector-on time) | Marked lightcurve |
|---|---|---|---|---|---|---|---|
| A | 7657 | 6572 | 705 | 705 | 9.21% | 10.73% |  |
| B | 7657 | 6572 | 239 | 239 | 3.12% | 3.64% | 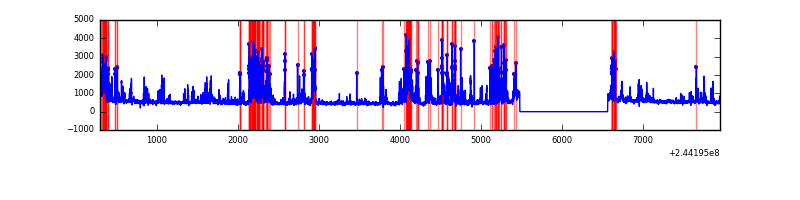 |
| C | 7657 | 6573 | 14 | 14 | 0.18% | 0.21% | 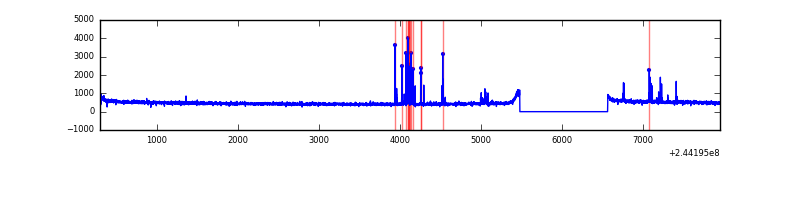 |
| D | 7657 | 6572 | 366 | 366 | 4.78% | 5.57% | 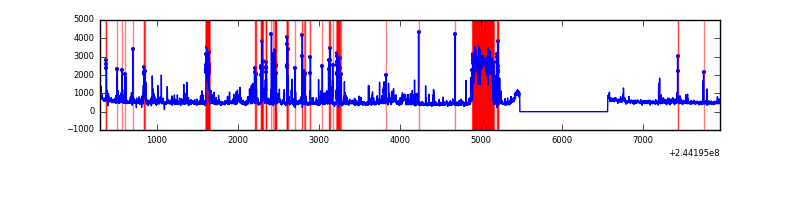 |
Top three noisy pixels from each quadrant. If the there are fewer than three noisy pixels in the level2.evt file, extra rows are filled as -1
| Pixel properties | Quadrant properties | ||||||
|---|---|---|---|---|---|---|---|
| Quadrant | DetID | PixID | Counts | Sigma | Mean | Median | Sigma |
| A | 8 | 5 | 3171919 | 20818.58 | 750 | 736 | 152.3 |
| A | 15 | 174 | 9130 | 55.11 | 750 | 736 | 152.3 |
| A | 0 | 226 | 6863 | 40.22 | 750 | 736 | 152.3 |
| B | 4 | 239 | 1432421 | 9534.24 | 793 | 773 | 150.2 |
| B | 15 | 204 | 48905 | 320.54 | 793 | 773 | 150.2 |
| B | 0 | 214 | 45142 | 295.48 | 793 | 773 | 150.2 |
| C | 14 | 234 | 134814 | 741.87 | 786 | 790 | 180.7 |
| C | 13 | 61 | 5647 | 26.89 | 786 | 790 | 180.7 |
| C | 8 | 222 | 4713 | 21.72 | 786 | 790 | 180.7 |
| D | 1 | 52 | 843941 | 4624.54 | 762 | 744 | 182.3 |
| D | 2 | 14 | 228075 | 1246.8 | 762 | 744 | 182.3 |
| D | 10 | 157 | 131516 | 717.22 | 762 | 744 | 182.3 |
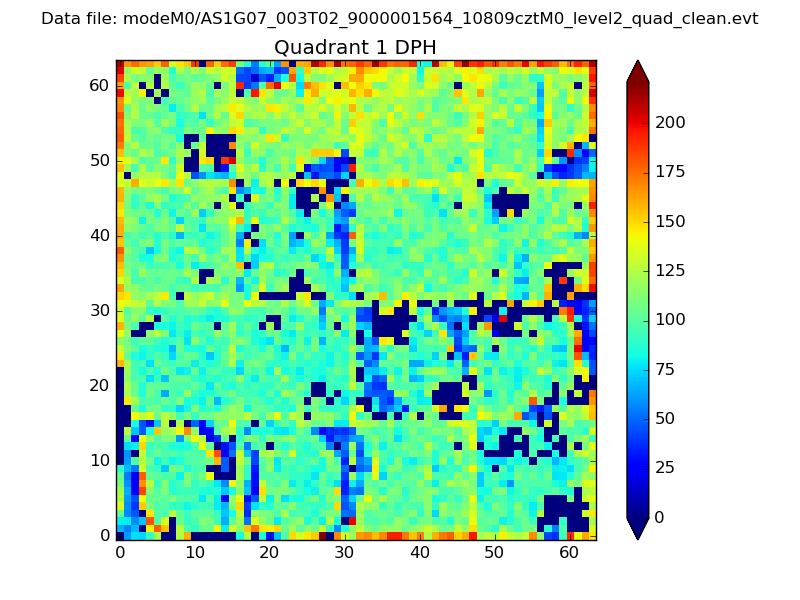
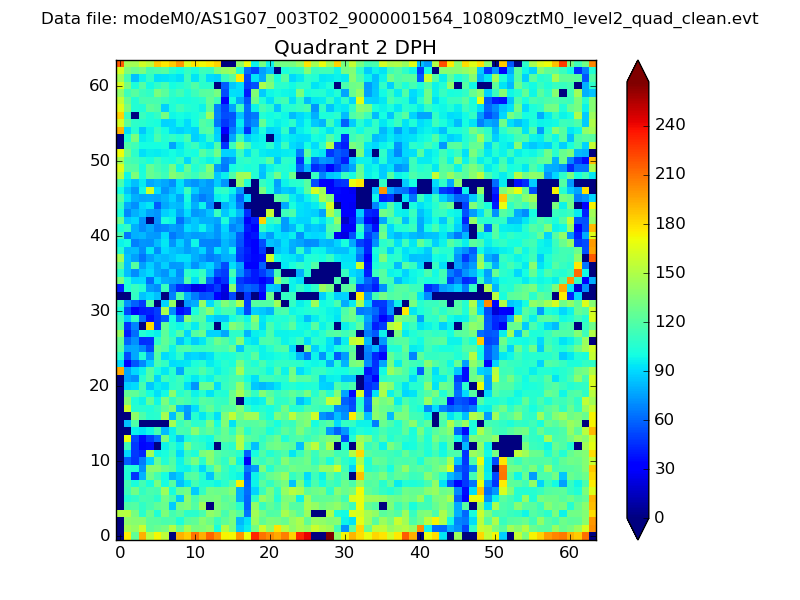
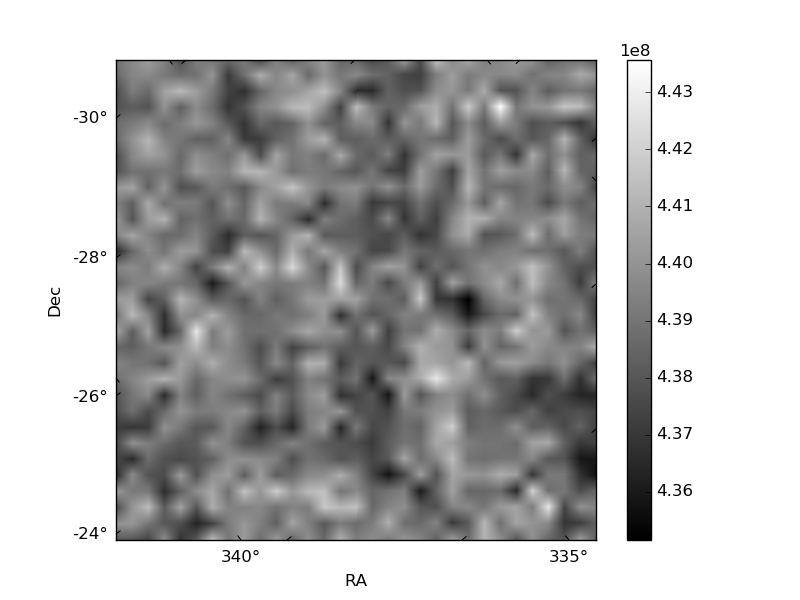
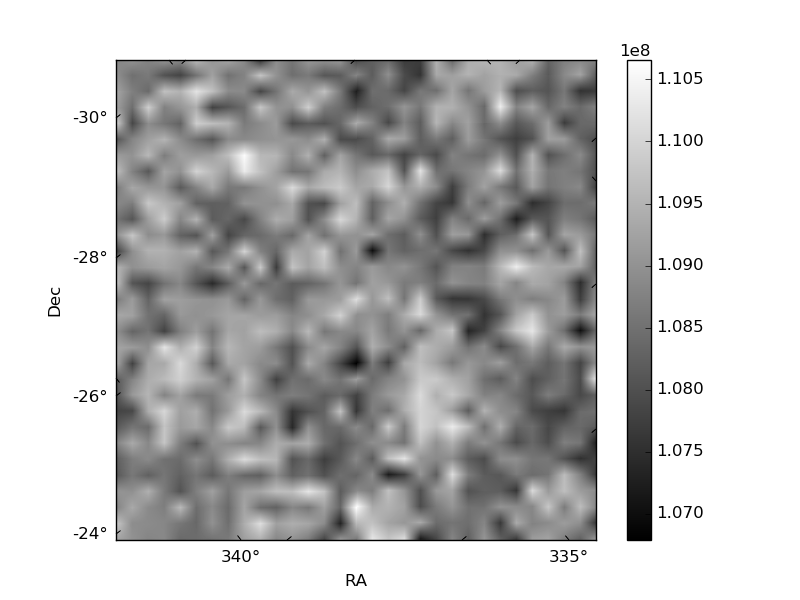
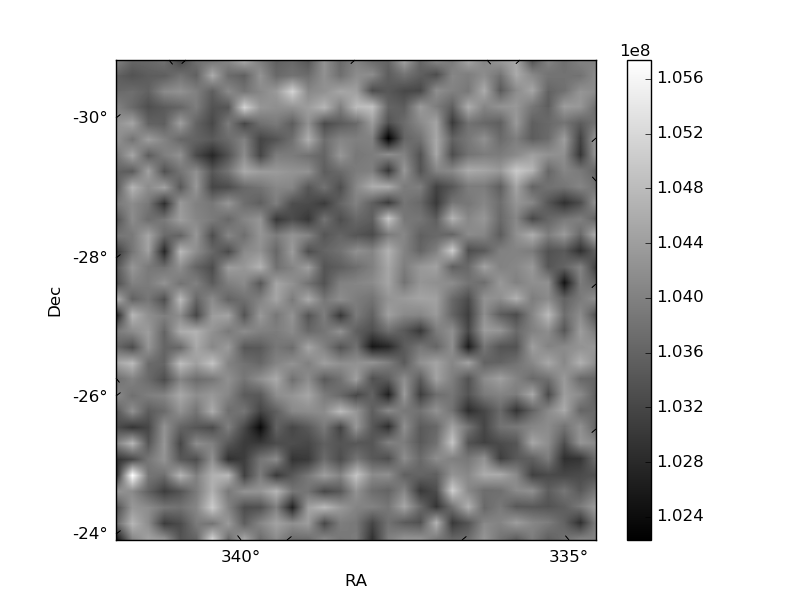
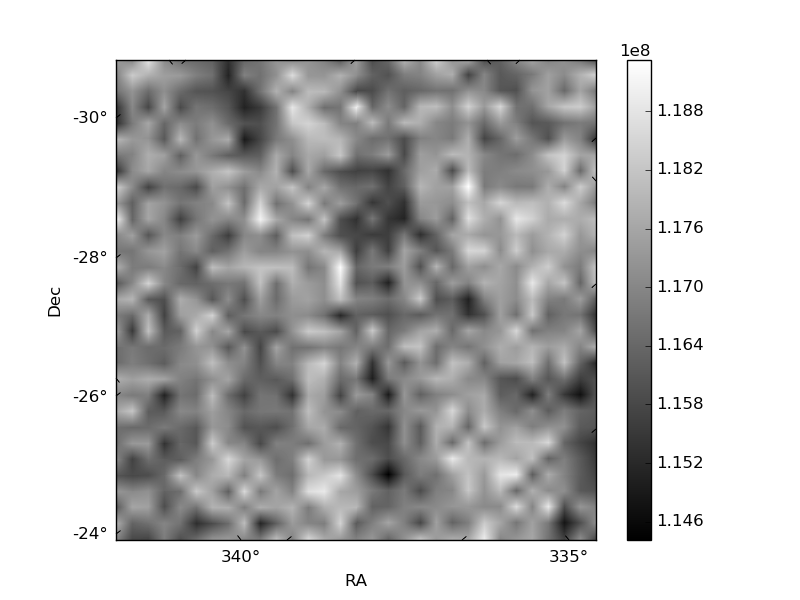
Histogram calculated using DETX and DETY for each event in the final _common_clean file
| Quadrant A | 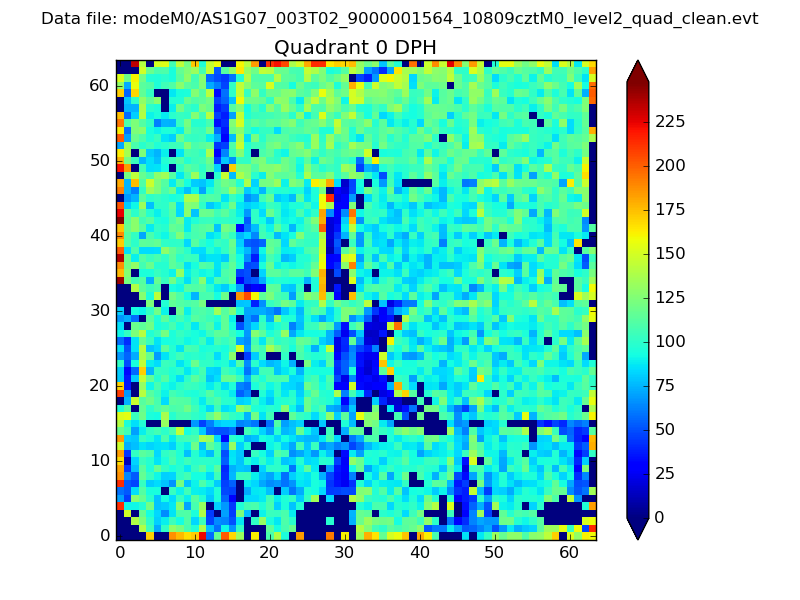 |
 |
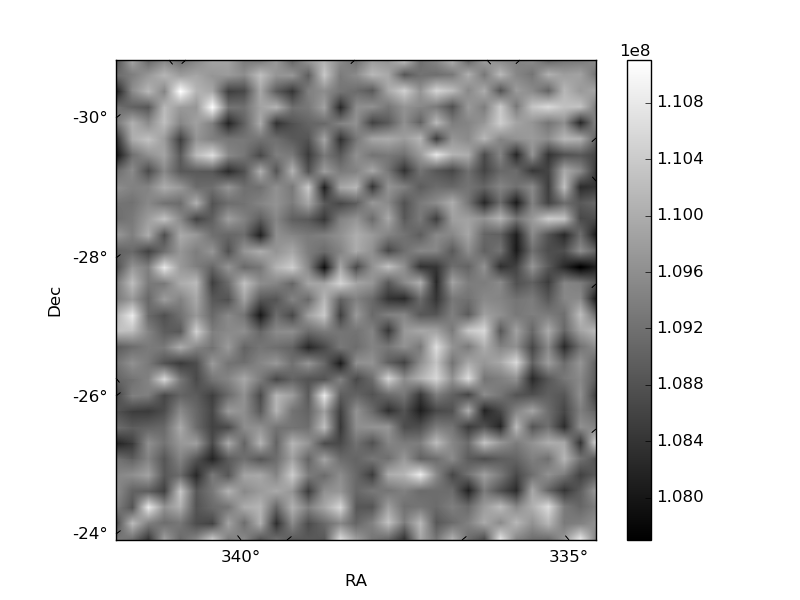
Quadrant B |
|---|---|---|---|
| Quadrant D | 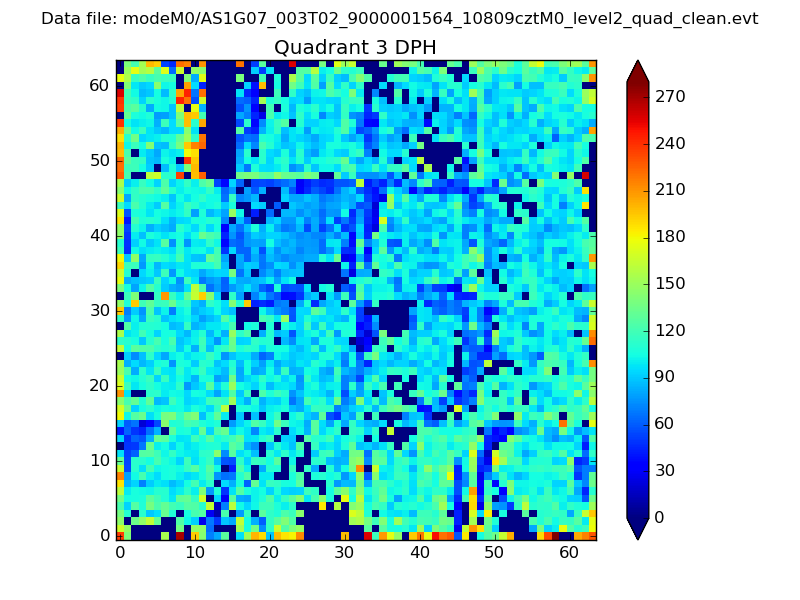 |
 |
Quadrant C |
| Plot type | Count rate plots | Images |
|---|---|---|
| Comparison with Poisson distribution Blue bars denote a histogram of data divided into 1 sec bins. Red curve is a Poisson curve with rate = median count rate of data. |
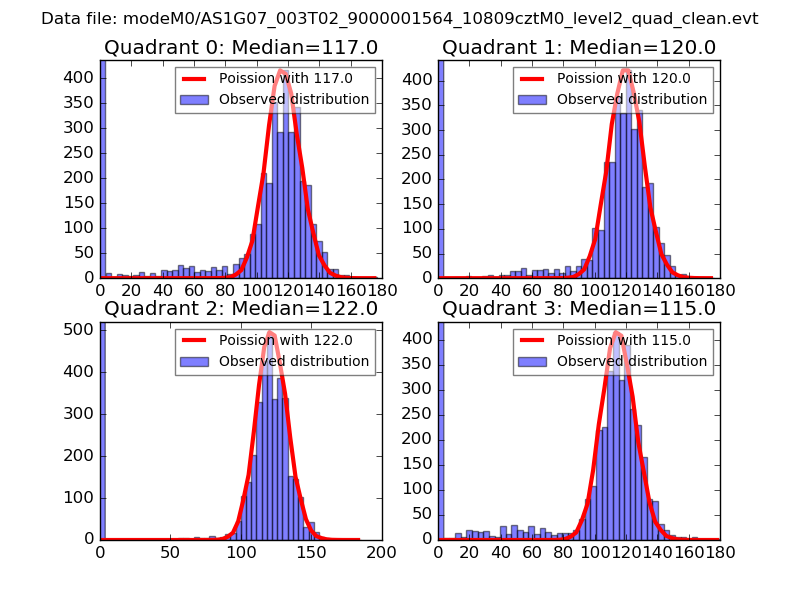 |
 |
| Quadrant-wise count rates Data is divided into 100 sec bins |
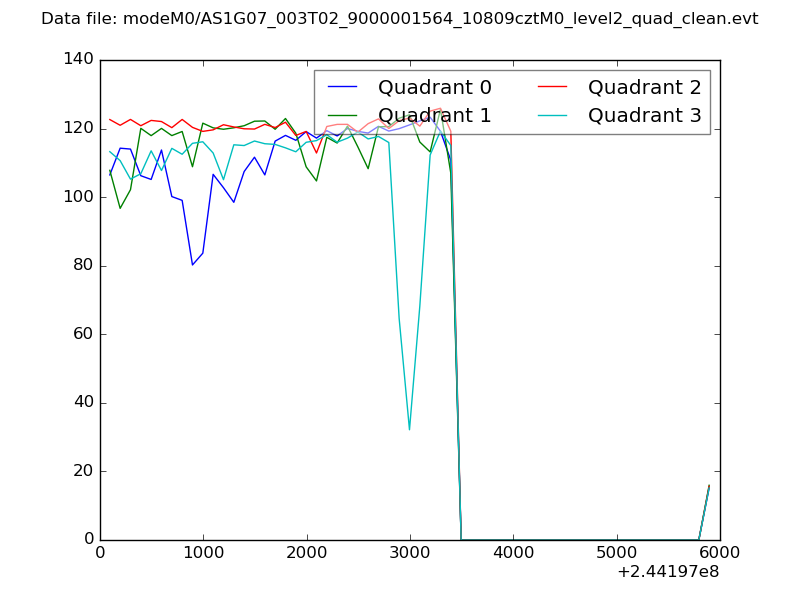 |
|
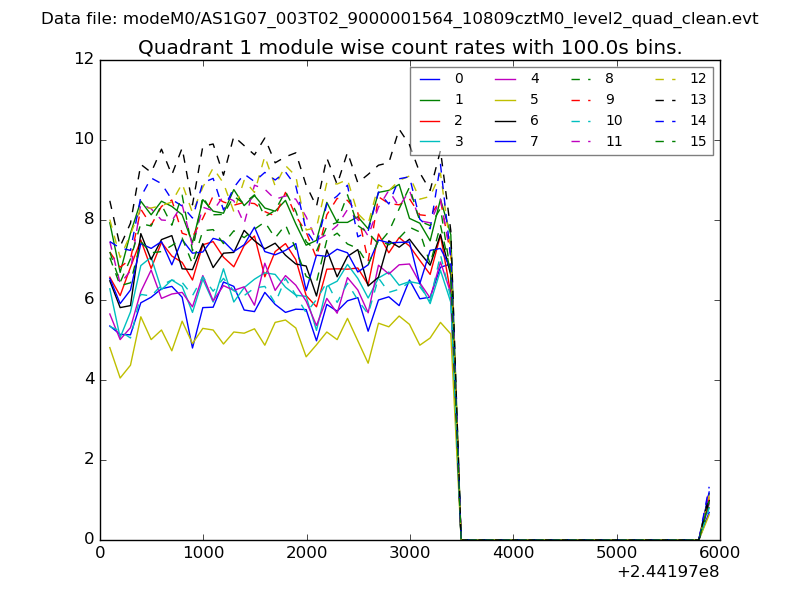
| Module-wise count rates for Quadrant A Data is divided into 100 sec bins |
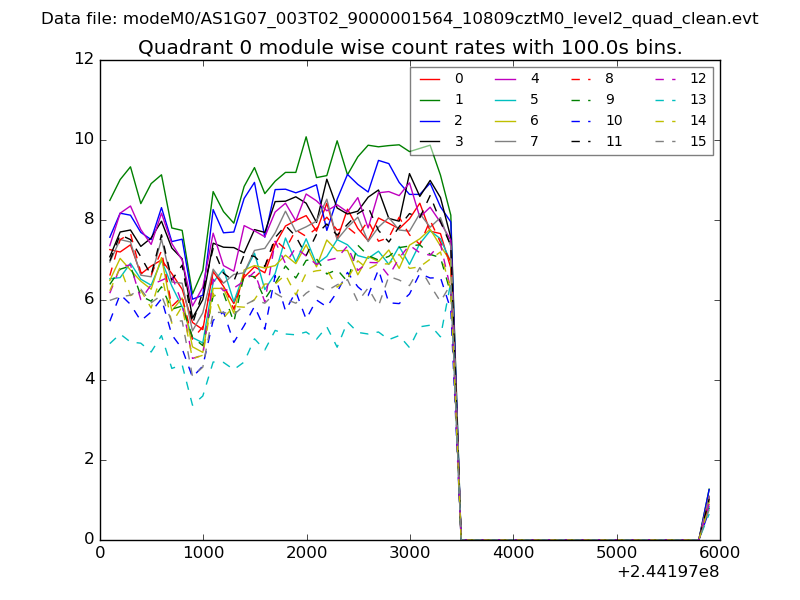 |
 |
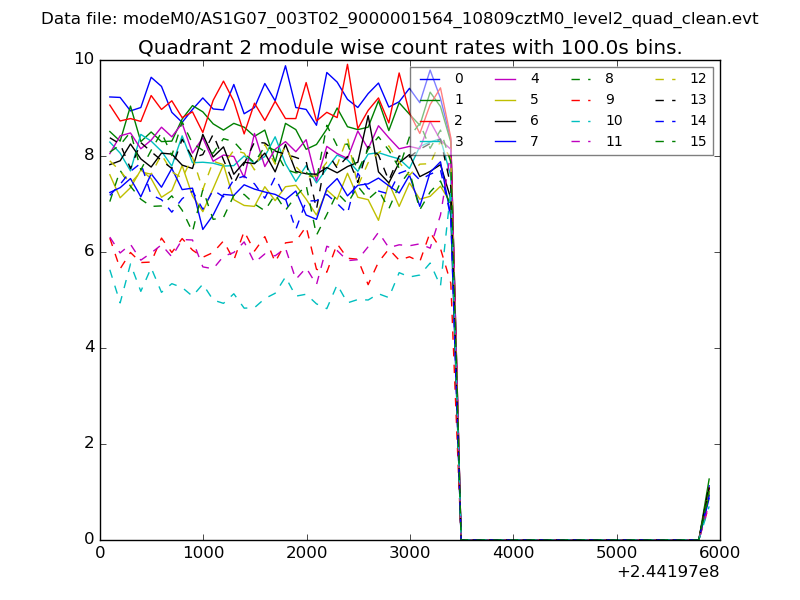
| Module-wise count rates for Quadrant B Data is divided into 100 sec bins |
 |
 |
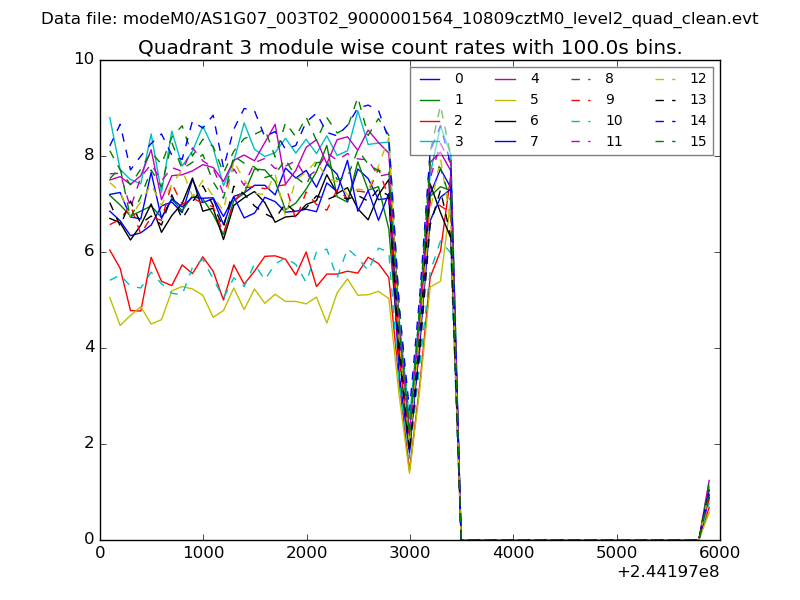
| Module-wise count rates for Quadrant C Data is divided into 100 sec bins |
 |
 |
| Module-wise count rates for Quadrant D Data is divided into 100 sec bins |
 |
 |
| Parameter | Plot |
|---|---|
| CZT HV Monitor | 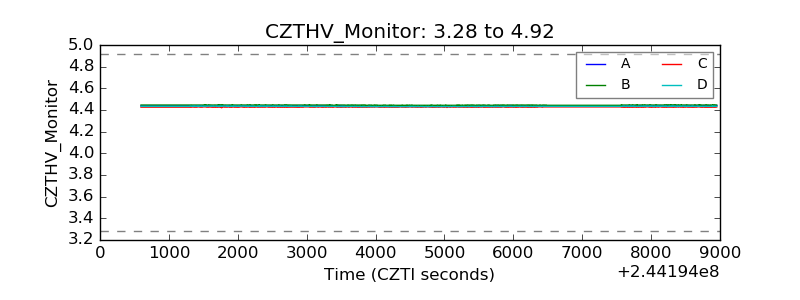 |
| D_VDD | 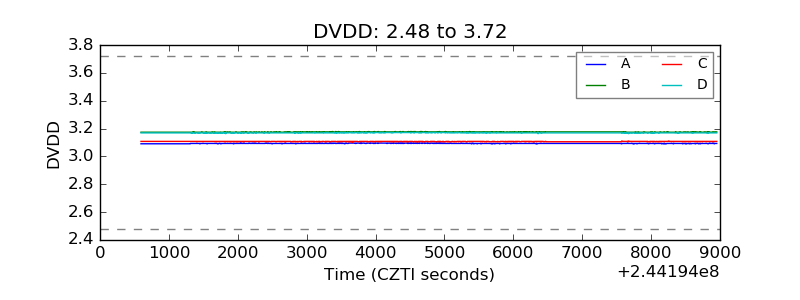 |
| Temperature 1 | 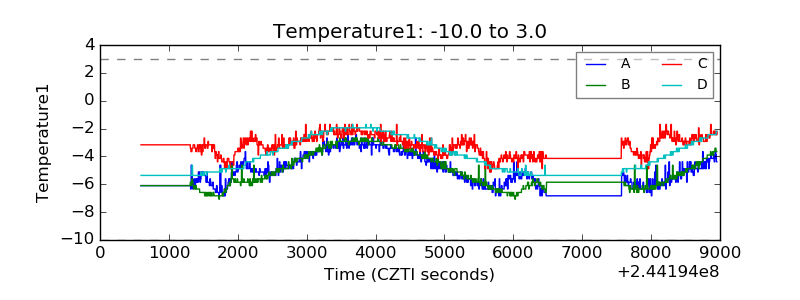 |
| Veto HV Monitor | 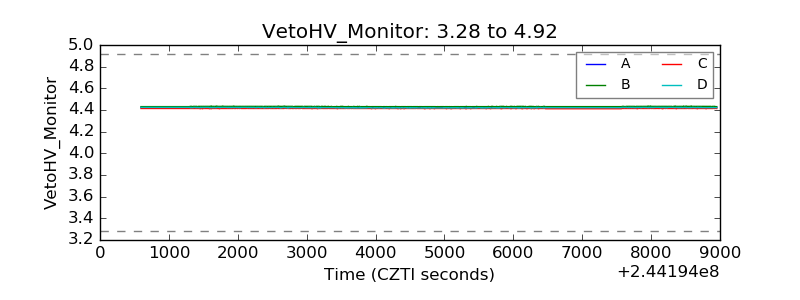 |
| Veto LLD | 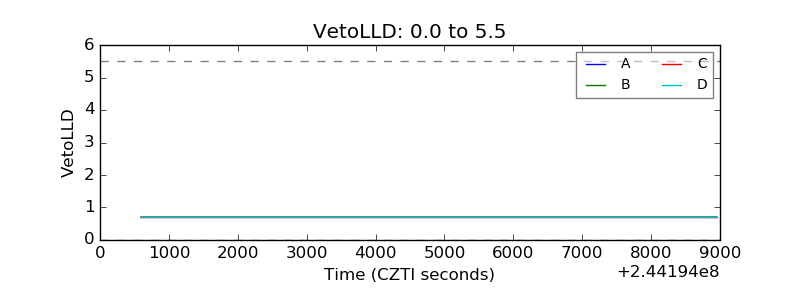 |
| Alpha Counter | 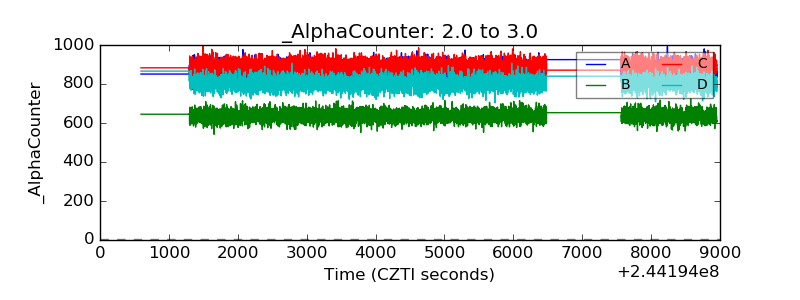 |
| _CPM_Rate | 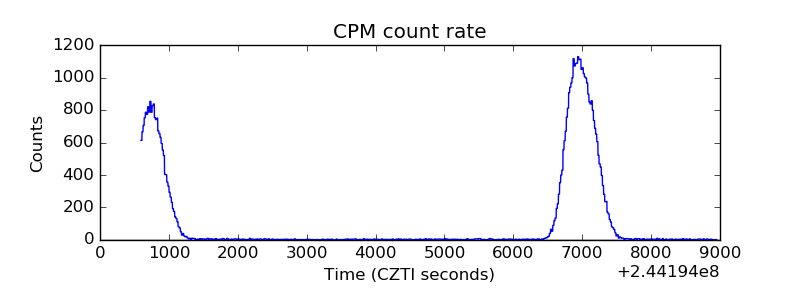 |
| CZT Counter | 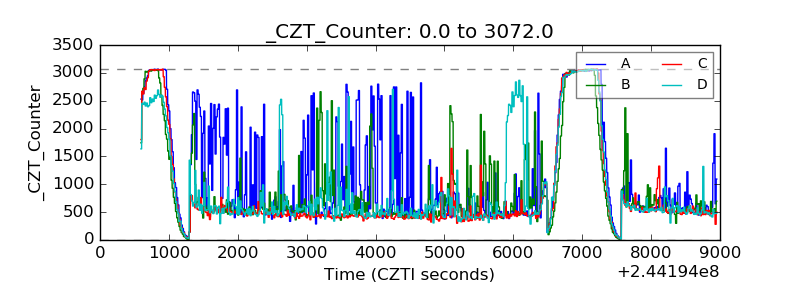 |
| +2.5 Volts monitor | 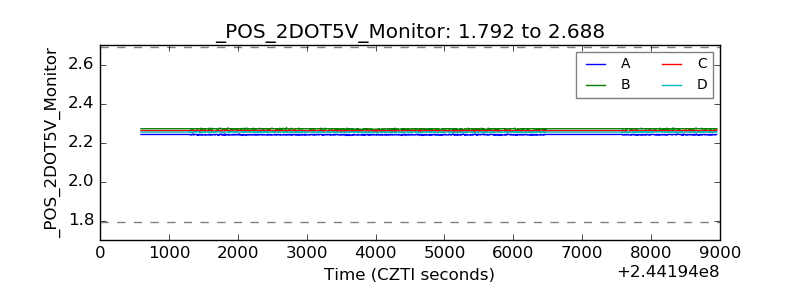 |
| +5 Volts monitor |  |
| _ROLL_ROT | 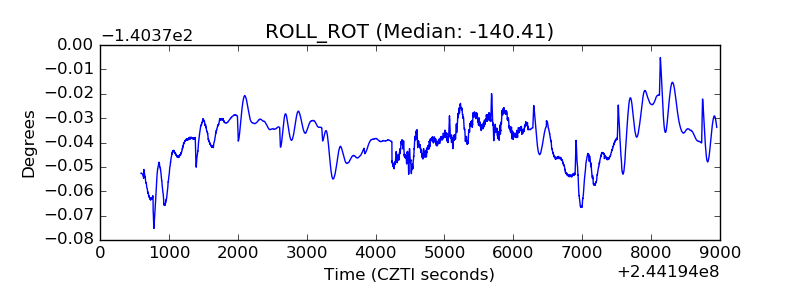 |
| _Roll_DEC | 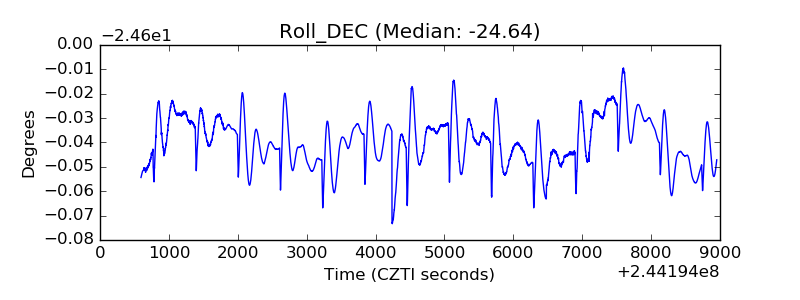 |
| _Roll_RA | 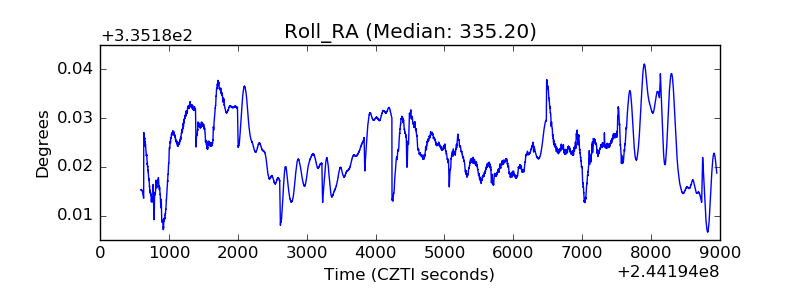 |
| Veto Counter | 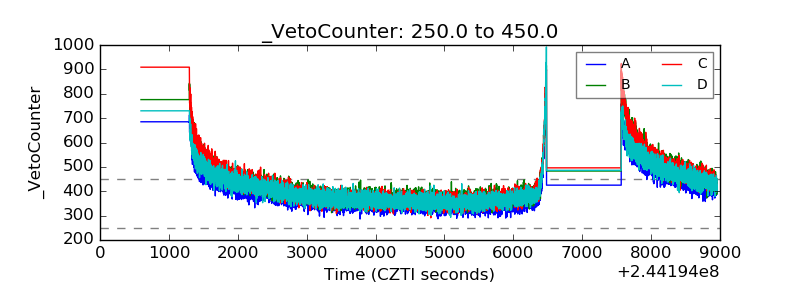 |