| Param | Original file | Final file |
|---|---|---|
| Filename | modeM0/AS1G07_003T02_9000001564_10810cztM0_level2.evt | modeM0/AS1G07_003T02_9000001564_10810cztM0_level2_quad_clean.evt |
| Size (bytes) | 1,075,599,360 | 143,899,200 |
| Size | 1.0 GB | 137.2 MB |
| Events in quadrant A | 9,986,419 | 870,498 |
| Events in quadrant B | 8,201,327 | 919,471 |
| Events in quadrant C | 5,333,343 | 939,586 |
| Events in quadrant D | 8,300,754 | 855,447 |
| Mode SS | |||
|---|---|---|---|
| Quadrant | BADHDUFLAG | Total packets | Discarded packets |
| A | 0 | 226 | 0 |
| B | 0 | 226 | 0 |
| C | 0 | 226 | 0 |
| D | 0 | 226 | 0 |
| Mode M9 | |||
|---|---|---|---|
| Quadrant | BADHDUFLAG | Total packets | Discarded packets |
| A | 0 | 23 | 0 |
| B | 0 | 23 | 0 |
| C | 0 | 23 | 0 |
| D | 0 | 23 | 0 |
| Mode M0 | |||
|---|---|---|---|
| Quadrant | BADHDUFLAG | Total packets | Discarded packets |
| A | 0 | 37034 | 7 |
| B | 0 | 31633 | 2 |
| C | 0 | 23543 | 2 |
| D | 0 | 32058 | 2 |
| Quadrant | Total seconds | Saturated seconds | Saturation percentage |
|---|---|---|---|
| A | 11160 | 1417 | 12.697133% |
| B | 11161 | 911 | 8.162351% |
| C | 11161 | 140 | 1.254368% |
| D | 11161 | 834 | 7.472449% |
Noise dominated data is calculated using 1-second bins in cleaned event files. If a bin has >2000 counts, and if more than 50% of those come from <1% of pixels, then it is considered to be noise-dominated and hence unusable.
| Quadrant | # 1 sec bins | Bins with >0 counts | Bins with >2000 counts | High rate bins dominated by noise | Noise dominated (total time) | Noise dominated (detector-on time) | Marked lightcurve |
|---|---|---|---|---|---|---|---|
| A | 13411 | 11161 | 953 | 953 | 7.11% | 8.54% | 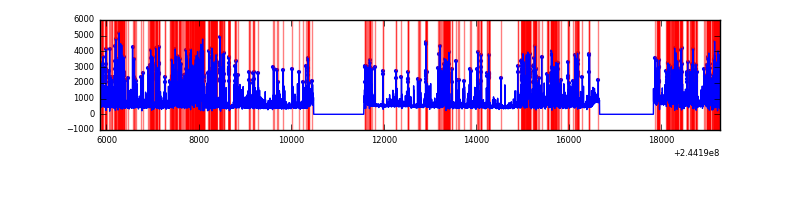 |
| B | 13411 | 11161 | 487 | 487 | 3.63% | 4.36% | 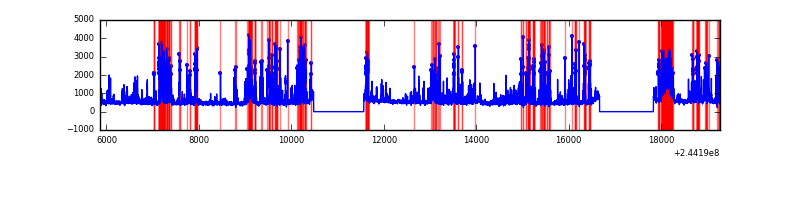 |
| C | 13411 | 11162 | 19 | 19 | 0.14% | 0.17% | 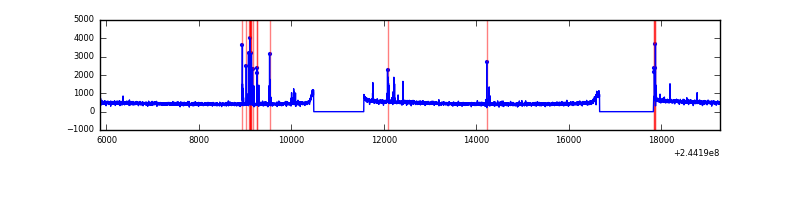 |
| D | 13411 | 11161 | 644 | 644 | 4.80% | 5.77% | 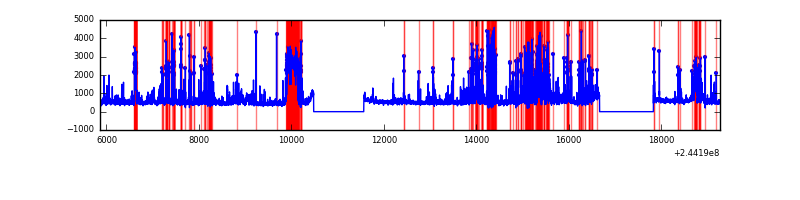 |
Top three noisy pixels from each quadrant. If the there are fewer than three noisy pixels in the level2.evt file, extra rows are filled as -1
| Pixel properties | Quadrant properties | ||||||
|---|---|---|---|---|---|---|---|
| Quadrant | DetID | PixID | Counts | Sigma | Mean | Median | Sigma |
| A | 8 | 5 | 4938834 | 18888.43 | 1299 | 1274 | 261.4 |
| A | 15 | 174 | 19395 | 69.32 | 1299 | 1274 | 261.4 |
| A | 4 | 2 | 13762 | 47.77 | 1299 | 1274 | 261.4 |
| B | 4 | 239 | 2648600 | 10470.47 | 1336 | 1303 | 252.8 |
| B | 15 | 204 | 165899 | 651.0 | 1336 | 1303 | 252.8 |
| B | 0 | 214 | 87023 | 339.04 | 1336 | 1303 | 252.8 |
| C | 14 | 234 | 161063 | 525.55 | 1326 | 1332 | 303.9 |
| C | 13 | 61 | 9754 | 27.71 | 1326 | 1332 | 303.9 |
| C | 8 | 222 | 6189 | 15.98 | 1326 | 1332 | 303.9 |
| D | 1 | 52 | 1099252 | 3569.77 | 1289 | 1255 | 307.6 |
| D | 12 | 233 | 582476 | 1889.64 | 1289 | 1255 | 307.6 |
| D | 2 | 14 | 438511 | 1421.59 | 1289 | 1255 | 307.6 |
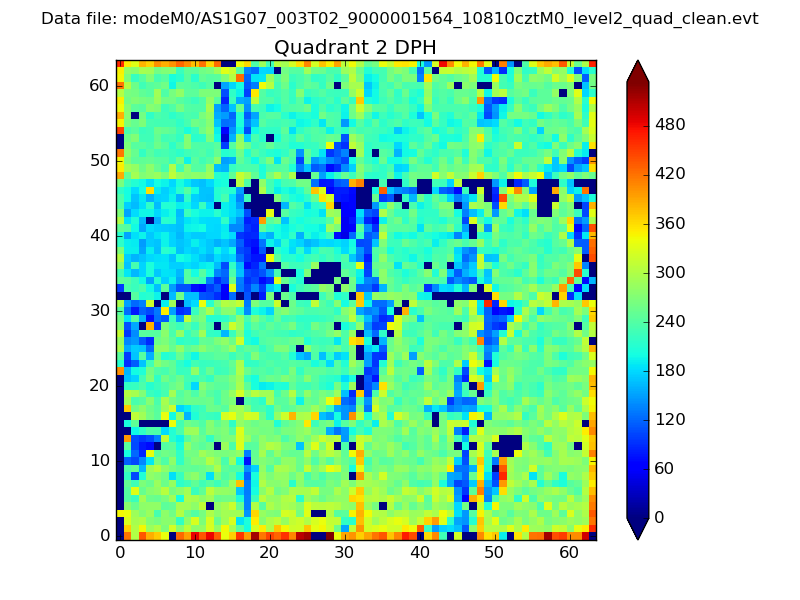
Histogram calculated using DETX and DETY for each event in the final _common_clean file
| Quadrant A | 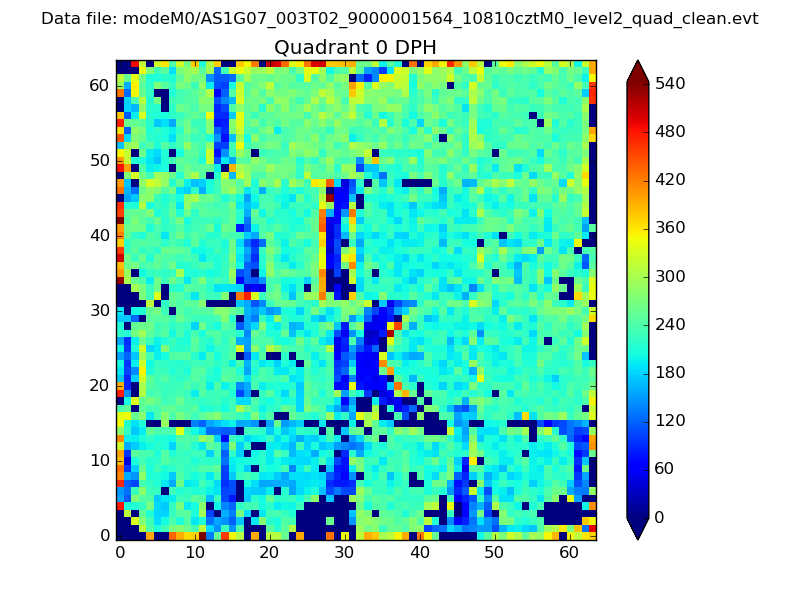 |
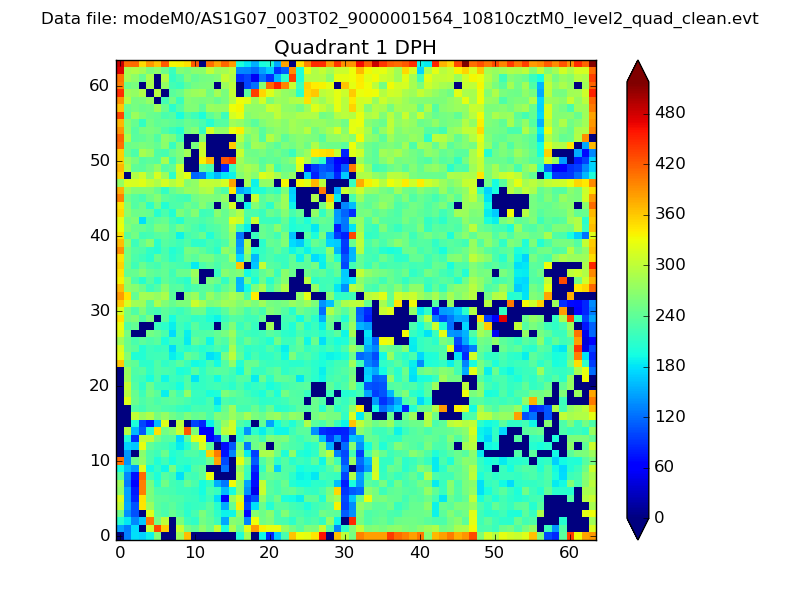 |
Quadrant B |
|---|---|---|---|
| Quadrant D | 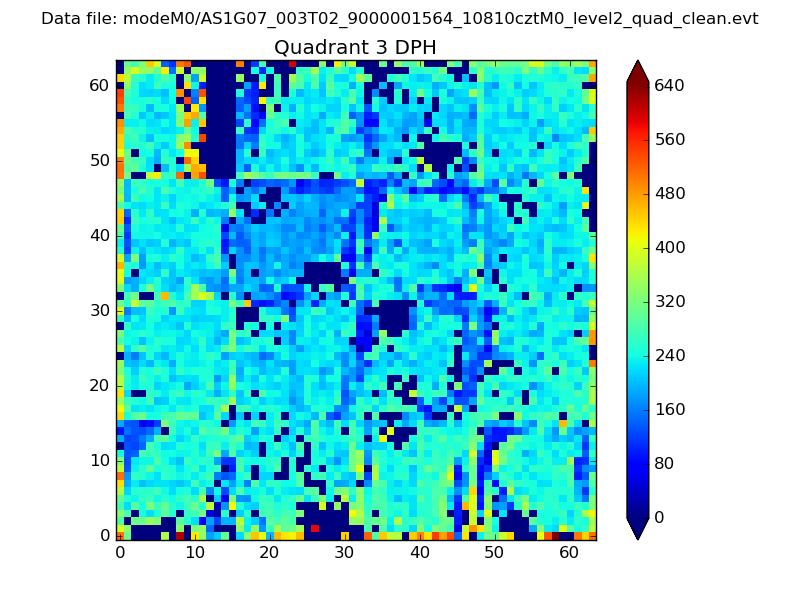 |
 |
Quadrant C |
| Plot type | Count rate plots | Images |
|---|---|---|
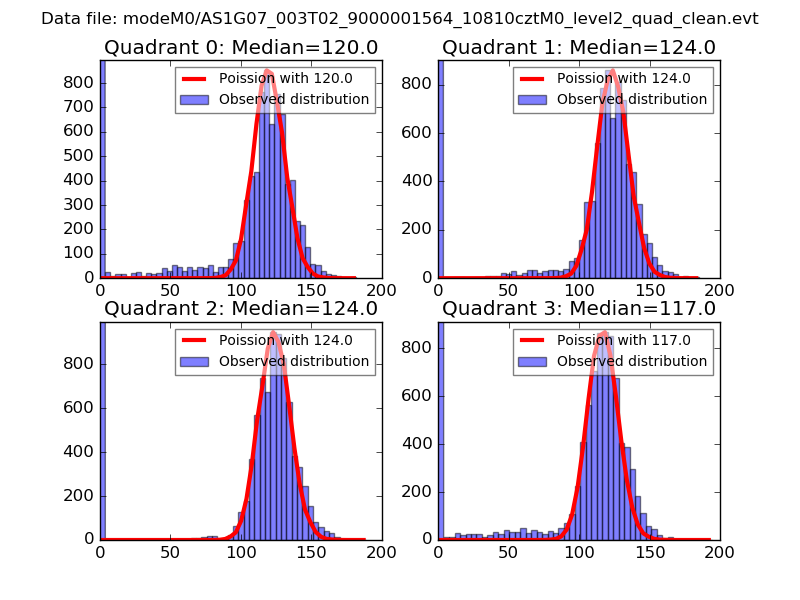
| Comparison with Poisson distribution Blue bars denote a histogram of data divided into 1 sec bins. Red curve is a Poisson curve with rate = median count rate of data. |
 |
 |
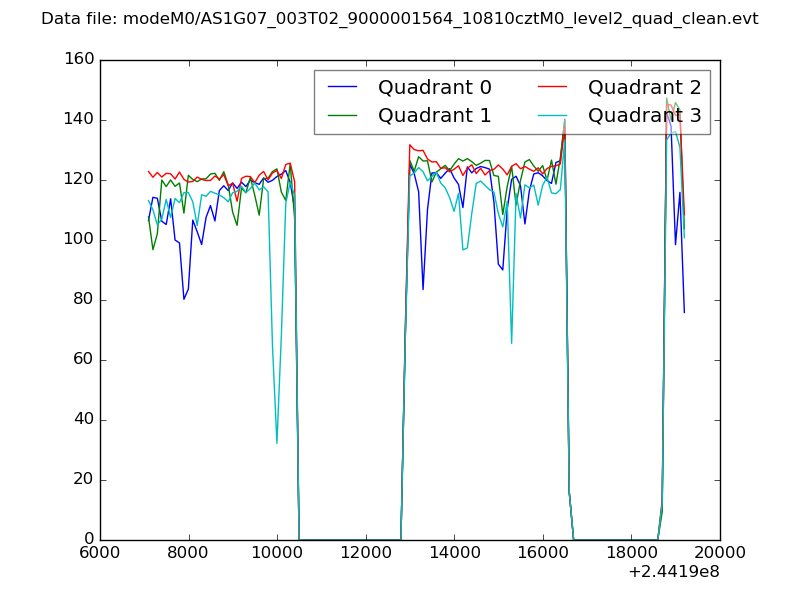
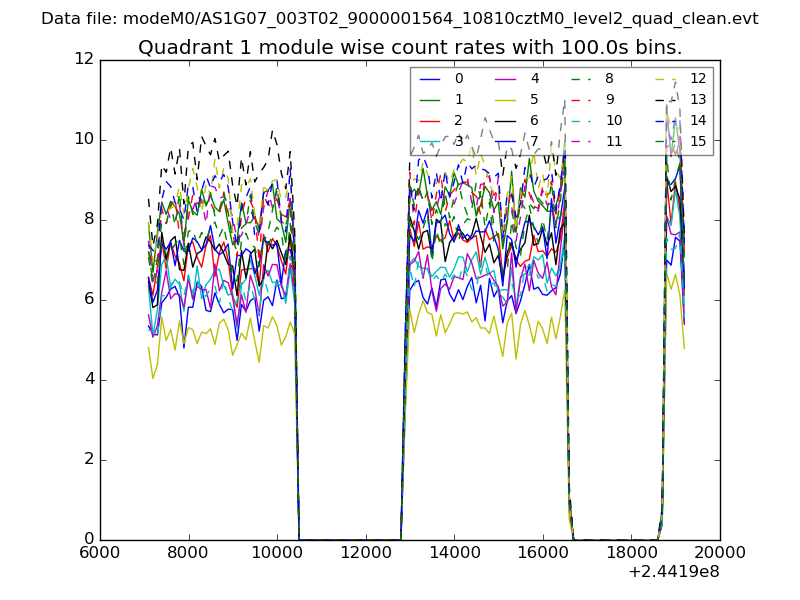
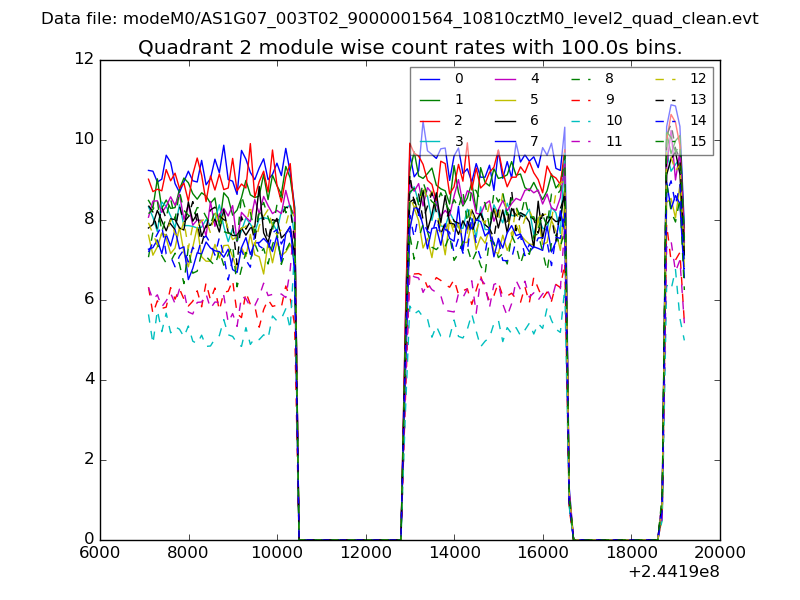
| Quadrant-wise count rates Data is divided into 100 sec bins |
 |
|
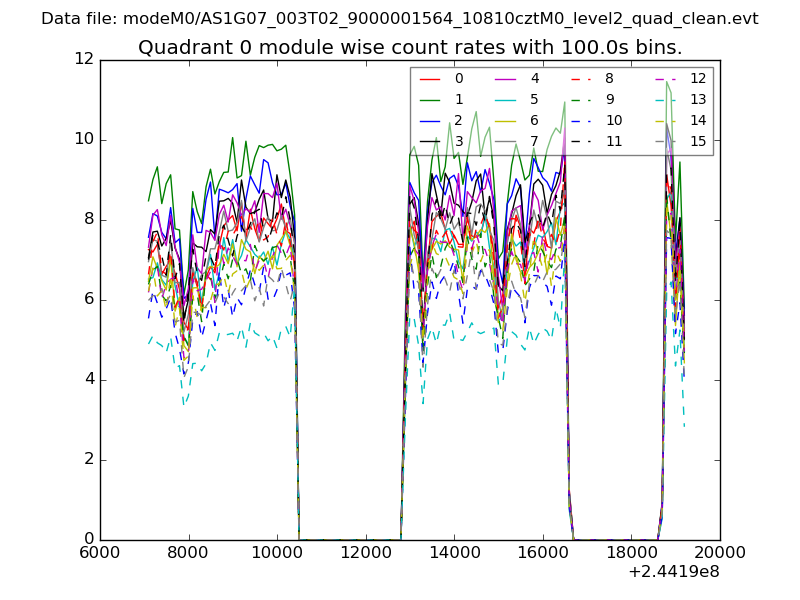
| Module-wise count rates for Quadrant A Data is divided into 100 sec bins |
 |
 |
| Module-wise count rates for Quadrant B Data is divided into 100 sec bins |
 |
 |
| Module-wise count rates for Quadrant C Data is divided into 100 sec bins |
 |
 |
| Module-wise count rates for Quadrant D Data is divided into 100 sec bins |
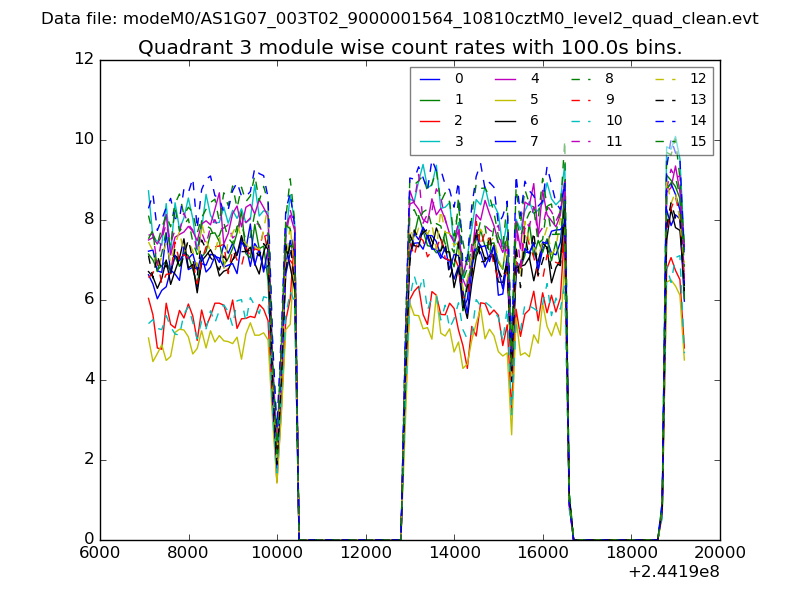 |
 |
| Parameter | Plot |
|---|---|
| CZT HV Monitor | 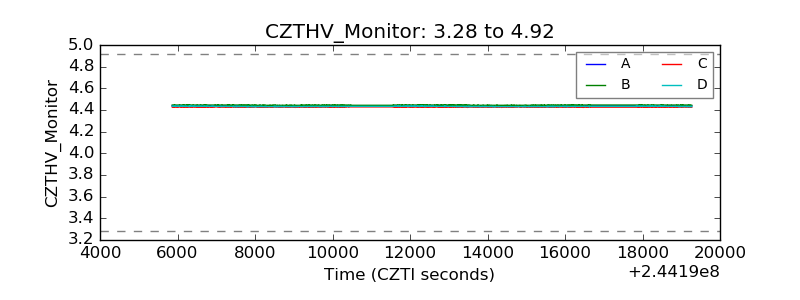 |
| D_VDD | 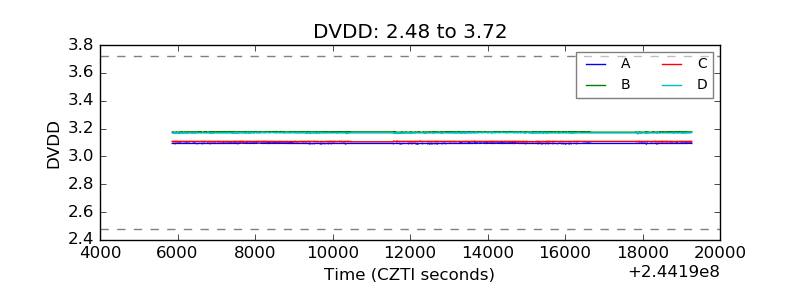 |
| Temperature 1 |  |
| Veto HV Monitor | 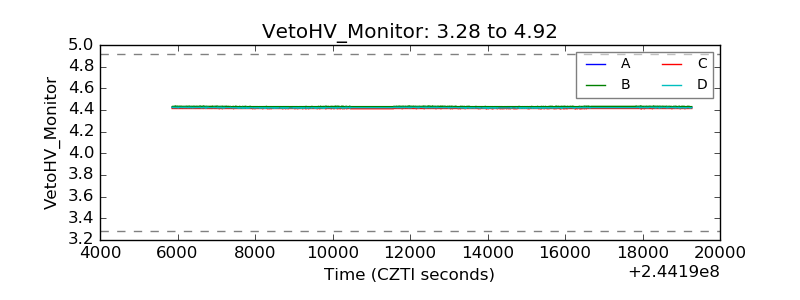 |
| Veto LLD | 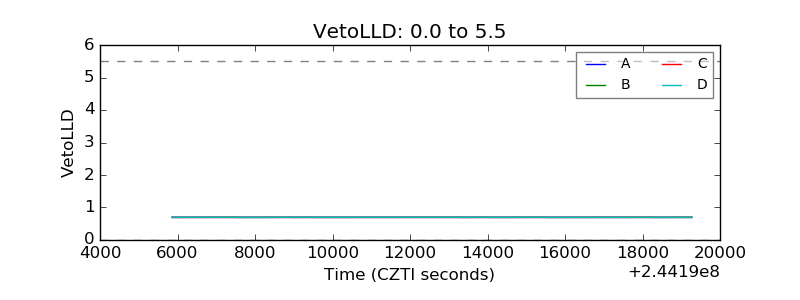 |
| Alpha Counter | 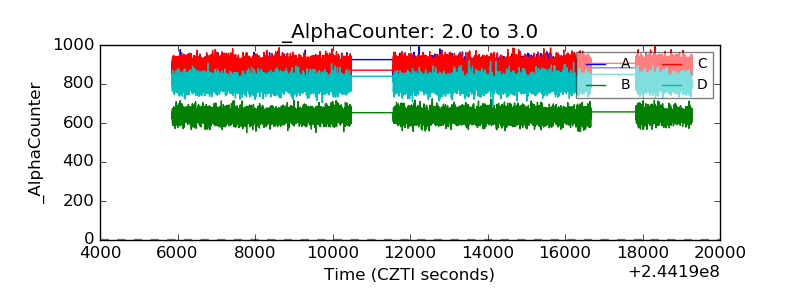 |
| _CPM_Rate |  |
| CZT Counter | 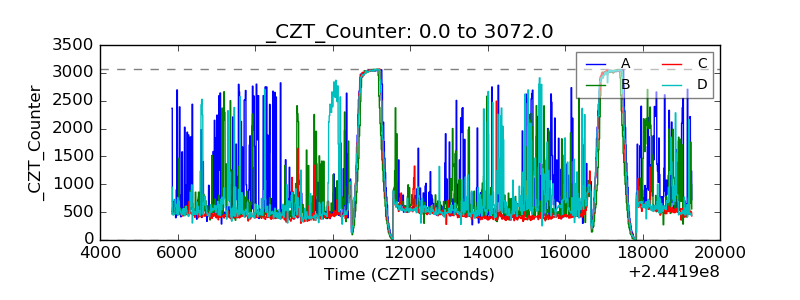 |
| +2.5 Volts monitor |  |
| +5 Volts monitor |  |
| _ROLL_ROT | 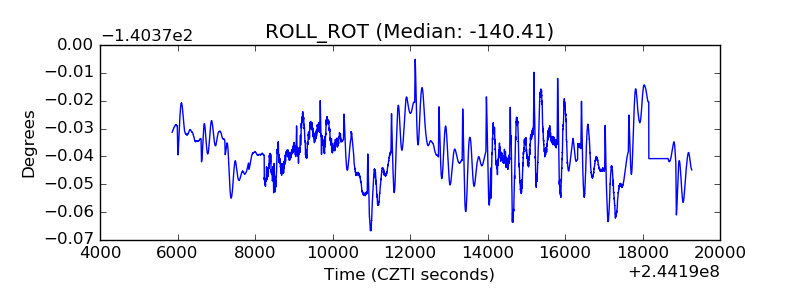 |
| _Roll_DEC | 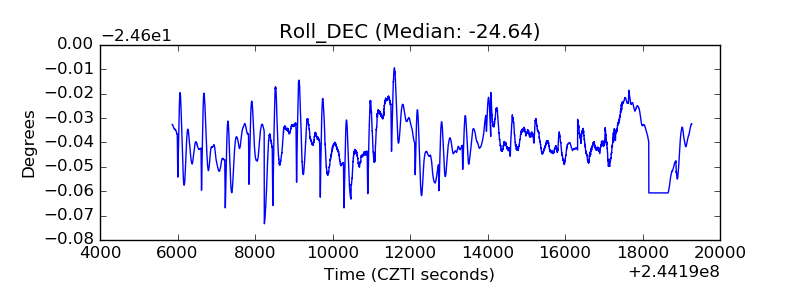 |
| _Roll_RA | 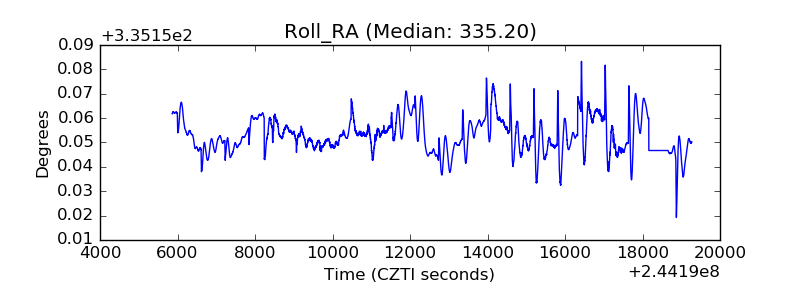 |
| Veto Counter | 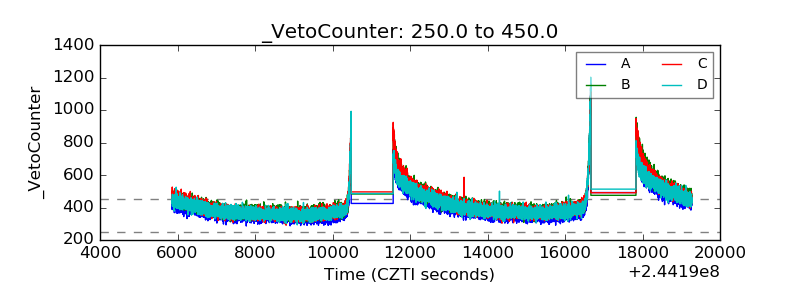 |