| Param | Original file | Final file |
|---|---|---|
| Filename | modeM0/AS1G07_053T01_9000001566cztM0_level2.fits | modeM0/AS1G07_053T01_9000001566cztM0_level2_quad_clean.evt |
| Size (bytes) | 230,981,760 | 185,253,120 |
| Size | 220.3 MB | 176.7 MB |
| Events in quadrant A | 1,277,528 | 914,011 |
| Events in quadrant B | 1,360,182 | 1,032,161 |
| Events in quadrant C | 1,428,566 | 1,042,855 |
| Events in quadrant D | 1,190,716 | 885,084 |
| Mode SS | |||
|---|---|---|---|
| Quadrant | BADHDUFLAG | Total packets | Discarded packets |
| A | 0 | 512 | 0 |
| B | 0 | 510 | 0 |
| C | 0 | 512 | 0 |
| D | 0 | 512 | 0 |
| Mode M9 | |||
|---|---|---|---|
| Quadrant | BADHDUFLAG | Total packets | Discarded packets |
| A | 0 | 55 | 0 |
| B | 0 | 55 | 0 |
| C | 0 | 55 | 0 |
| D | 0 | 55 | 0 |
| Mode M0 | |||
|---|---|---|---|
| Quadrant | BADHDUFLAG | Total packets | Discarded packets |
| A | 0 | 94046 | 0 |
| B | 0 | 76659 | 0 |
| C | 0 | 52542 | 0 |
| D | 0 | 74330 | 0 |
| Quadrant | Total seconds | Saturated seconds | Saturation percentage |
|---|---|---|---|
| A | 25221 | 5121 | 20.304508% |
| B | 25223 | 2328 | 9.229671% |
| C | 25227 | 198 | 0.784873% |
| D | 25225 | 1699 | 6.735382% |
Noise dominated data is calculated using 1-second bins in cleaned event files. If a bin has >2000 counts, and if more than 50% of those come from <1% of pixels, then it is considered to be noise-dominated and hence unusable.
| Quadrant | # 1 sec bins | Bins with >0 counts | Bins with >2000 counts | High rate bins dominated by noise | Noise dominated (total time) | Noise dominated (detector-on time) | Marked lightcurve |
|---|---|---|---|---|---|---|---|
| A | 30597 | 24893 | 0 | 0 | 0.00% | 0.00% | 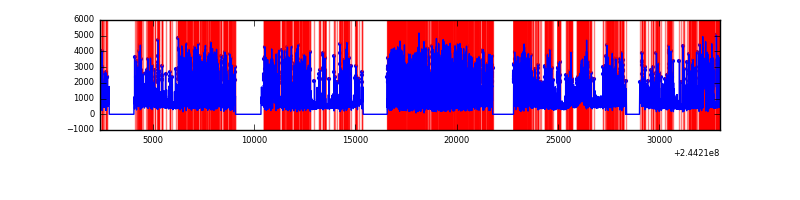 |
| B | 30597 | 25218 | 0 | 0 | 0.00% | 0.00% | 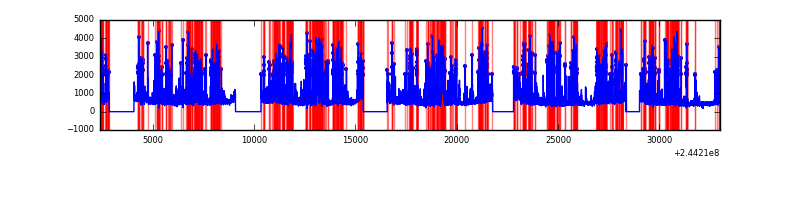 |
| C | 30597 | 25225 | 0 | 0 | 0.00% | 0.00% | 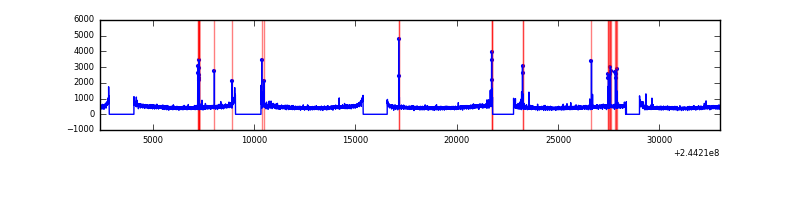 |
| D | 30597 | 25220 | 0 | 0 | 0.00% | 0.00% | 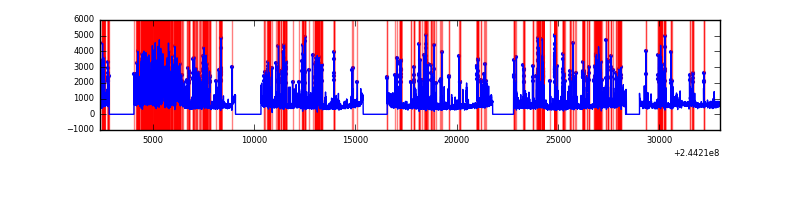 |
Top three noisy pixels from each quadrant. If the there are fewer than three noisy pixels in the level2.evt file, extra rows are filled as -1
| Pixel properties | Quadrant properties | ||||||
|---|---|---|---|---|---|---|---|
| Quadrant | DetID | PixID | Counts | Sigma | Mean | Median | Sigma |
| A | 0 | 29 | 1268 | 11.45 | 332 | 313 | 83.4 |
| A | 7 | 110 | 1077 | 9.16 | 332 | 313 | 83.4 |
| A | 9 | 19 | 977 | 7.96 | 332 | 313 | 83.4 |
| B | 2 | 9 | 1146 | 10.97 | 359 | 343 | 73.2 |
| B | 14 | 254 | 882 | 7.37 | 359 | 343 | 73.2 |
| B | 12 | 226 | 870 | 7.2 | 359 | 343 | 73.2 |
| C | 12 | 241 | 1004 | 6.52 | 377 | 351 | 100.1 |
| C | 9 | 233 | 974 | 6.22 | 377 | 351 | 100.1 |
| C | 2 | 191 | 966 | 6.14 | 377 | 351 | 100.1 |
| D | 3 | 14 | 949 | 6.97 | 339 | 309 | 91.8 |
| D | 6 | 231 | 870 | 6.11 | 339 | 309 | 91.8 |
| D | 10 | 189 | 853 | 5.93 | 339 | 309 | 91.8 |
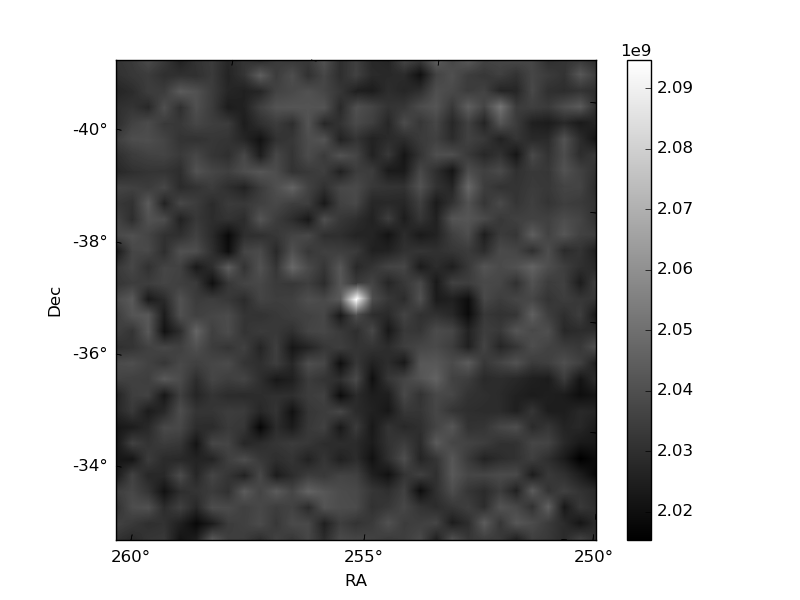
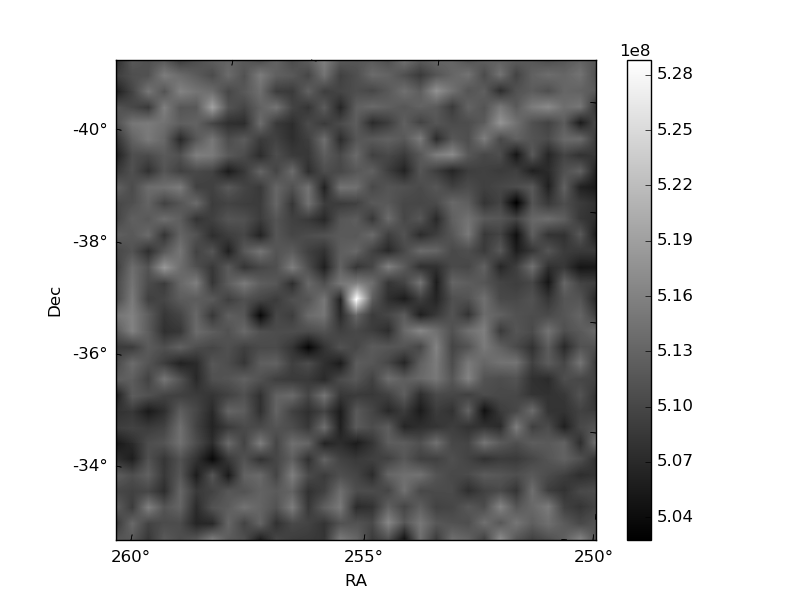
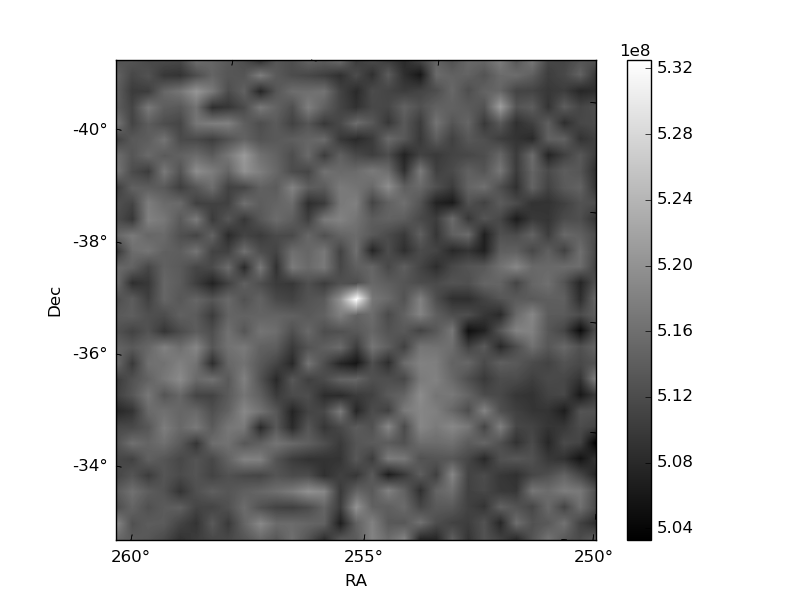
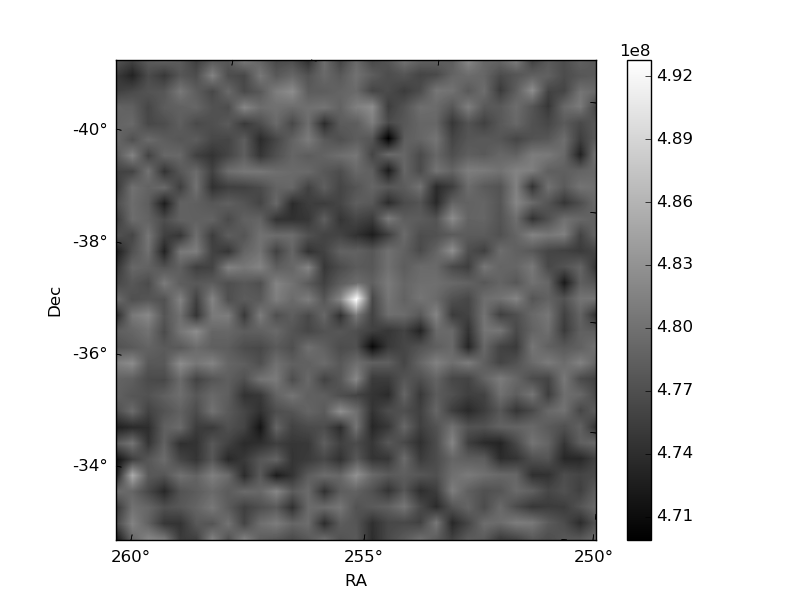
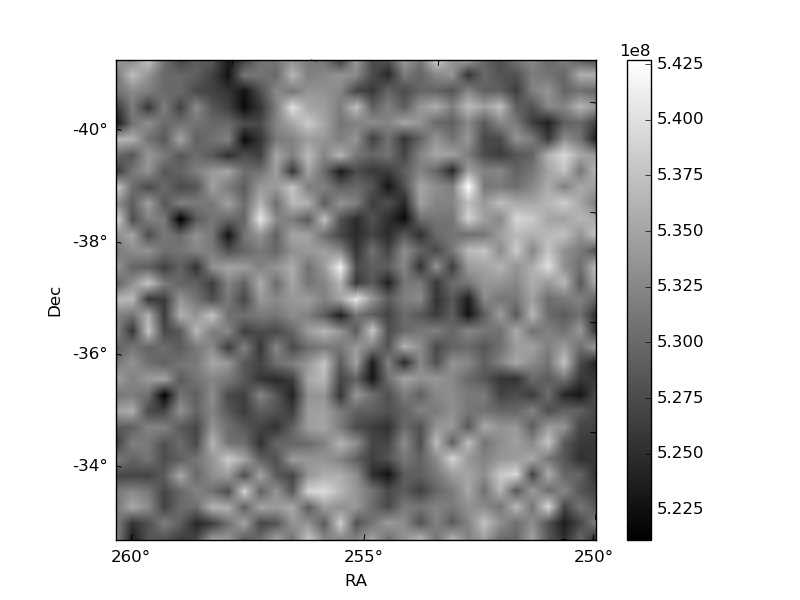
Histogram calculated using DETX and DETY for each event in the final _common_clean file
| Quadrant A | 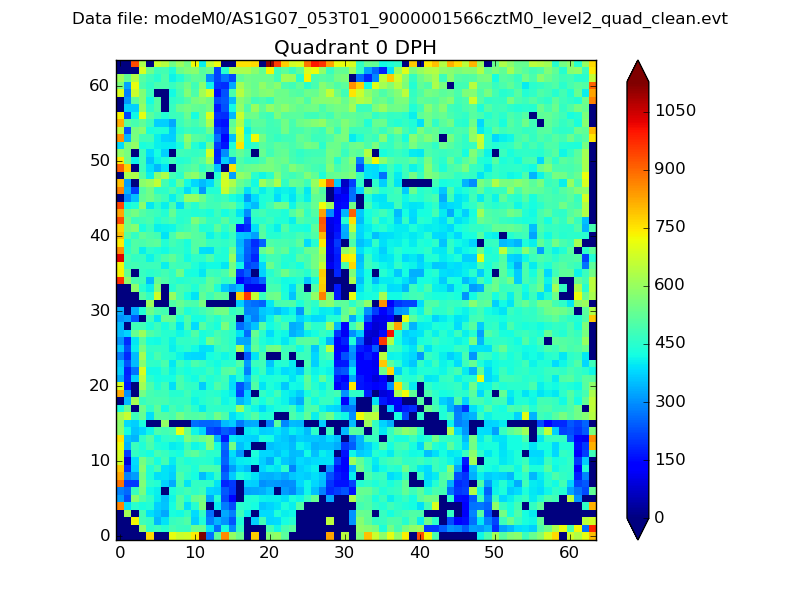 |
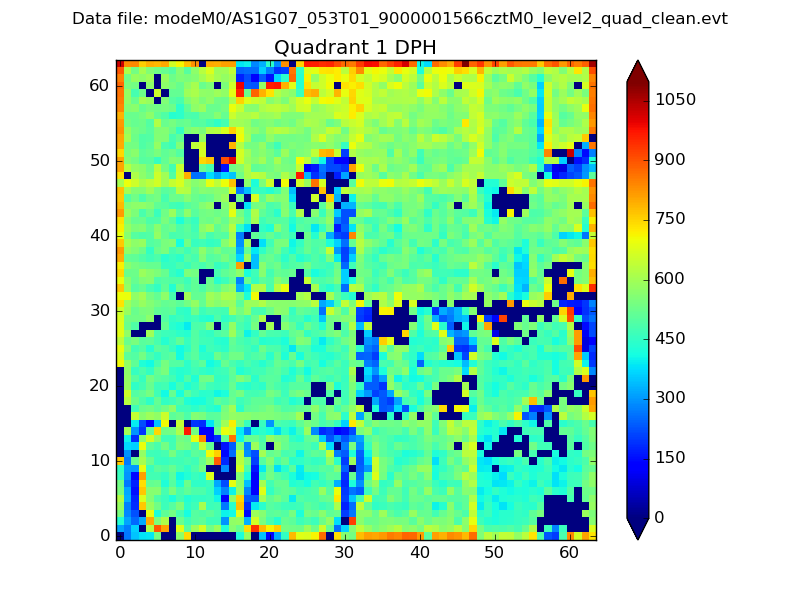 |
Quadrant B |
|---|---|---|---|
| Quadrant D | 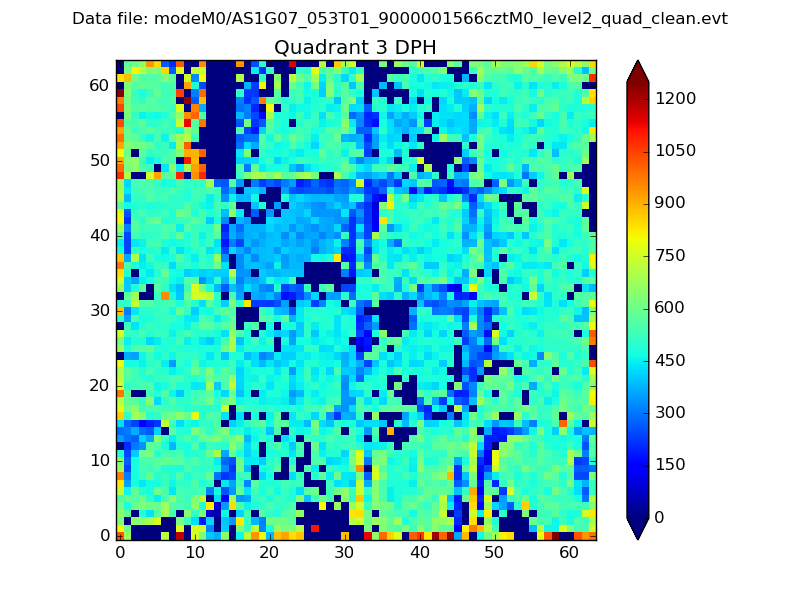 |
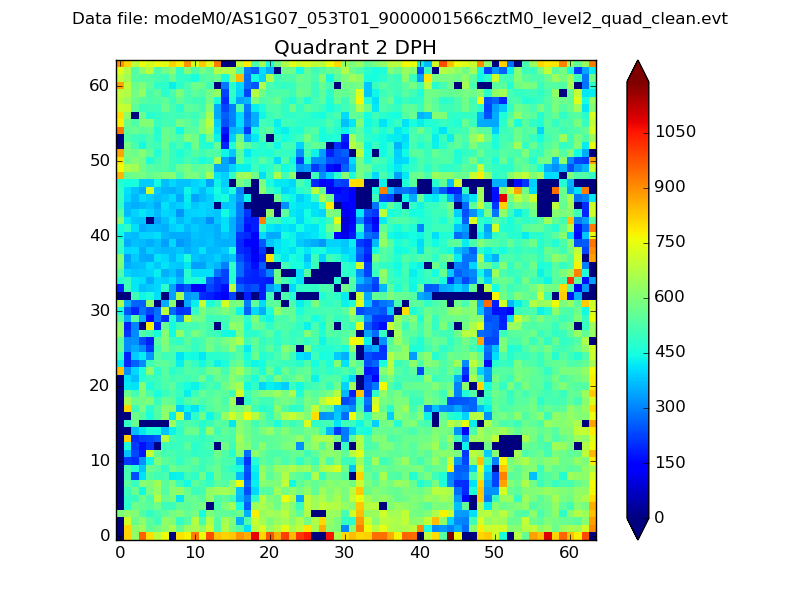 |
Quadrant C |
| Plot type | Count rate plots | Images |
|---|---|---|
| Comparison with Poisson distribution Blue bars denote a histogram of data divided into 1 sec bins. Red curve is a Poisson curve with rate = median count rate of data. |
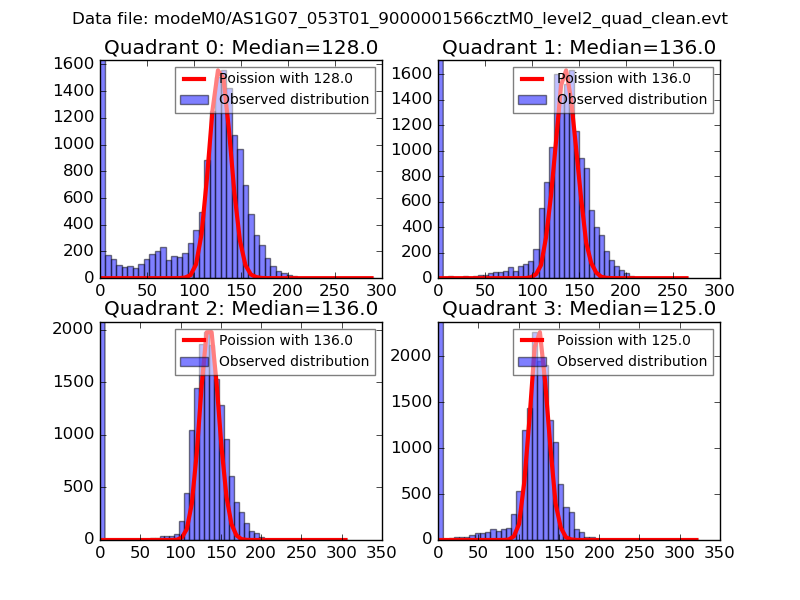 |
 |
| Quadrant-wise count rates Data is divided into 100 sec bins |
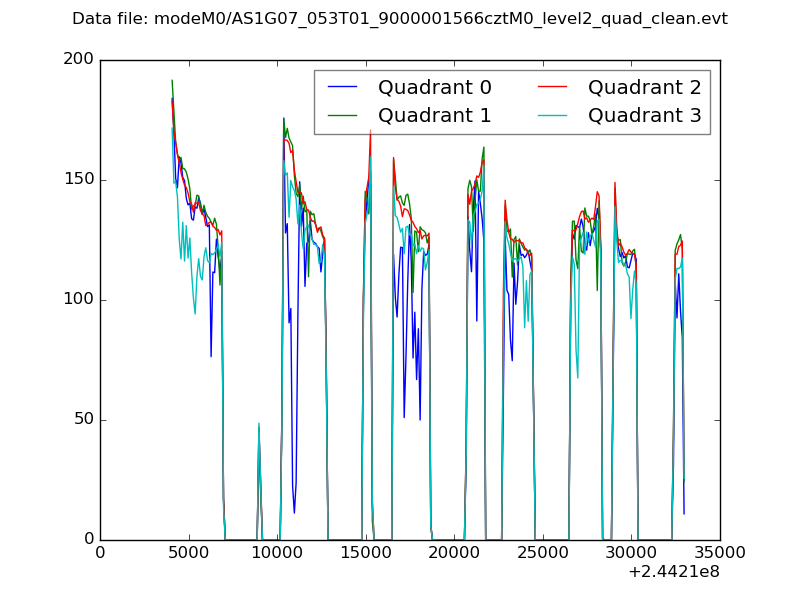 |
|
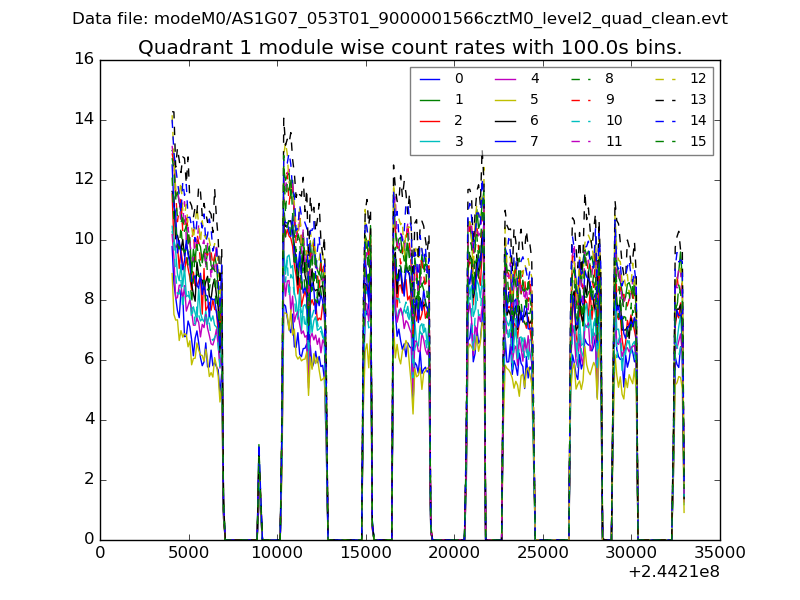
| Module-wise count rates for Quadrant A Data is divided into 100 sec bins |
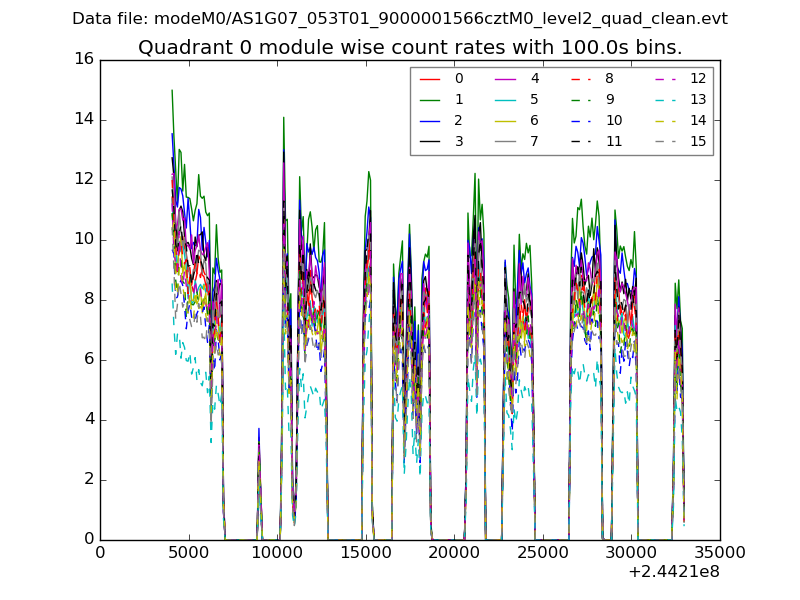 |
 |
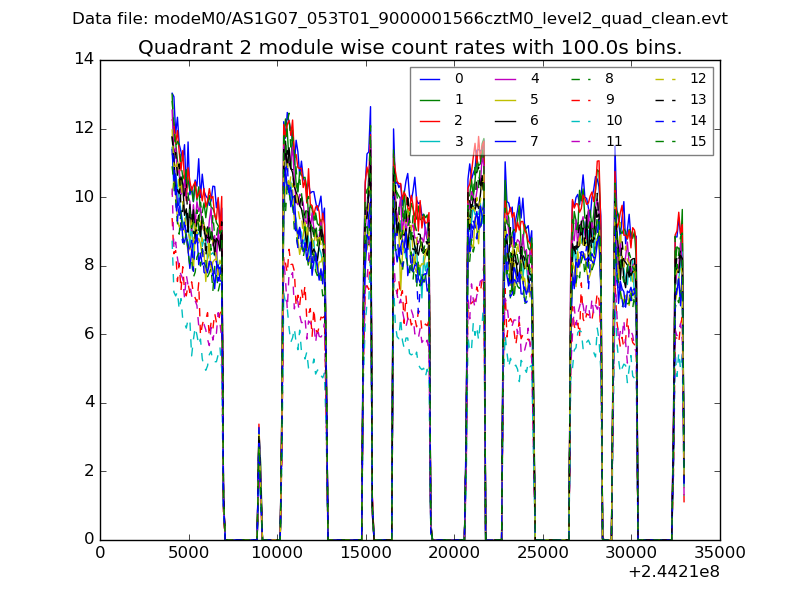
| Module-wise count rates for Quadrant B Data is divided into 100 sec bins |
 |
 |
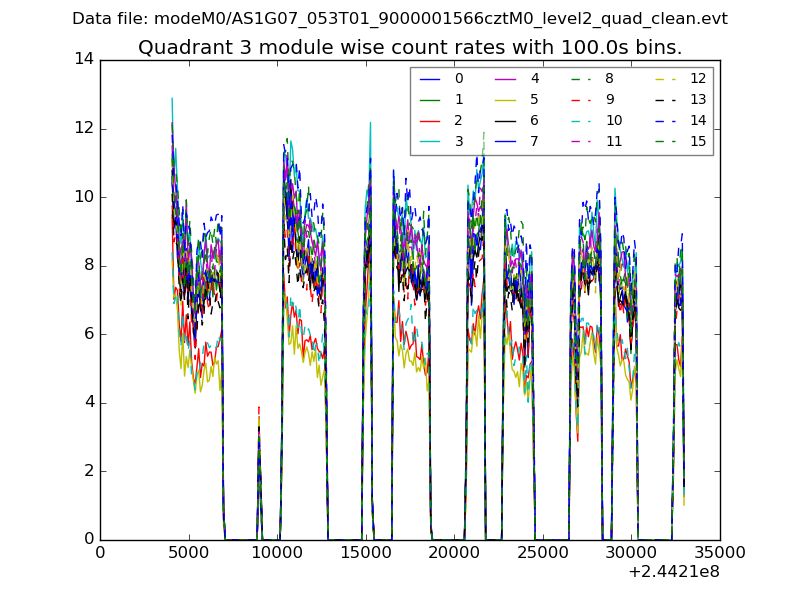
| Module-wise count rates for Quadrant C Data is divided into 100 sec bins |
 |
 |
| Module-wise count rates for Quadrant D Data is divided into 100 sec bins |
 |
 |
| Parameter | Plot |
|---|---|
| CZT HV Monitor | 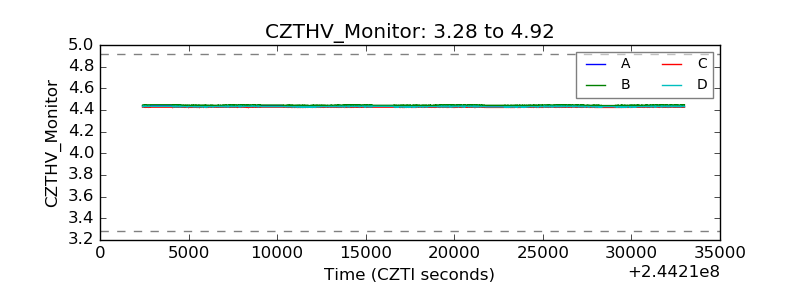 |
| D_VDD | 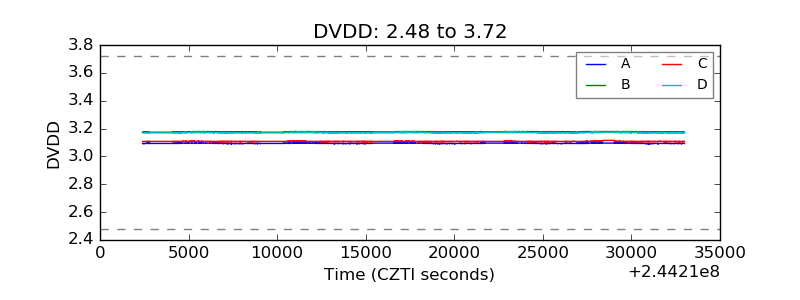 |
| Temperature 1 | 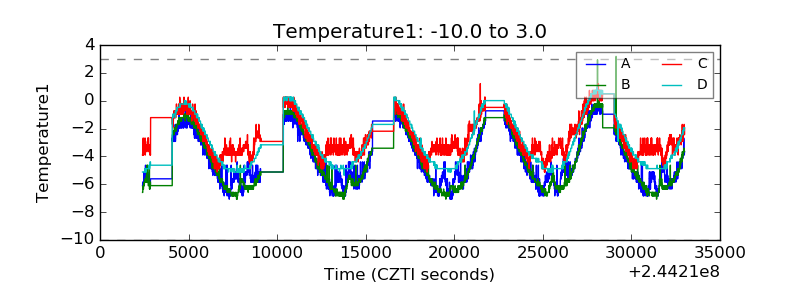 |
| Veto HV Monitor | 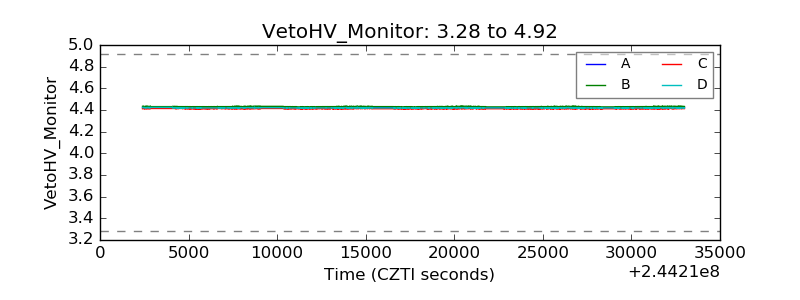 |
| Veto LLD | 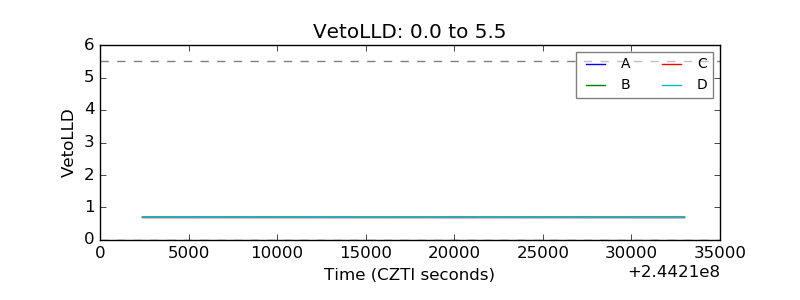 |
| Alpha Counter | 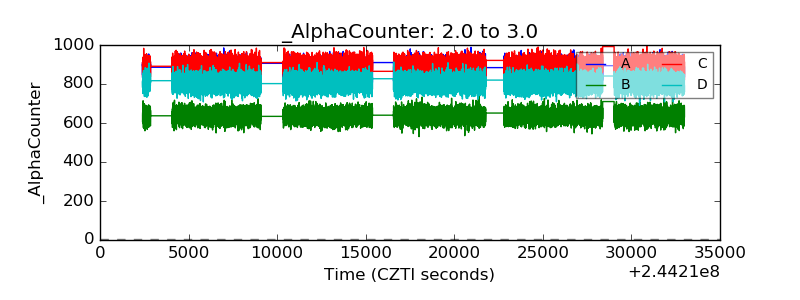 |
| _CPM_Rate | 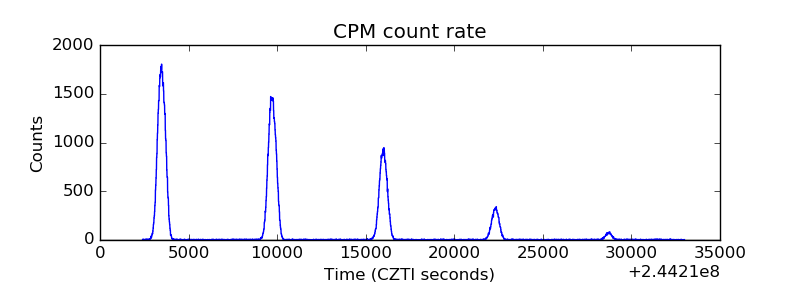 |
| CZT Counter | 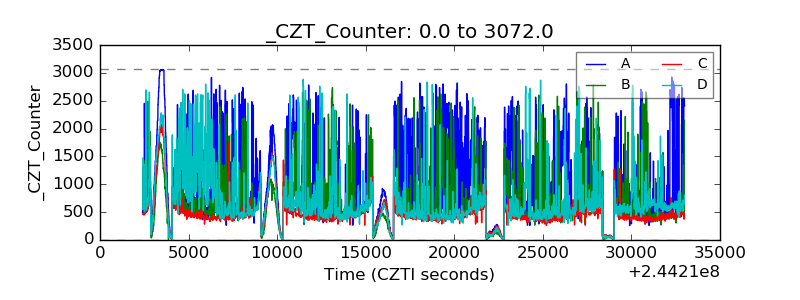 |
| +2.5 Volts monitor | 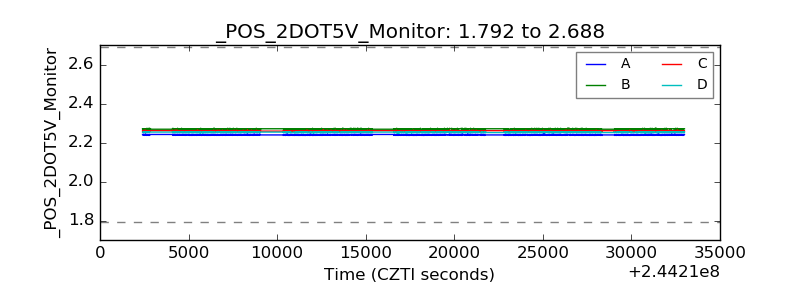 |
| +5 Volts monitor | 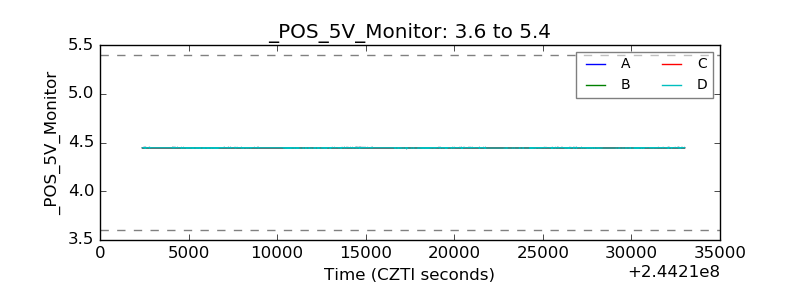 |
| _ROLL_ROT | 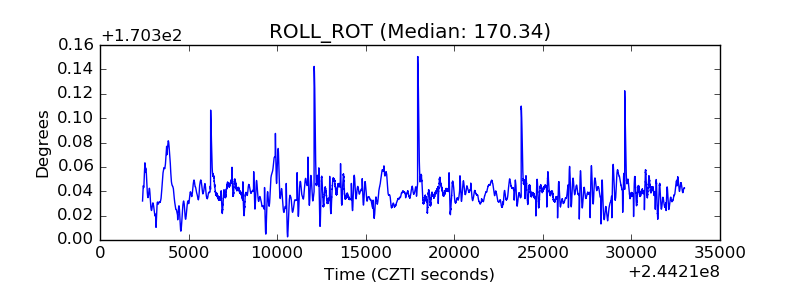 |
| _Roll_DEC | 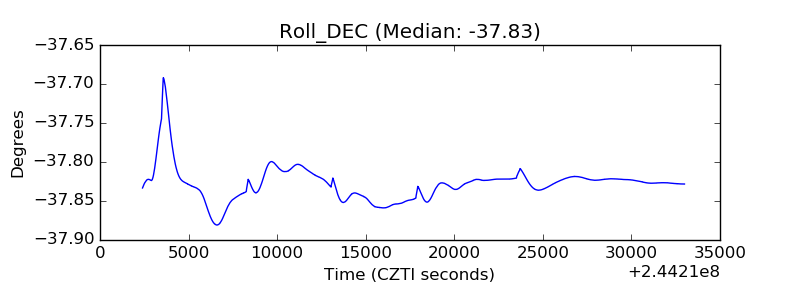 |
| _Roll_RA | 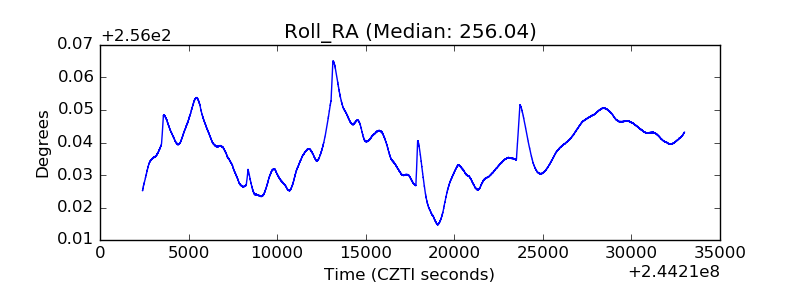 |
| Veto Counter | 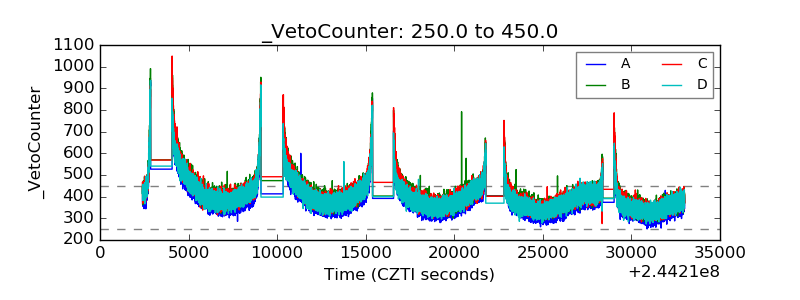 |