| Param | Original file | Final file |
|---|---|---|
| Filename | modeM0/AS1G07_053T01_9000001566_10811cztM0_level2.evt | modeM0/AS1G07_053T01_9000001566_10811cztM0_level2_quad_clean.evt |
| Size (bytes) | 237,934,080 | 34,499,520 |
| Size | 226.9 MB | 32.9 MB |
| Events in quadrant A | 1,684,115 | 229,903 |
| Events in quadrant B | 1,586,602 | 239,967 |
| Events in quadrant C | 1,064,678 | 233,752 |
| Events in quadrant D | 2,733,024 | 195,292 |
| Mode SS | |||
|---|---|---|---|
| Quadrant | BADHDUFLAG | Total packets | Discarded packets |
| A | 0 | 42 | 0 |
| B | 0 | 42 | 0 |
| C | 0 | 42 | 0 |
| D | 0 | 42 | 0 |
| Mode M9 | |||
|---|---|---|---|
| Quadrant | BADHDUFLAG | Total packets | Discarded packets |
| A | 0 | 12 | 0 |
| B | 0 | 12 | 0 |
| C | 0 | 12 | 0 |
| D | 0 | 12 | 0 |
| Mode M0 | |||
|---|---|---|---|
| Quadrant | BADHDUFLAG | Total packets | Discarded packets |
| A | 0 | 6391 | 2 |
| B | 0 | 6055 | 1 |
| C | 0 | 4381 | 1 |
| D | 0 | 9551 | 1 |
| Quadrant | Total seconds | Saturated seconds | Saturation percentage |
|---|---|---|---|
| A | 1998 | 223 | 11.161161% |
| B | 1998 | 196 | 9.809810% |
| C | 1998 | 51 | 2.552553% |
| D | 1998 | 575 | 28.778779% |
Noise dominated data is calculated using 1-second bins in cleaned event files. If a bin has >2000 counts, and if more than 50% of those come from <1% of pixels, then it is considered to be noise-dominated and hence unusable.
| Quadrant | # 1 sec bins | Bins with >0 counts | Bins with >2000 counts | High rate bins dominated by noise | Noise dominated (total time) | Noise dominated (detector-on time) | Marked lightcurve |
|---|---|---|---|---|---|---|---|
| A | 3218 | 1998 | 101 | 101 | 3.14% | 5.06% | 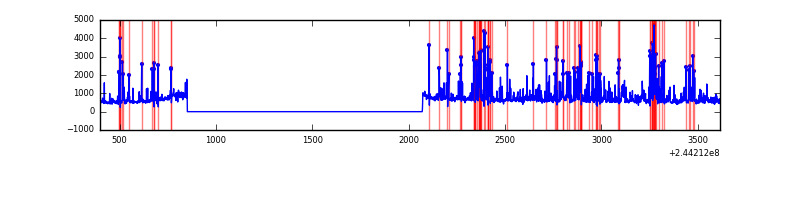 |
| B | 3218 | 1999 | 76 | 76 | 2.36% | 3.80% | 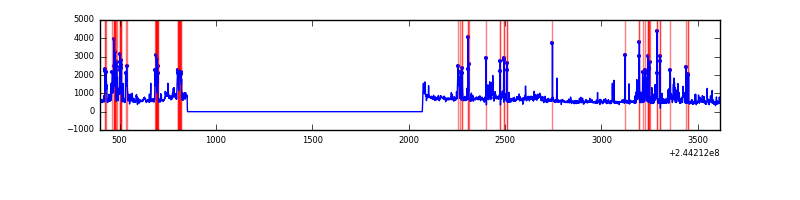 |
| C | 3218 | 1999 | 0 | 0 | 0.00% | 0.00% | 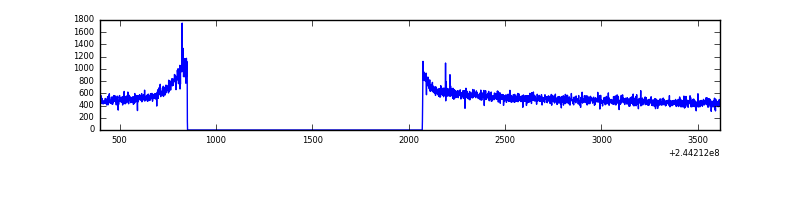 |
| D | 3218 | 1999 | 434 | 434 | 13.49% | 21.71% | 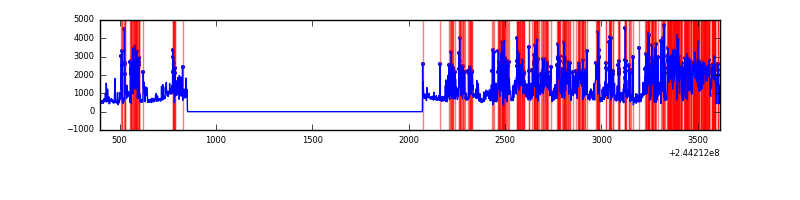 |
Top three noisy pixels from each quadrant. If the there are fewer than three noisy pixels in the level2.evt file, extra rows are filled as -1
| Pixel properties | Quadrant properties | ||||||
|---|---|---|---|---|---|---|---|
| Quadrant | DetID | PixID | Counts | Sigma | Mean | Median | Sigma |
| A | 8 | 5 | 581107 | 9864.85 | 279 | 273 | 58.9 |
| A | 4 | 2 | 20460 | 342.85 | 279 | 273 | 58.9 |
| A | 15 | 174 | 4674 | 74.75 | 279 | 273 | 58.9 |
| B | 4 | 239 | 256739 | 4780.45 | 273 | 266 | 53.7 |
| B | 15 | 204 | 186934 | 3479.34 | 273 | 266 | 53.7 |
| B | 0 | 219 | 50753 | 941.04 | 273 | 266 | 53.7 |
| C | 14 | 234 | 3581 | 51.78 | 271 | 272 | 63.9 |
| C | 13 | 61 | 2098 | 28.58 | 271 | 272 | 63.9 |
| C | 8 | 222 | 1135 | 13.51 | 271 | 272 | 63.9 |
| D | 4 | 95 | 959587 | 15590.98 | 252 | 245 | 61.5 |
| D | 10 | 199 | 219682 | 3566.23 | 252 | 245 | 61.5 |
| D | 10 | 253 | 204159 | 3313.96 | 252 | 245 | 61.5 |
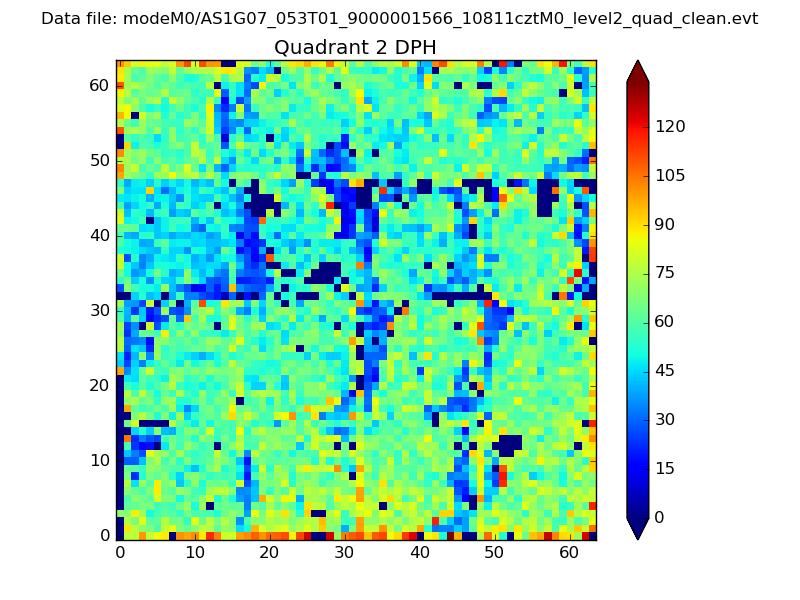
Histogram calculated using DETX and DETY for each event in the final _common_clean file
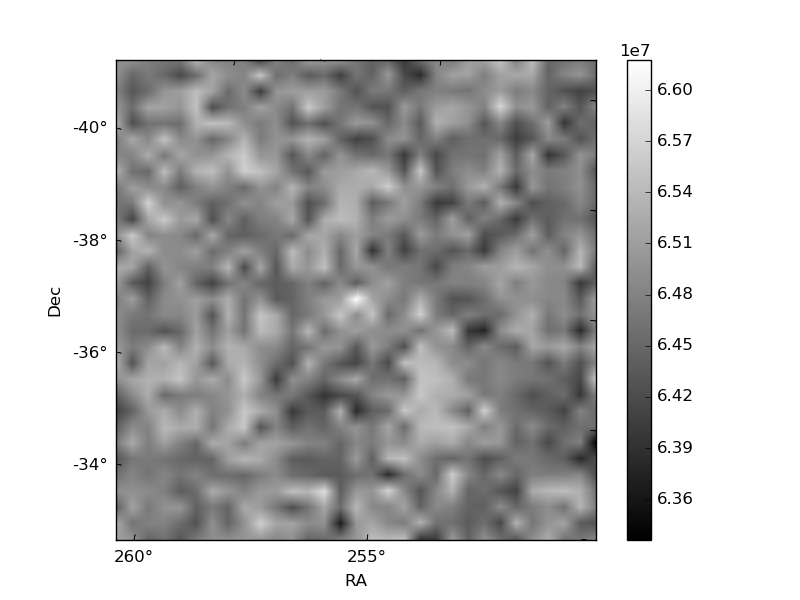
| Quadrant A | 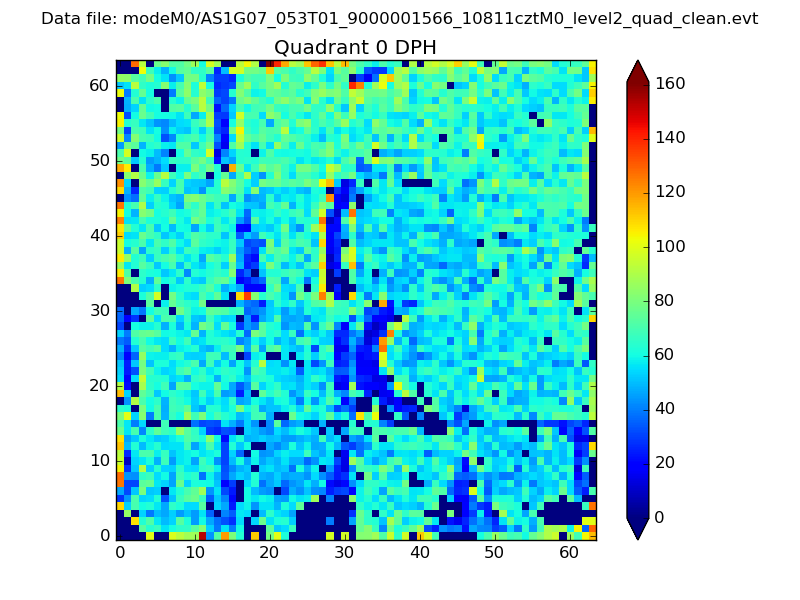 |
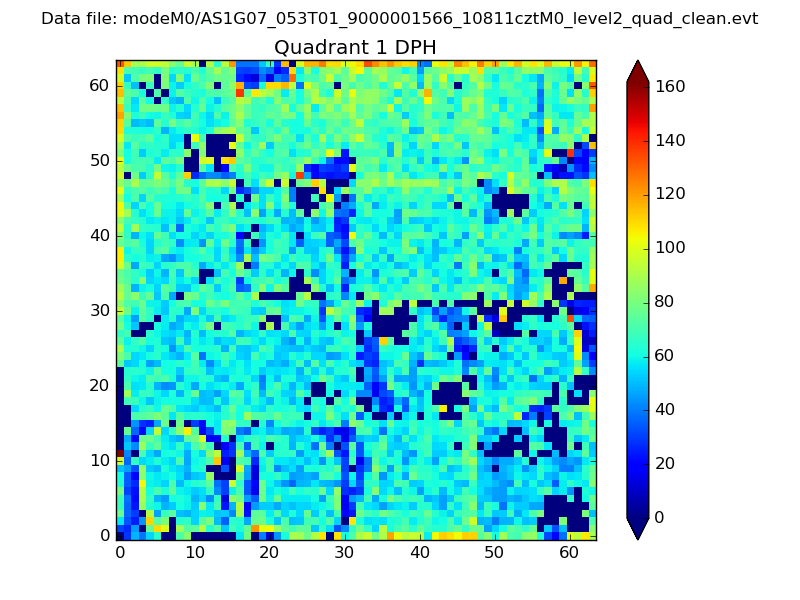 |
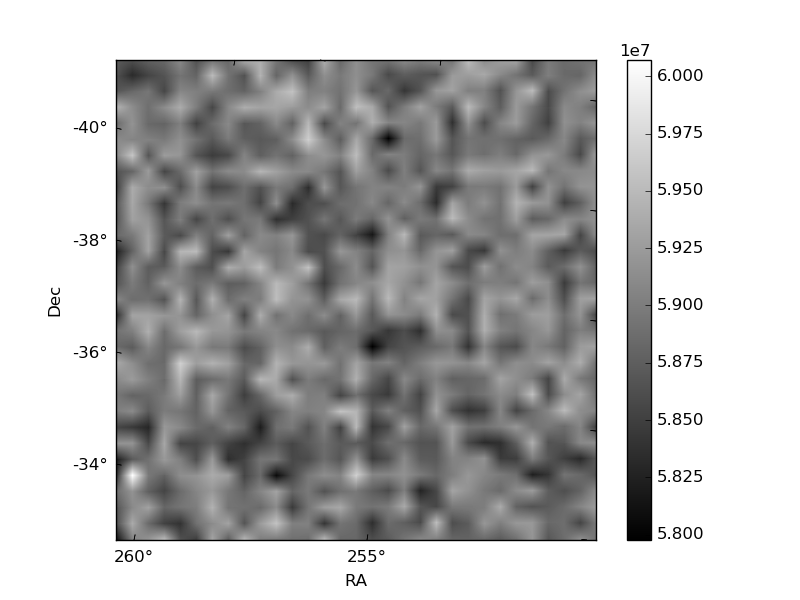
Quadrant B |
|---|---|---|---|
| Quadrant D | 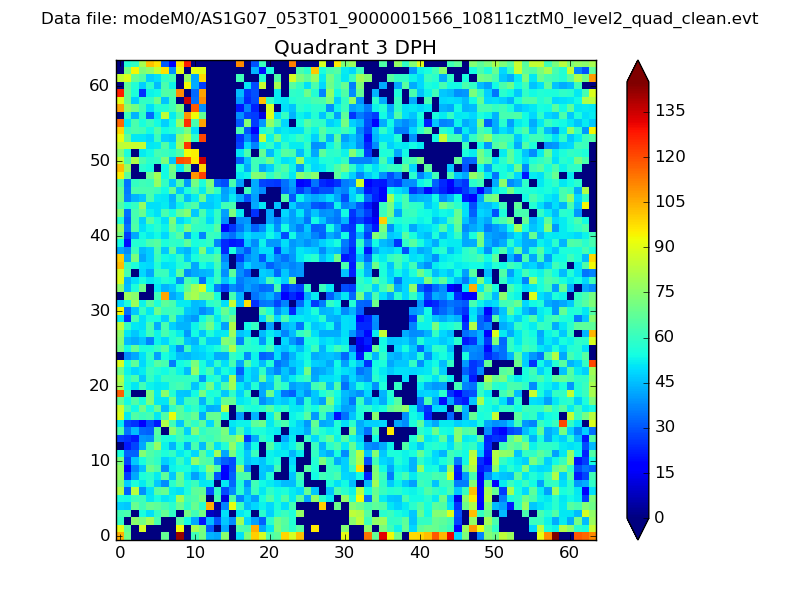 |
 |
Quadrant C |
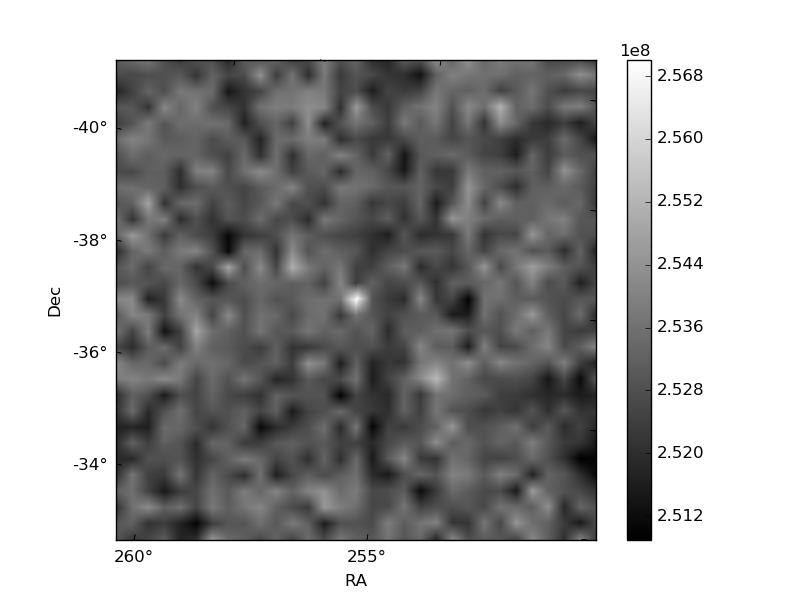
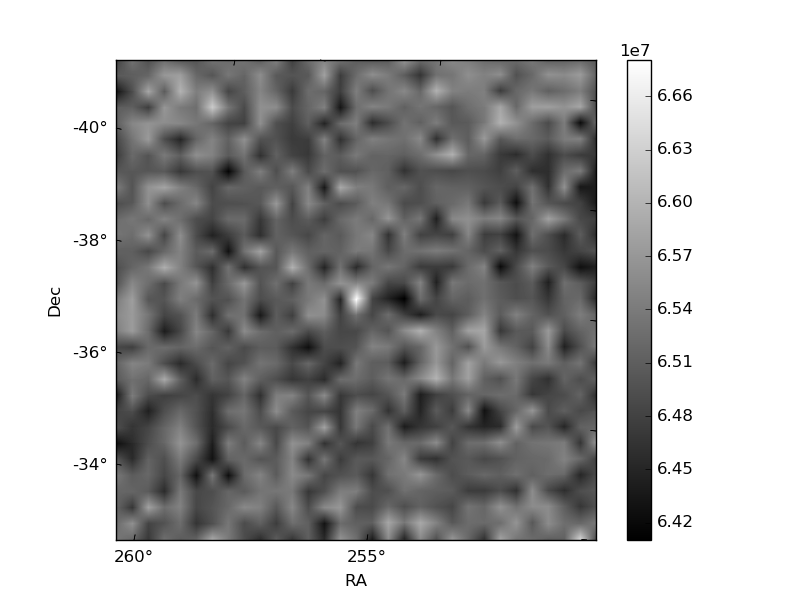
| Plot type | Count rate plots | Images |
|---|---|---|
| Comparison with Poisson distribution Blue bars denote a histogram of data divided into 1 sec bins. Red curve is a Poisson curve with rate = median count rate of data. |
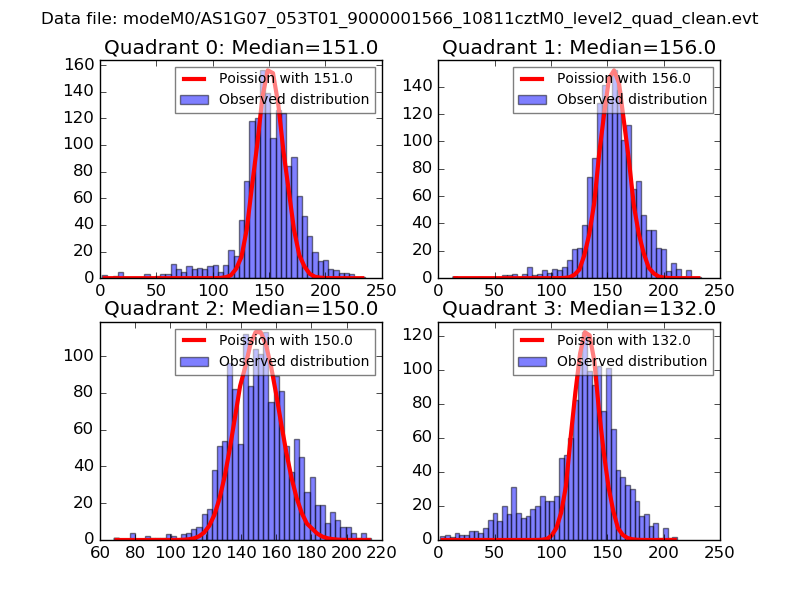 |
 |
| Quadrant-wise count rates Data is divided into 100 sec bins |
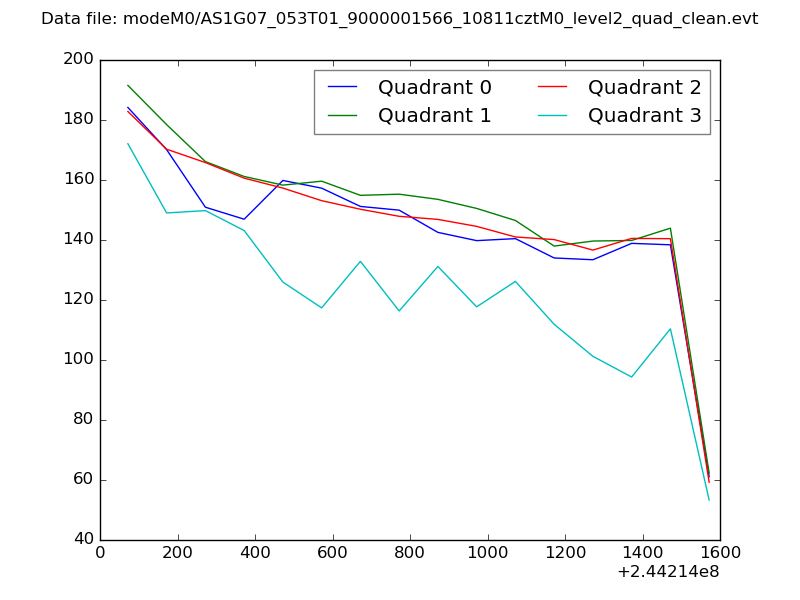 |
|
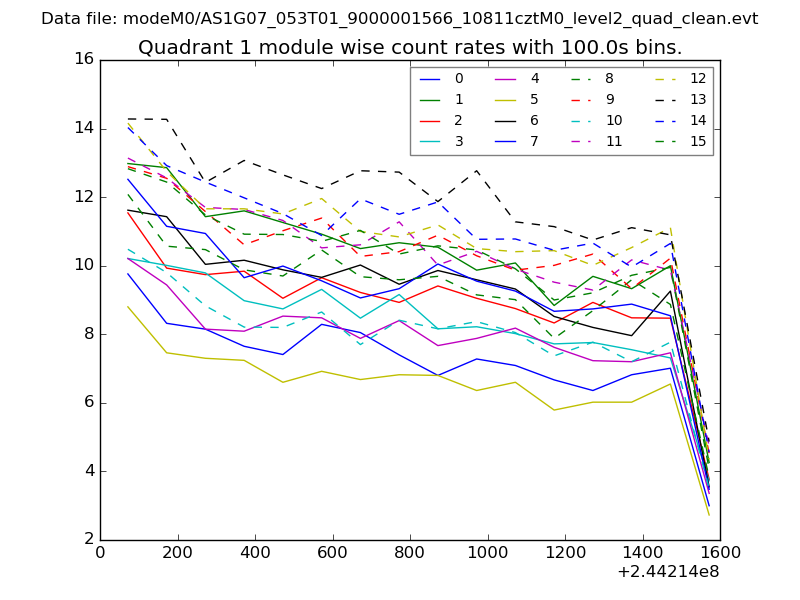
| Module-wise count rates for Quadrant A Data is divided into 100 sec bins |
 |
 |
| Module-wise count rates for Quadrant B Data is divided into 100 sec bins |
 |
 |
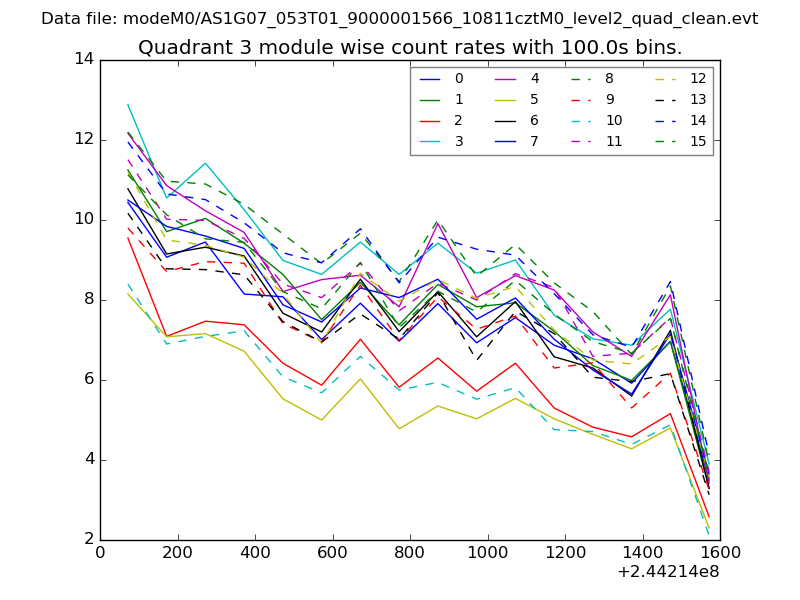
| Module-wise count rates for Quadrant C Data is divided into 100 sec bins |
 |
 |
| Module-wise count rates for Quadrant D Data is divided into 100 sec bins |
 |
 |
| Parameter | Plot |
|---|---|
| CZT HV Monitor |  |
| D_VDD | 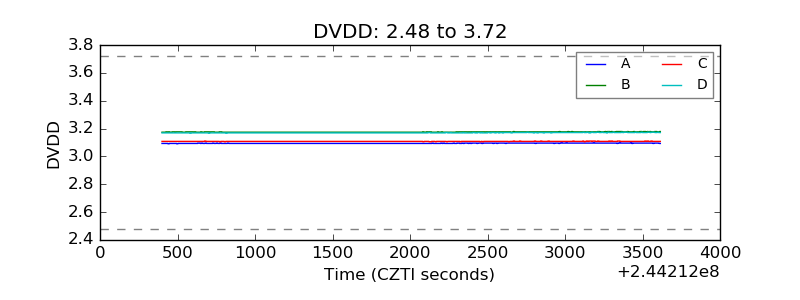 |
| Temperature 1 | 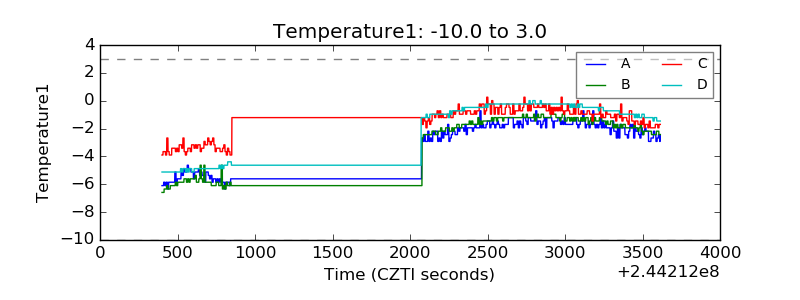 |
| Veto HV Monitor | 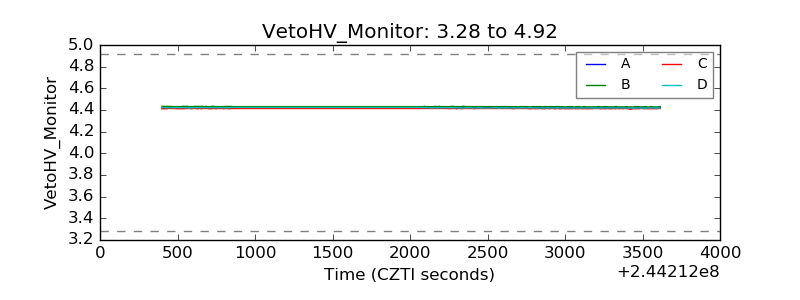 |
| Veto LLD | 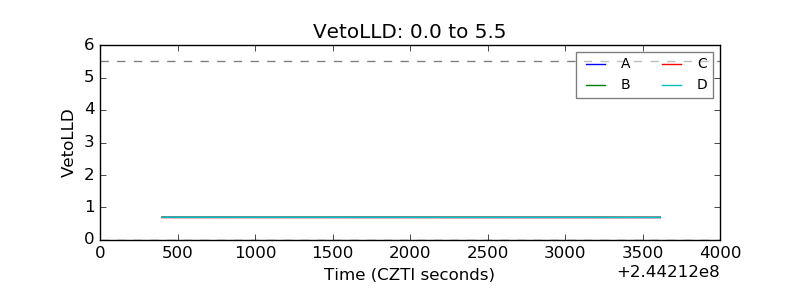 |
| Alpha Counter | 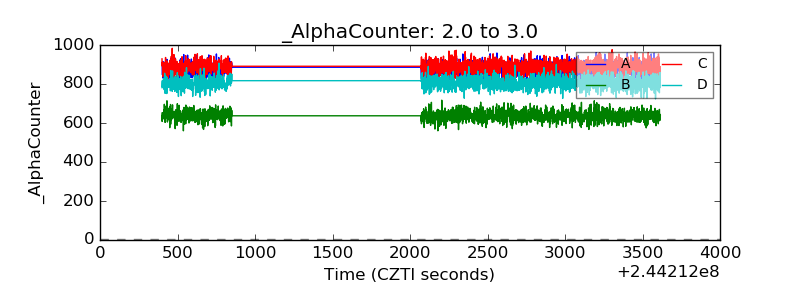 |
| _CPM_Rate | 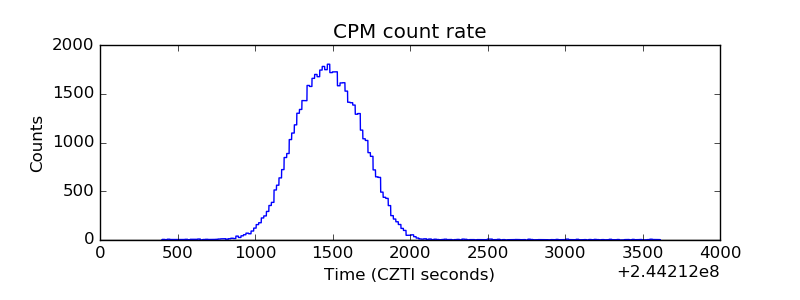 |
| CZT Counter | 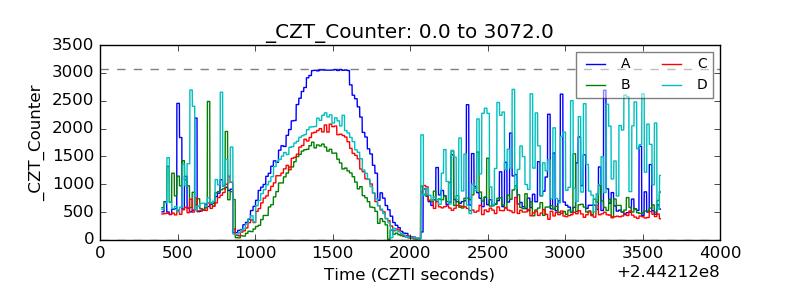 |
| +2.5 Volts monitor |  |
| +5 Volts monitor |  |
| _ROLL_ROT | 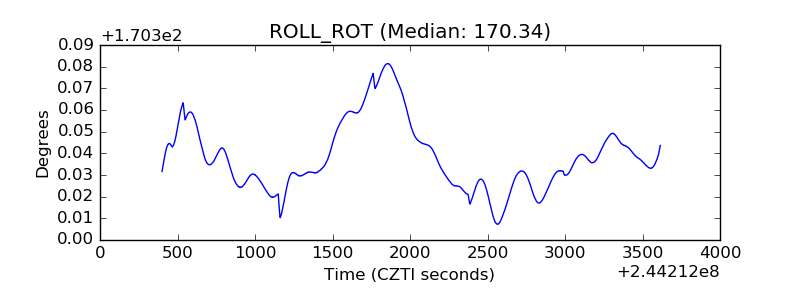 |
| _Roll_DEC | 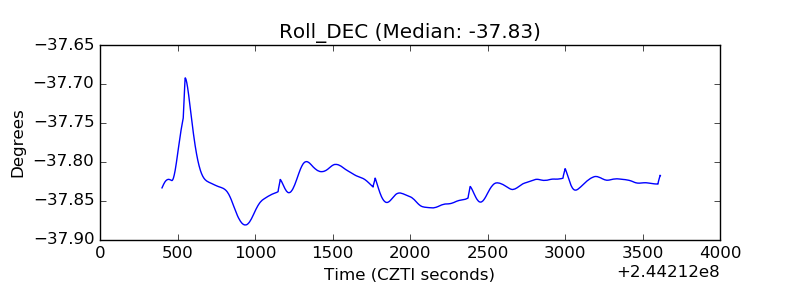 |
| _Roll_RA | 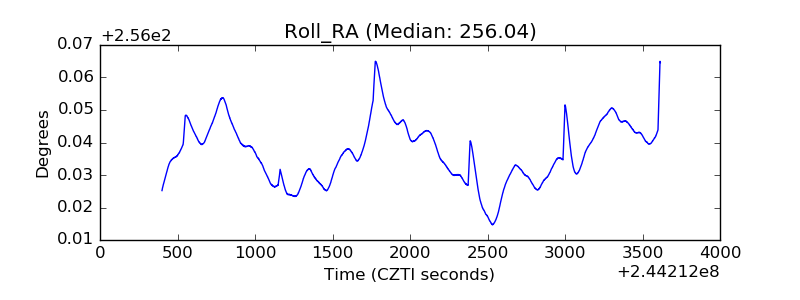 |
| Veto Counter | 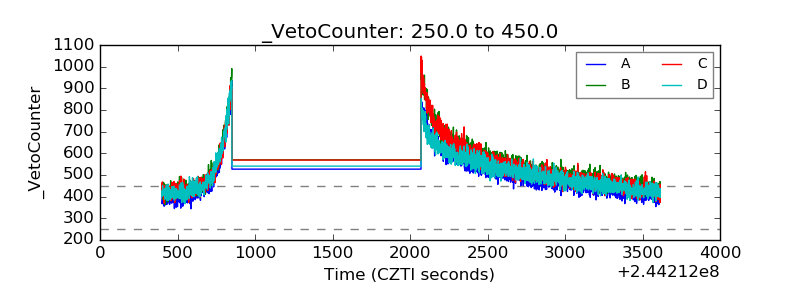 |