| Param | Original file | Final file |
|---|---|---|
| Filename | modeM0/AS1G07_053T01_9000001566_10812cztM0_level2.evt | modeM0/AS1G07_053T01_9000001566_10812cztM0_level2_quad_clean.evt |
| Size (bytes) | 631,221,120 | 76,337,280 |
| Size | 602.0 MB | 72.8 MB |
| Events in quadrant A | 6,043,426 | 426,556 |
| Events in quadrant B | 4,586,470 | 516,614 |
| Events in quadrant C | 2,710,903 | 514,839 |
| Events in quadrant D | 5,393,488 | 457,435 |
| Mode SS | |||
|---|---|---|---|
| Quadrant | BADHDUFLAG | Total packets | Discarded packets |
| A | 0 | 114 | 0 |
| B | 0 | 114 | 0 |
| C | 0 | 114 | 0 |
| D | 0 | 114 | 0 |
| Mode M9 | |||
|---|---|---|---|
| Quadrant | BADHDUFLAG | Total packets | Discarded packets |
| A | 0 | 13 | 0 |
| B | 0 | 13 | 0 |
| C | 0 | 13 | 0 |
| D | 0 | 13 | 0 |
| Mode M0 | |||
|---|---|---|---|
| Quadrant | BADHDUFLAG | Total packets | Discarded packets |
| A | 0 | 21764 | 2 |
| B | 0 | 17388 | 1 |
| C | 0 | 11915 | 1 |
| D | 0 | 19834 | 1 |
| Quadrant | Total seconds | Saturated seconds | Saturation percentage |
|---|---|---|---|
| A | 5656 | 1331 | 23.532532% |
| B | 5656 | 446 | 7.885431% |
| C | 5656 | 67 | 1.184583% |
| D | 5656 | 642 | 11.350778% |
Noise dominated data is calculated using 1-second bins in cleaned event files. If a bin has >2000 counts, and if more than 50% of those come from <1% of pixels, then it is considered to be noise-dominated and hence unusable.
| Quadrant | # 1 sec bins | Bins with >0 counts | Bins with >2000 counts | High rate bins dominated by noise | Noise dominated (total time) | Noise dominated (detector-on time) | Marked lightcurve |
|---|---|---|---|---|---|---|---|
| A | 6916 | 5657 | 828 | 828 | 11.97% | 14.64% | 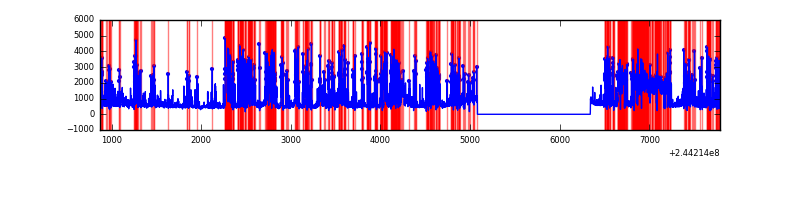 |
| B | 6916 | 5657 | 284 | 284 | 4.11% | 5.02% | 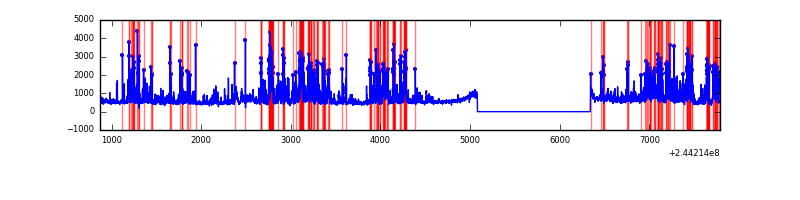 |
| C | 6916 | 5657 | 11 | 11 | 0.16% | 0.19% | 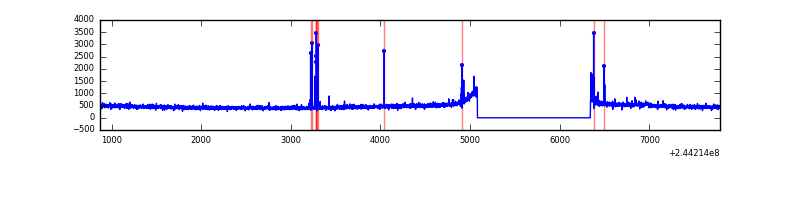 |
| D | 6916 | 5657 | 595 | 595 | 8.60% | 10.52% | 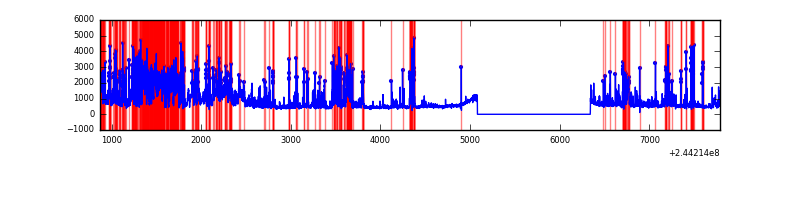 |
Top three noisy pixels from each quadrant. If the there are fewer than three noisy pixels in the level2.evt file, extra rows are filled as -1
| Pixel properties | Quadrant properties | ||||||
|---|---|---|---|---|---|---|---|
| Quadrant | DetID | PixID | Counts | Sigma | Mean | Median | Sigma |
| A | 8 | 5 | 3601588 | 28575.92 | 610 | 600 | 126.0 |
| A | 4 | 2 | 50505 | 396.02 | 610 | 600 | 126.0 |
| A | 15 | 174 | 20434 | 157.39 | 610 | 600 | 126.0 |
| B | 4 | 239 | 1172215 | 8895.31 | 694 | 680 | 131.7 |
| B | 15 | 204 | 560759 | 4252.61 | 694 | 680 | 131.7 |
| B | 0 | 219 | 85368 | 643.02 | 694 | 680 | 131.7 |
| C | 14 | 234 | 68539 | 437.64 | 674 | 679 | 155.1 |
| C | 0 | 207 | 10646 | 64.28 | 674 | 679 | 155.1 |
| C | 13 | 61 | 5118 | 28.63 | 674 | 679 | 155.1 |
| D | 13 | 138 | 974453 | 6196.42 | 650 | 635 | 157.2 |
| D | 4 | 95 | 531907 | 3380.49 | 650 | 635 | 157.2 |
| D | 10 | 199 | 409845 | 2603.81 | 650 | 635 | 157.2 |
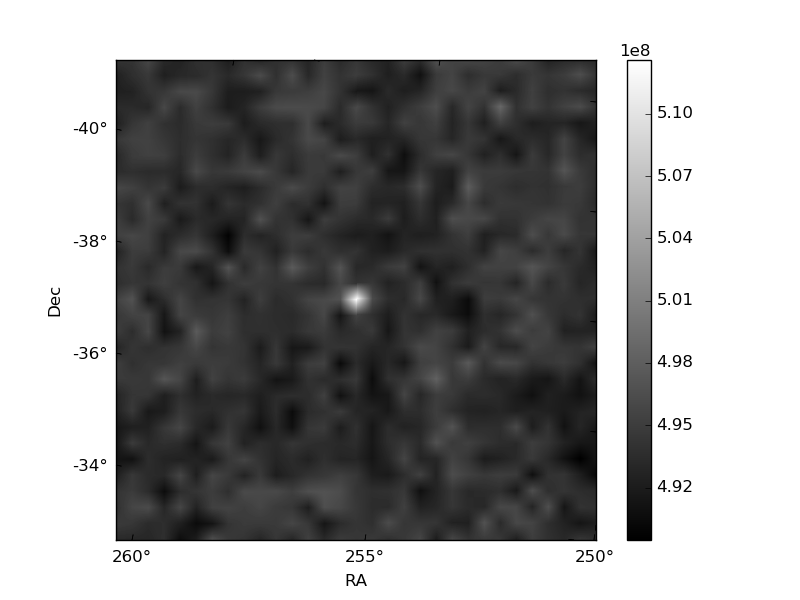
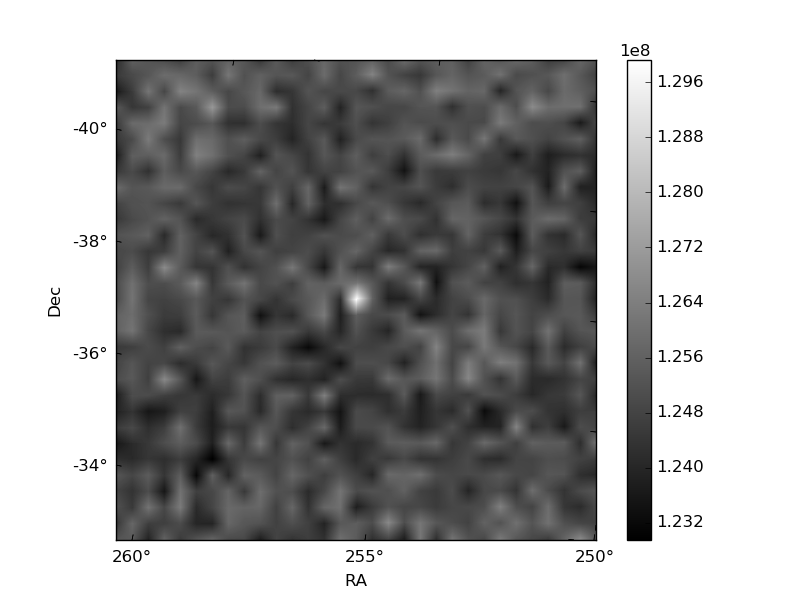
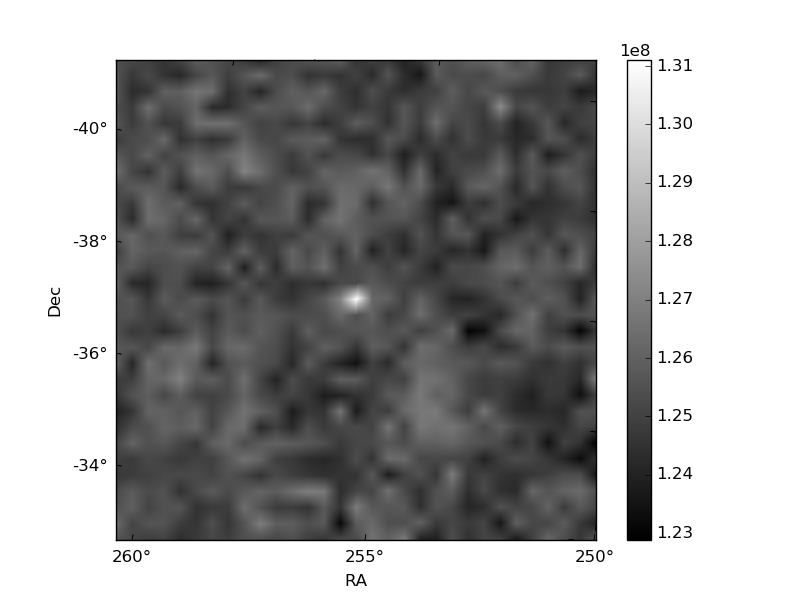
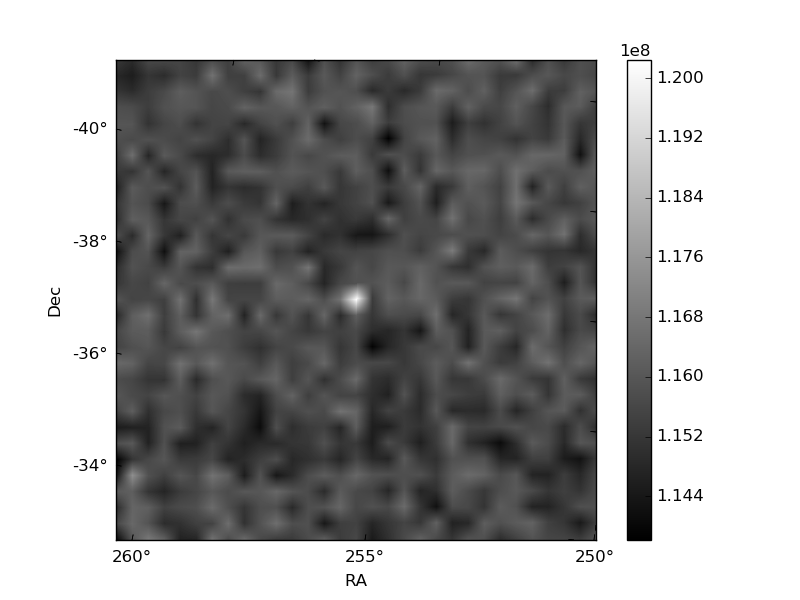
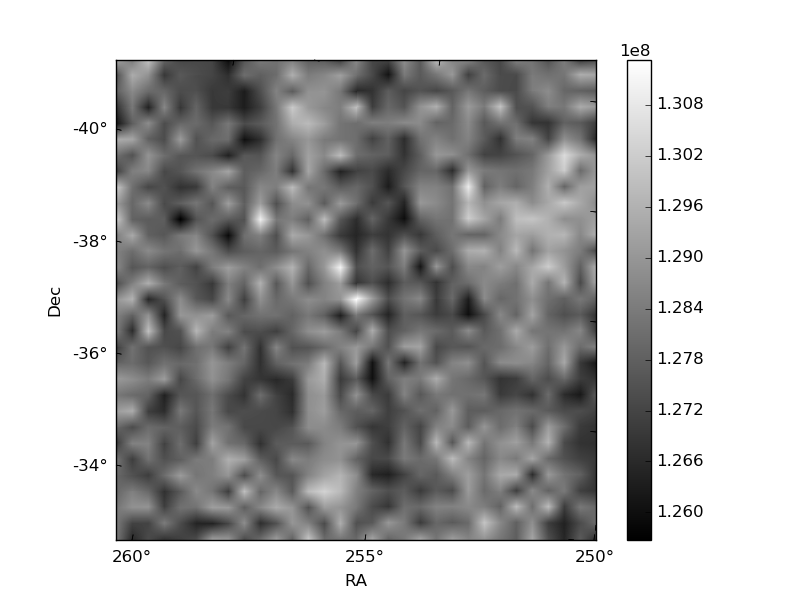
Histogram calculated using DETX and DETY for each event in the final _common_clean file
| Quadrant A | 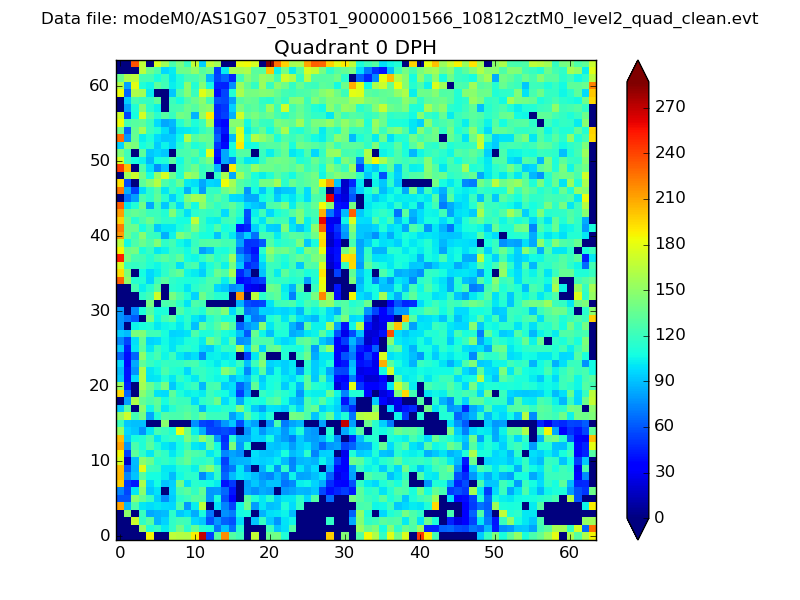 |
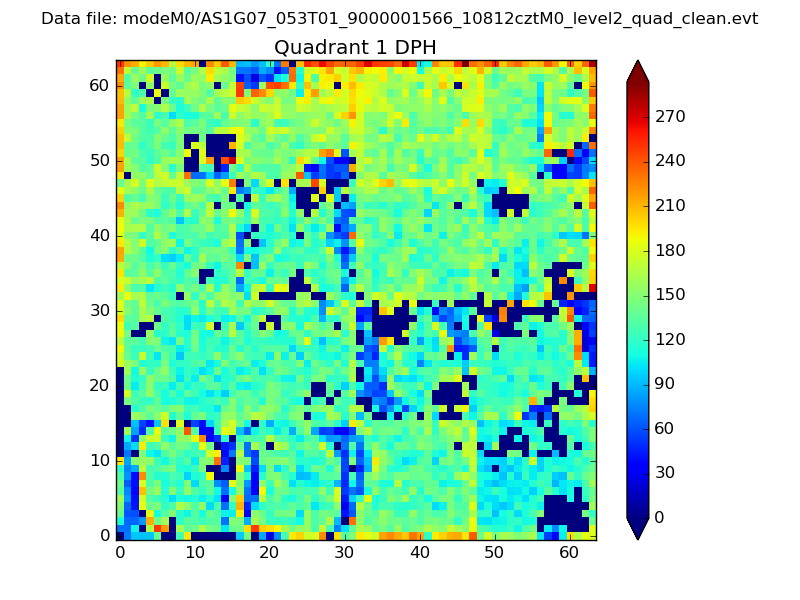 |
Quadrant B |
|---|---|---|---|
| Quadrant D | 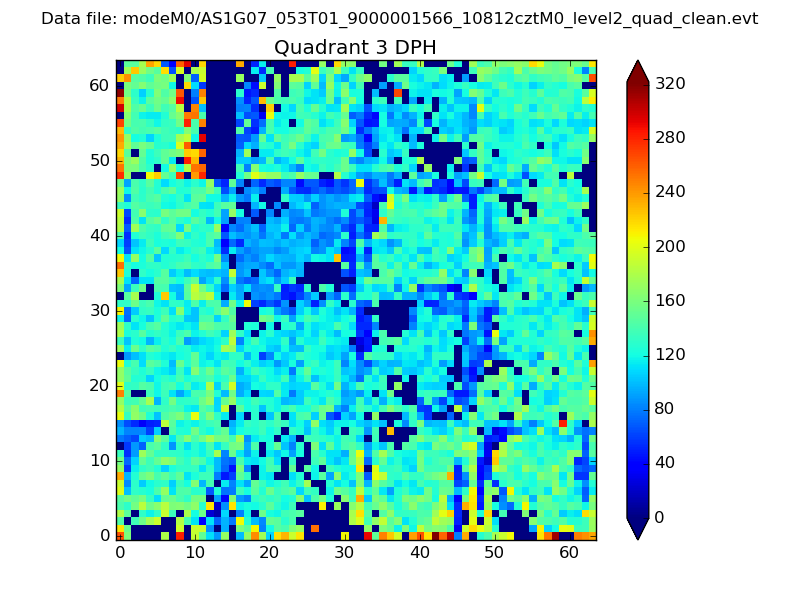 |
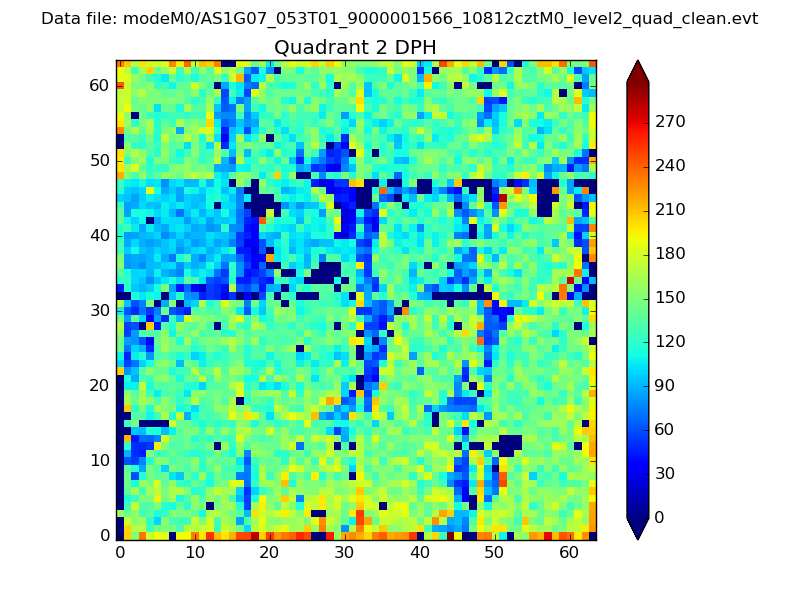 |
Quadrant C |
| Plot type | Count rate plots | Images |
|---|---|---|
| Comparison with Poisson distribution Blue bars denote a histogram of data divided into 1 sec bins. Red curve is a Poisson curve with rate = median count rate of data. |
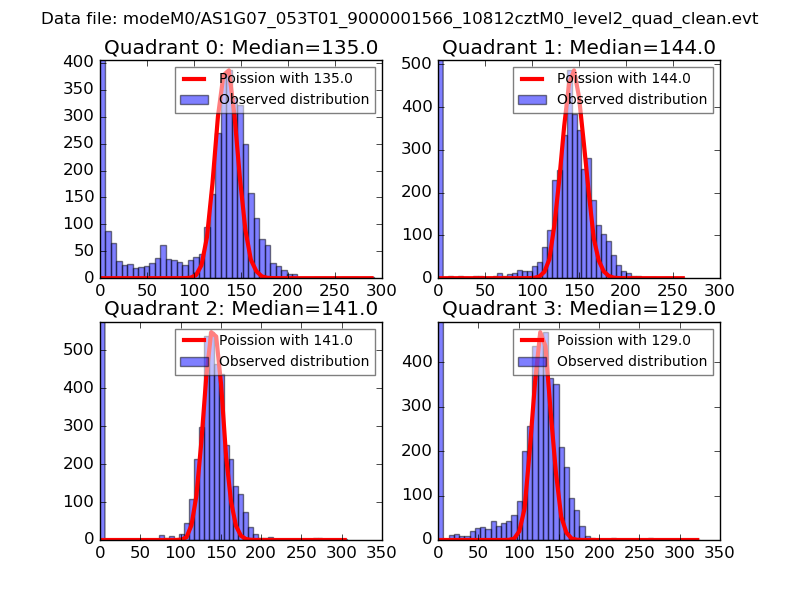 |
 |
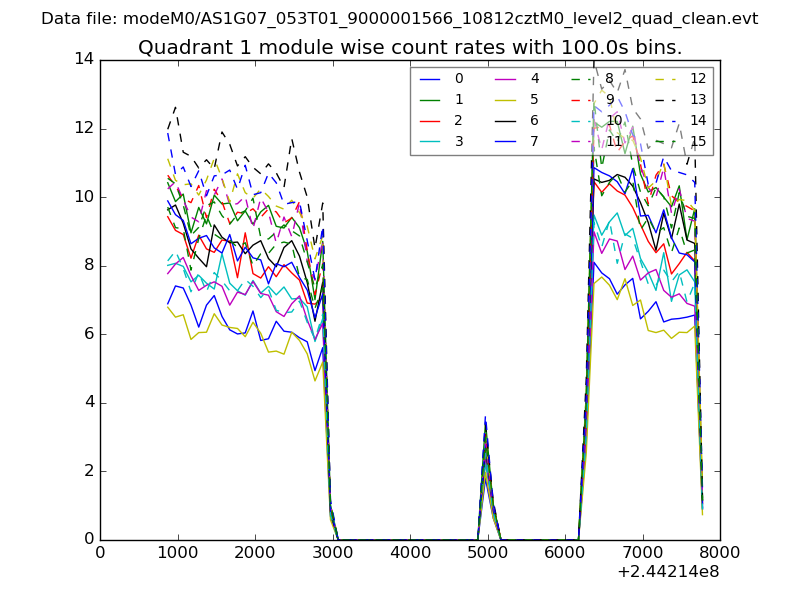
| Quadrant-wise count rates Data is divided into 100 sec bins |
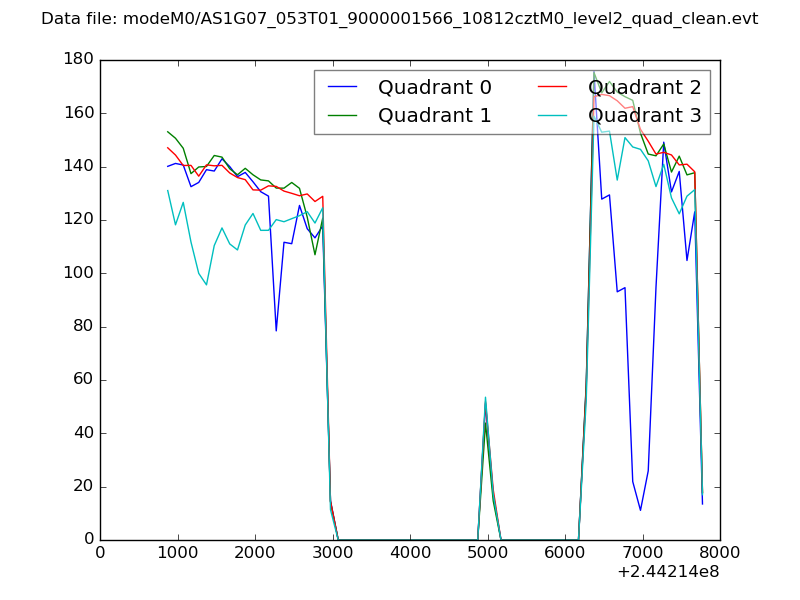 |
|
| Module-wise count rates for Quadrant A Data is divided into 100 sec bins |
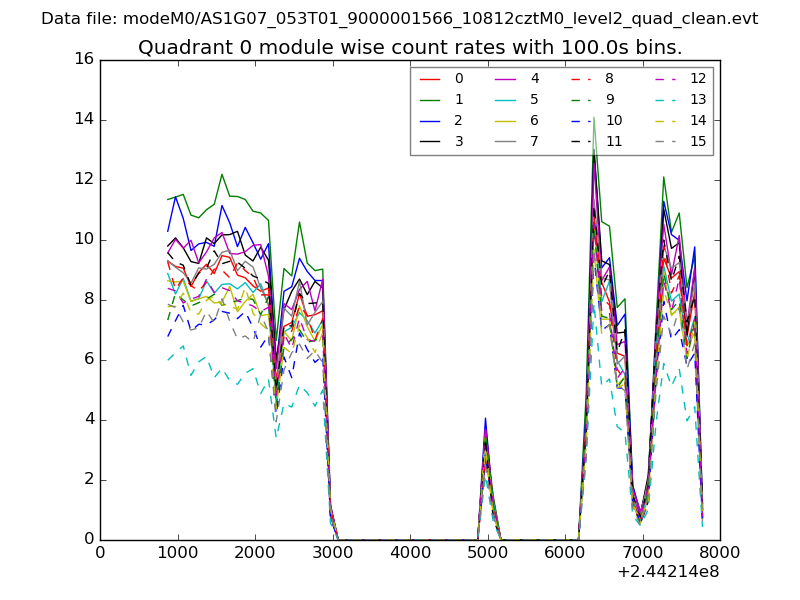 |
 |
| Module-wise count rates for Quadrant B Data is divided into 100 sec bins |
 |
 |
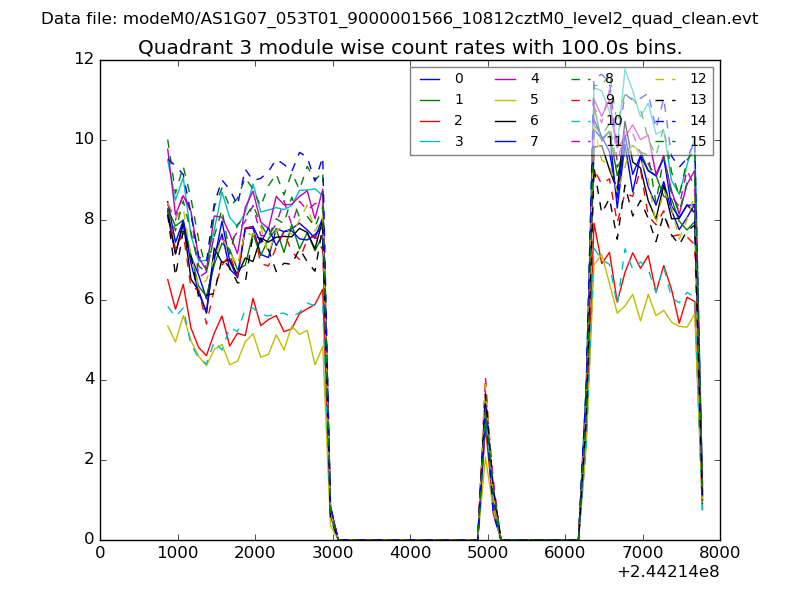
| Module-wise count rates for Quadrant C Data is divided into 100 sec bins |
 |
 |
| Module-wise count rates for Quadrant D Data is divided into 100 sec bins |
 |
 |
| Parameter | Plot |
|---|---|
| CZT HV Monitor |  |
| D_VDD | 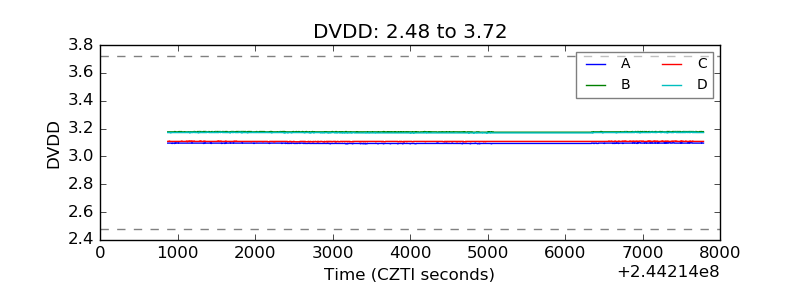 |
| Temperature 1 | 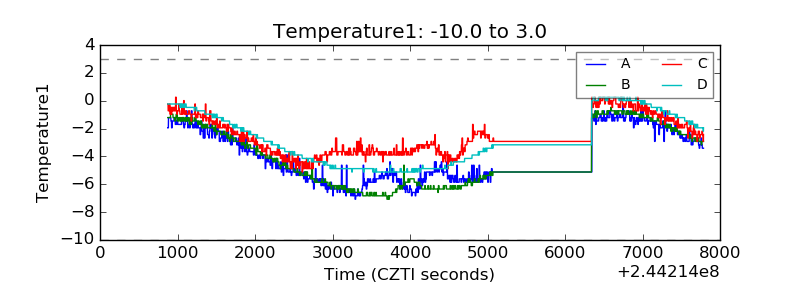 |
| Veto HV Monitor | 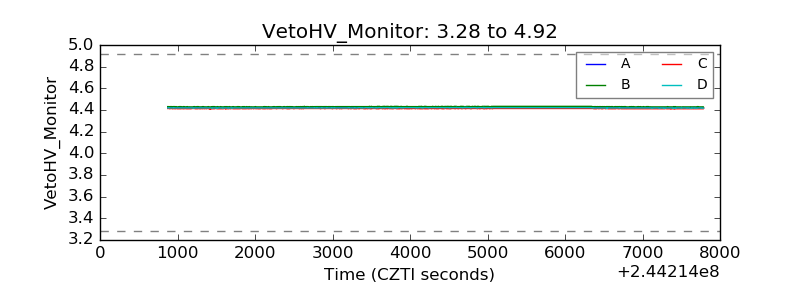 |
| Veto LLD | 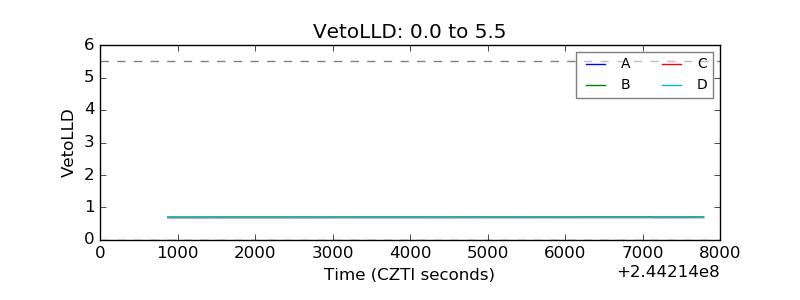 |
| Alpha Counter | 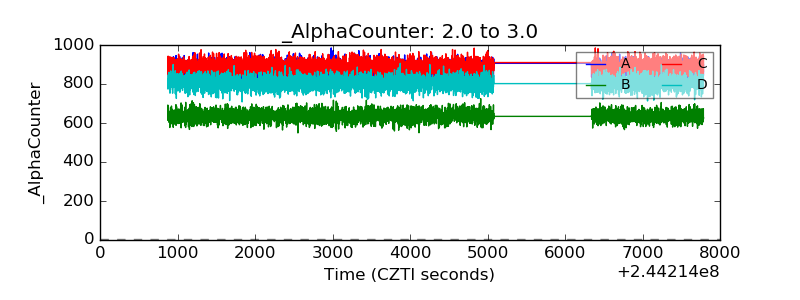 |
| _CPM_Rate | 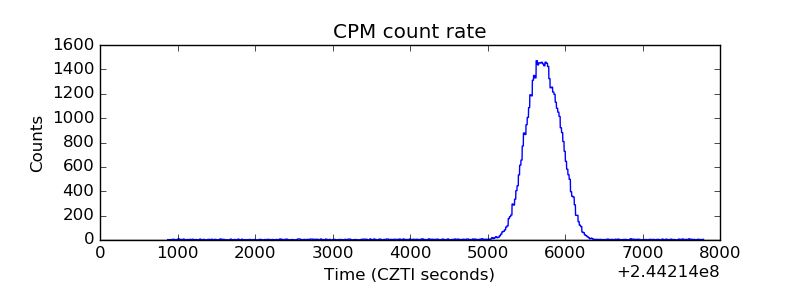 |
| CZT Counter | 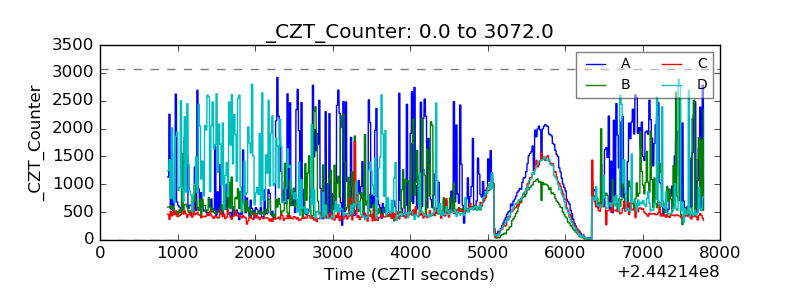 |
| +2.5 Volts monitor | 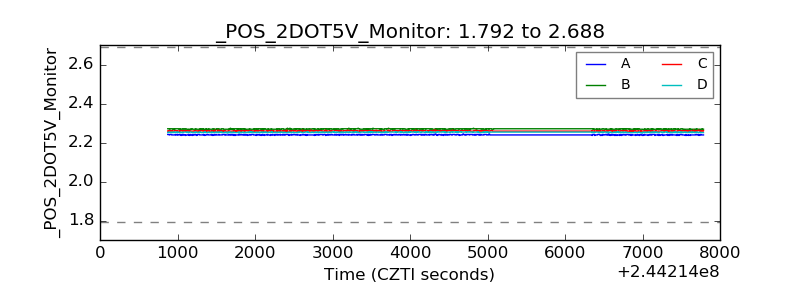 |
| +5 Volts monitor | 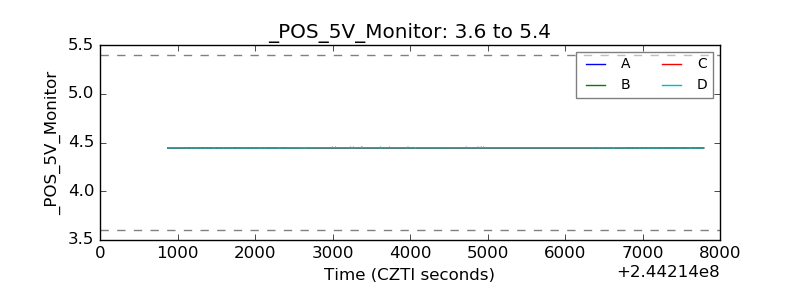 |
| _ROLL_ROT | 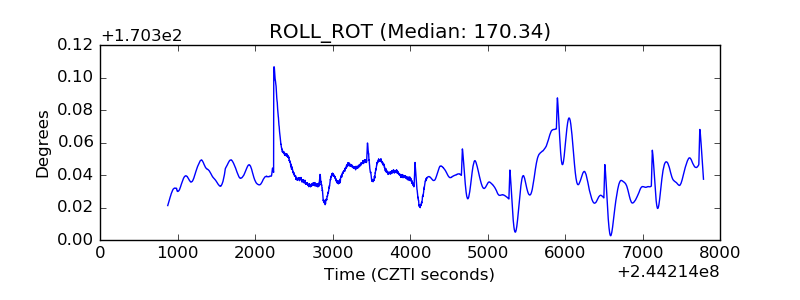 |
| _Roll_DEC | 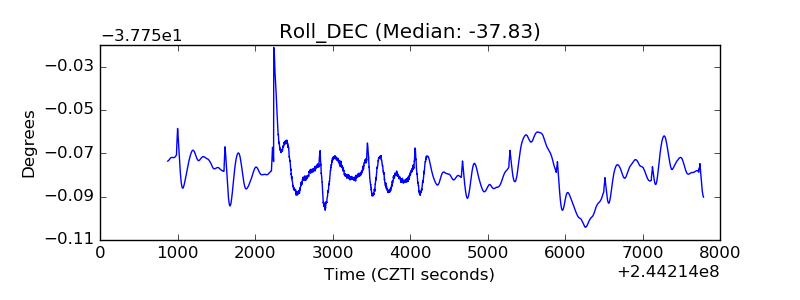 |
| _Roll_RA |  |
| Veto Counter | 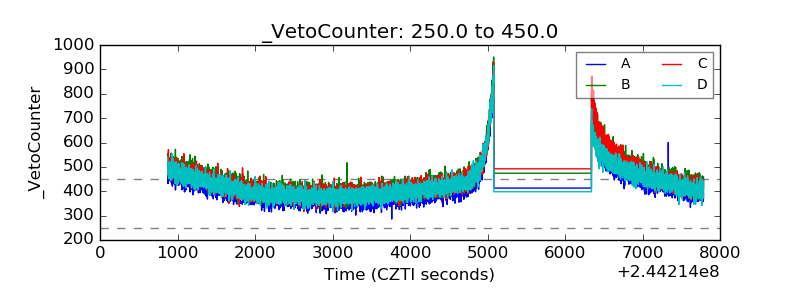 |